Chapter 3: Building a
resilient IT environment
Handling incidents
We've combated various types of incidents over the last two decades by handling them with our well-established IM framework and experienced technicians. However, as ManageEngine grows everyday, we add more users and expand our infrastructure. Consequently, our IT environment faces an intense workload. Our IT operation teams have the responsibility of maintaining a resilient IT environment. Thankfully, our IT teams are equipped with AI systems to help them tackle incidents.
Our AI system aids the IM process during the following stages
- Detecting the incident
- Responding to the incident
- Finding the root cause of the incident
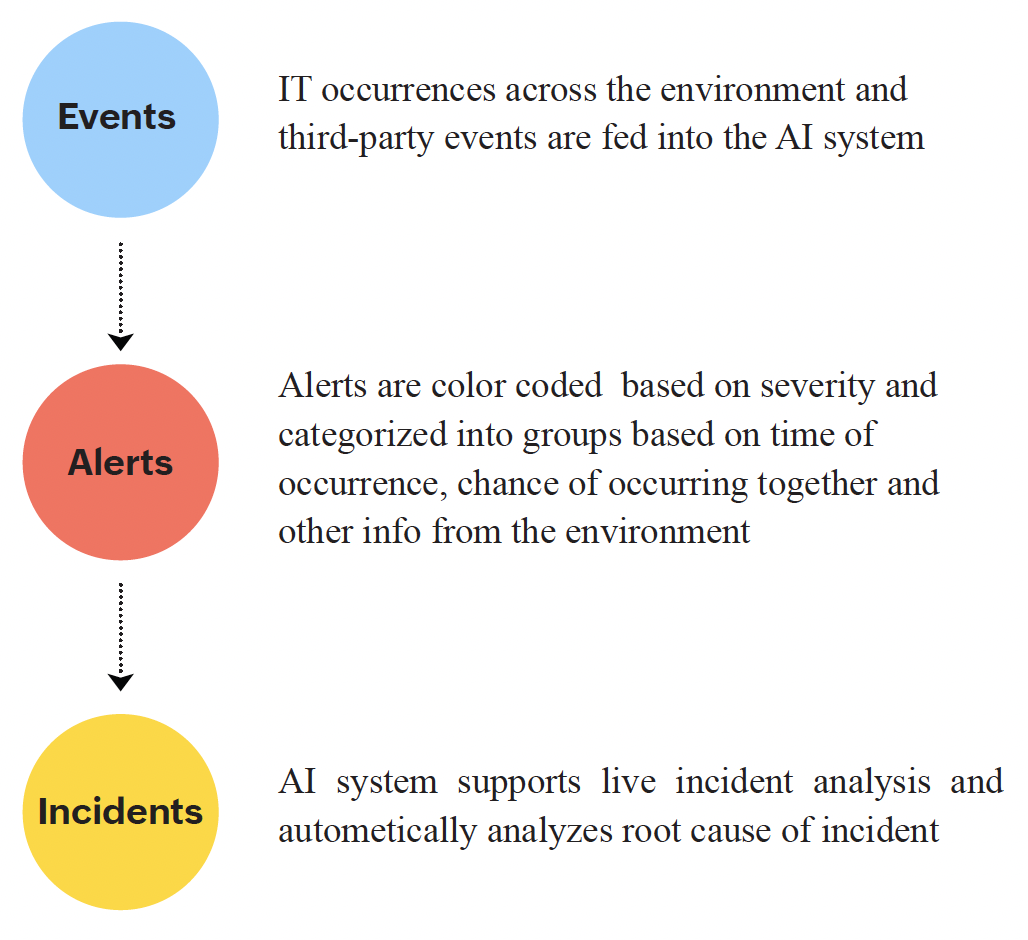
Figure 2: How our AI system detects incidents
Detecting an incident
An incident is essentially an event that leads to a significant negative impact on our IT environment. While numerous events occur in our IT environment, not all of them lead to incidents. Our AI system, however, collects data about all events. An event could simply be updating a firewall or updating a server. Our AI system has all these real-time and third-party events fed to it.
Subsequently, events that require action generate alerts. We have static alerts, and other alerts generated by our AI system that consolidates these alerts into relevant groups. Each incident can now be visualized as a sequence of alert groups. Clusters of alert groups based on time of occurrence, chance of occurring together, and causal links from the information of the IT environment give a good picture of when an incident is occurring and how it occurred.
Responding to the incident
Once we detect an incident, we assign it to the relevant IT teams who must respond to it. Our AI system names each cluster of alert contextually so that it reduces the mean time to assign (MTTA) issues to relevant internal teams significantly.
Furthermore, our AI system provides IT teams with live incident analysis with events, timelines, and sources of events.
Finding the root cause
Root cause analysis (RCA) is an important part of our IM process. Our AI system generates an incident map to trace the incident and corresponding alert groups back to their root cause(s).
Use case: Let's say we are facing a network downtime. Here's how our AI system helps to manage this incident.
Step 1:
Our AI system analyzes the event dump to identify when an incident is occurring. Any observable occurrence that happens in our IT environment would be an event. General occurrences would be recorded, like updating the server that faced the downtime, modifying the OS, and rebooting it. Other major occurrences, like related ISP outages, failure of network components, and human errors like mistakes in deployment, and possible cyberattack attempts, would be considered events. The AI system categorizes these events and traces them back to the source. Now, we know there is an outage and what led to it.
Step 2:
Let's say we figured out that a mistake in deployment caused this outage. Our AI system traces back the events that caused it. We have the live incident analysis as a map with a timeline of events as shown below:
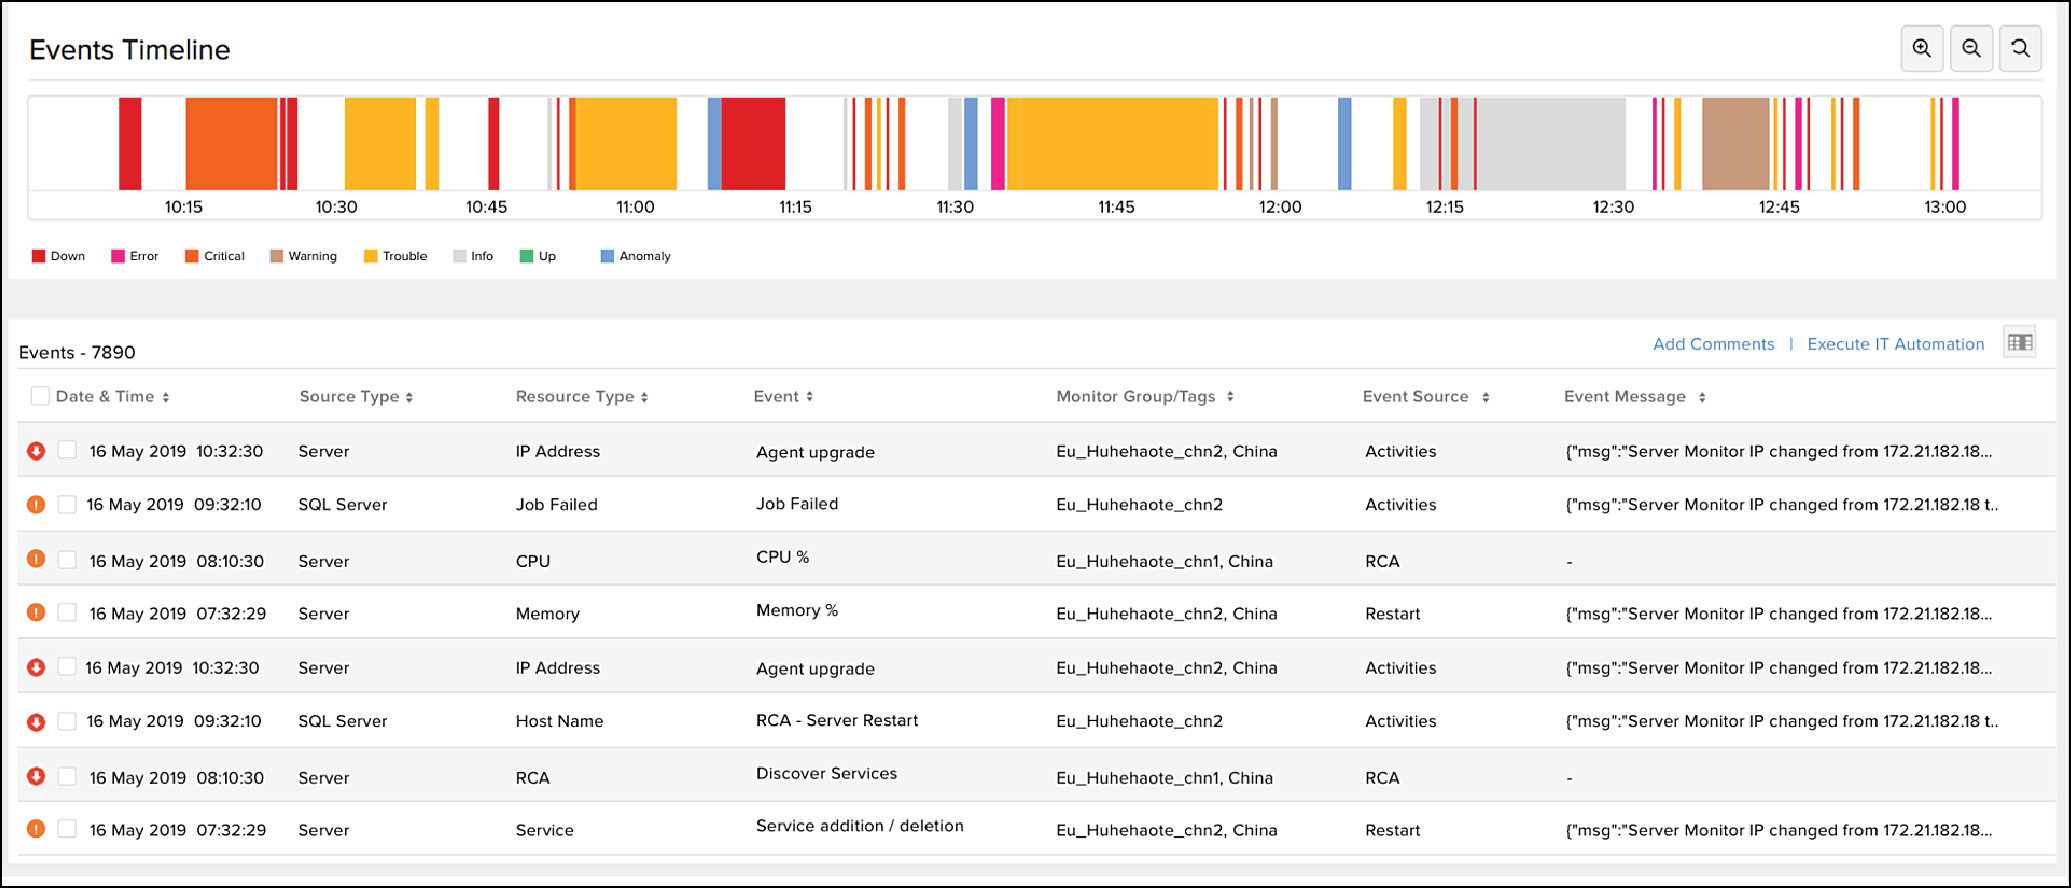
Figure 3: Live incident analysis by our AI system
To respond to this incident, we review the clustered alert groups and assign tasks to the concerned teams.
Step 3:
Let's say our AI system figured out that an unscheduled OS update on a server had causal links to the outage. We can trace back all such outages to the causal events. Alternatively, if an APM monitor is down, the logs and alerts could backtrack to a minor error in the build update. Thus, the model traces and points all outages back to the initial cause to rectify it. Further, the model proactively predicts the next events or alerts that might occur.
Challenges in traditional IM process |
How the AI-powered IM process solves it |
|
The incident management team coordinates with respective IT teams, creates chat groups, works with the IT team to figure out why the incident has occurred. This process takes time and there is a chance the IT team might not have visibility of crucial events that lead to the incident. |
Our AI system collects data on all events, categorizes them and automatically traces them back to the source. The IT teams can now start their process with much more clarity on what led to the incident. |
|
A lead technician of the IT team reviews the incident, gathers the necessary information about it, and manually assigns the team members. The lead technician might have to guide them on how to approach various aspects that caused the incident. |
Our AI system provides the lead technician with a live map of the incident, with events leading to it. The clustered alert groups make it easier to assign tasks and provide clarity on which area to work on. |
|
The IM team works with concerned IT teams, involves them in meetings, comes up with an RCA, and finalizes on action items to ensure the incident does not repeat. This involves time and the teams may not be equipped well enough to predict if a similar incident might occur in the future. |
Our AI system traces back incidents to their root cause(s), and predicts the next events or alerts that may occur. The IM team can use this data to expedite the RCA process and proactively work on preventing the next occurrence. |
Forecasting
Forecasting helps predict future events by learning patterns from historic data. Given a time series of data (a metric polled across uniform time intervals), our AI system predicts the imminent possibilities. Forecasting helps us in decision-making as it sets a projection on future values that can be expected.
Our AI system takes the following into consideration to produce accurate forecasts:
Source of the data
Pattern structure of data
Pattern direction of data
Noise in the data
Once the system understands the characteristics of the data described above, the system performs forecasting using different models. Depending on whether the time series is seasonal or non-seasonal, different models come into play. For example, we monitor bandwidth consumption to forecast future usage. On specific occasions, like Black Friday, there is increased consumption, and these seasonal components are considered before using a model. If we notice the time-series data to be non-seasonal, we use a regression model for prediction. We also use certain performance indicators to choose the most appropriate model for the given time series.
Let's consider a few use cases where forecasting has been useful to us-
Use case |
Results |
Use case -
|
Results - Without AI:The IT manager must constantly be aware of how much disk space is being utilized. A human error could mean a delay in business outcomes like launching a new application or deploying a new server. Results - With AI:With AI: The IT managers know exactly when the disks will reach full capacity, and can plan a suitable course of action. 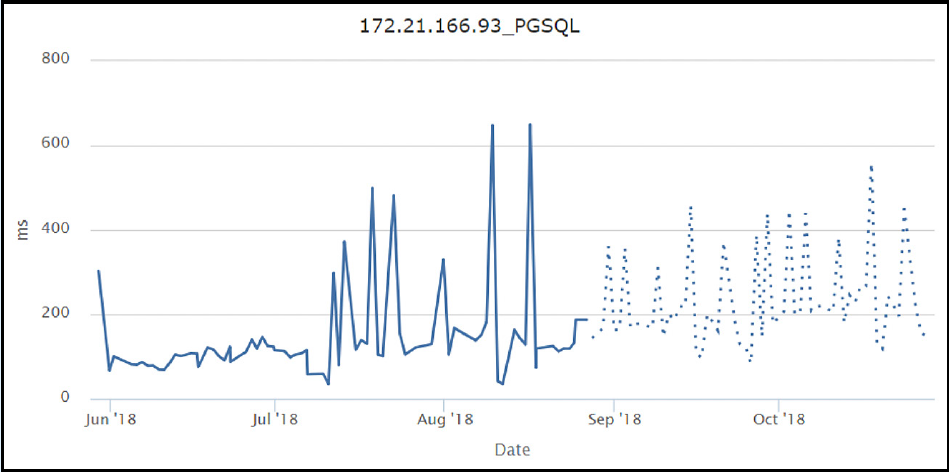
|
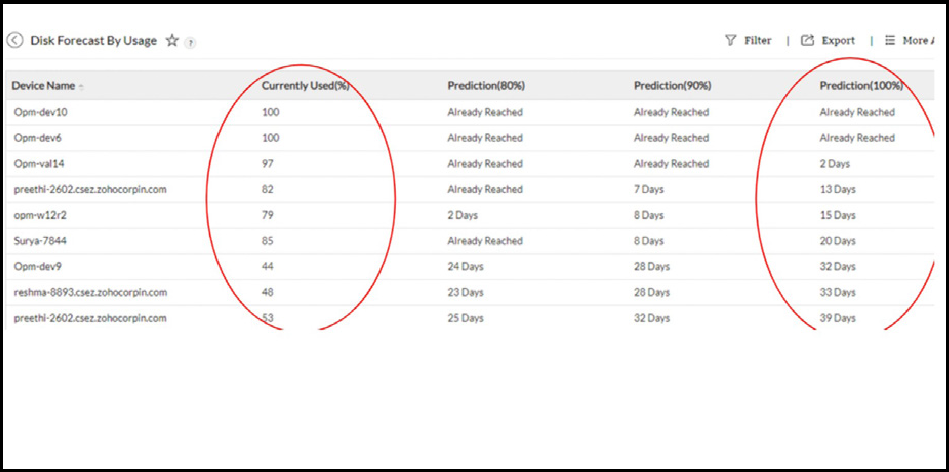
Use case - Forecasting in and out net flow packets:Given the previous in and out net flow data, the system predicts how much in and out flow packets will occur in the next period. In the adjacent image, the dotted line represents the forecast net flow packets for the next seven days. |
Results - Without AI:Netflow congestion can occur and cause a disturbance to regular business. The IT team must find the users, applications or protocols that cause the congestion and fix them. Results - With AI:Netflow congestion can be predicted beforehand, and the IT teams can take preventive action to sustain normal business operations. 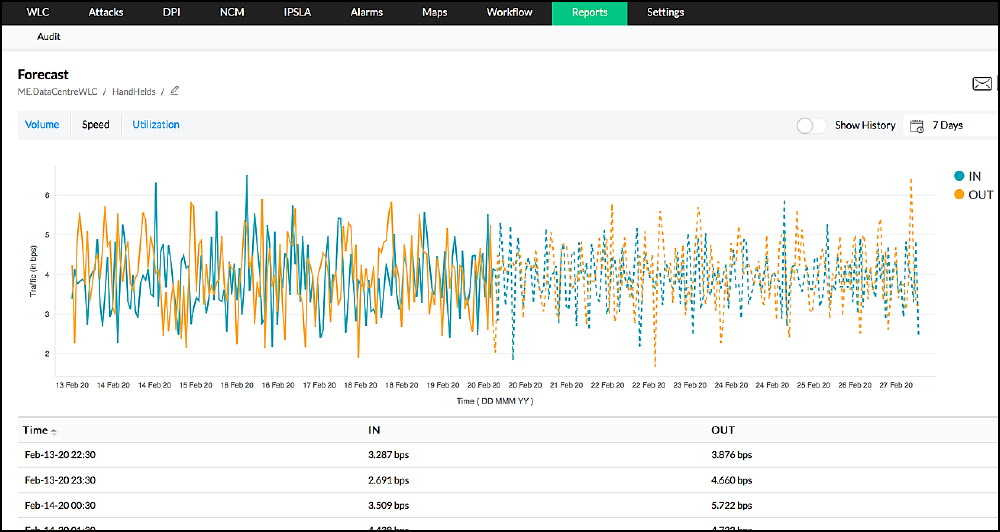
|
Detecting anomalies
Our AI system monitors live data and captures unusual aberrations or spikes, called anomalies. Live anomaly detection by our AI system helps improve monitoring aspects and create a resilient IT environment. The system is modeled to spot different types of anomalies from a wide range of data. In fact, any data collected extensively is bound to have certain properties such as trend and seasonality.
For example, consider network traffic data. During peak working hours, the traffic would be massive compared to late evenings. This occurrence can't be termed as anomalous. Seasonality addresses the pattern flow in a certain period, say, the network traffic from a particular IP address is higher than usual. Also, during a new release or while testing a new product, the traffic might be higher than any regular day. To account for these irregularities, the model has components to smoothen the trend and handle seasonality before speculating the data for anomalies. The anomalies are then presented to the our network operations team along with explanations and expected values which help in handling the unusual traffic. Here's how our AI system detects anomalies:
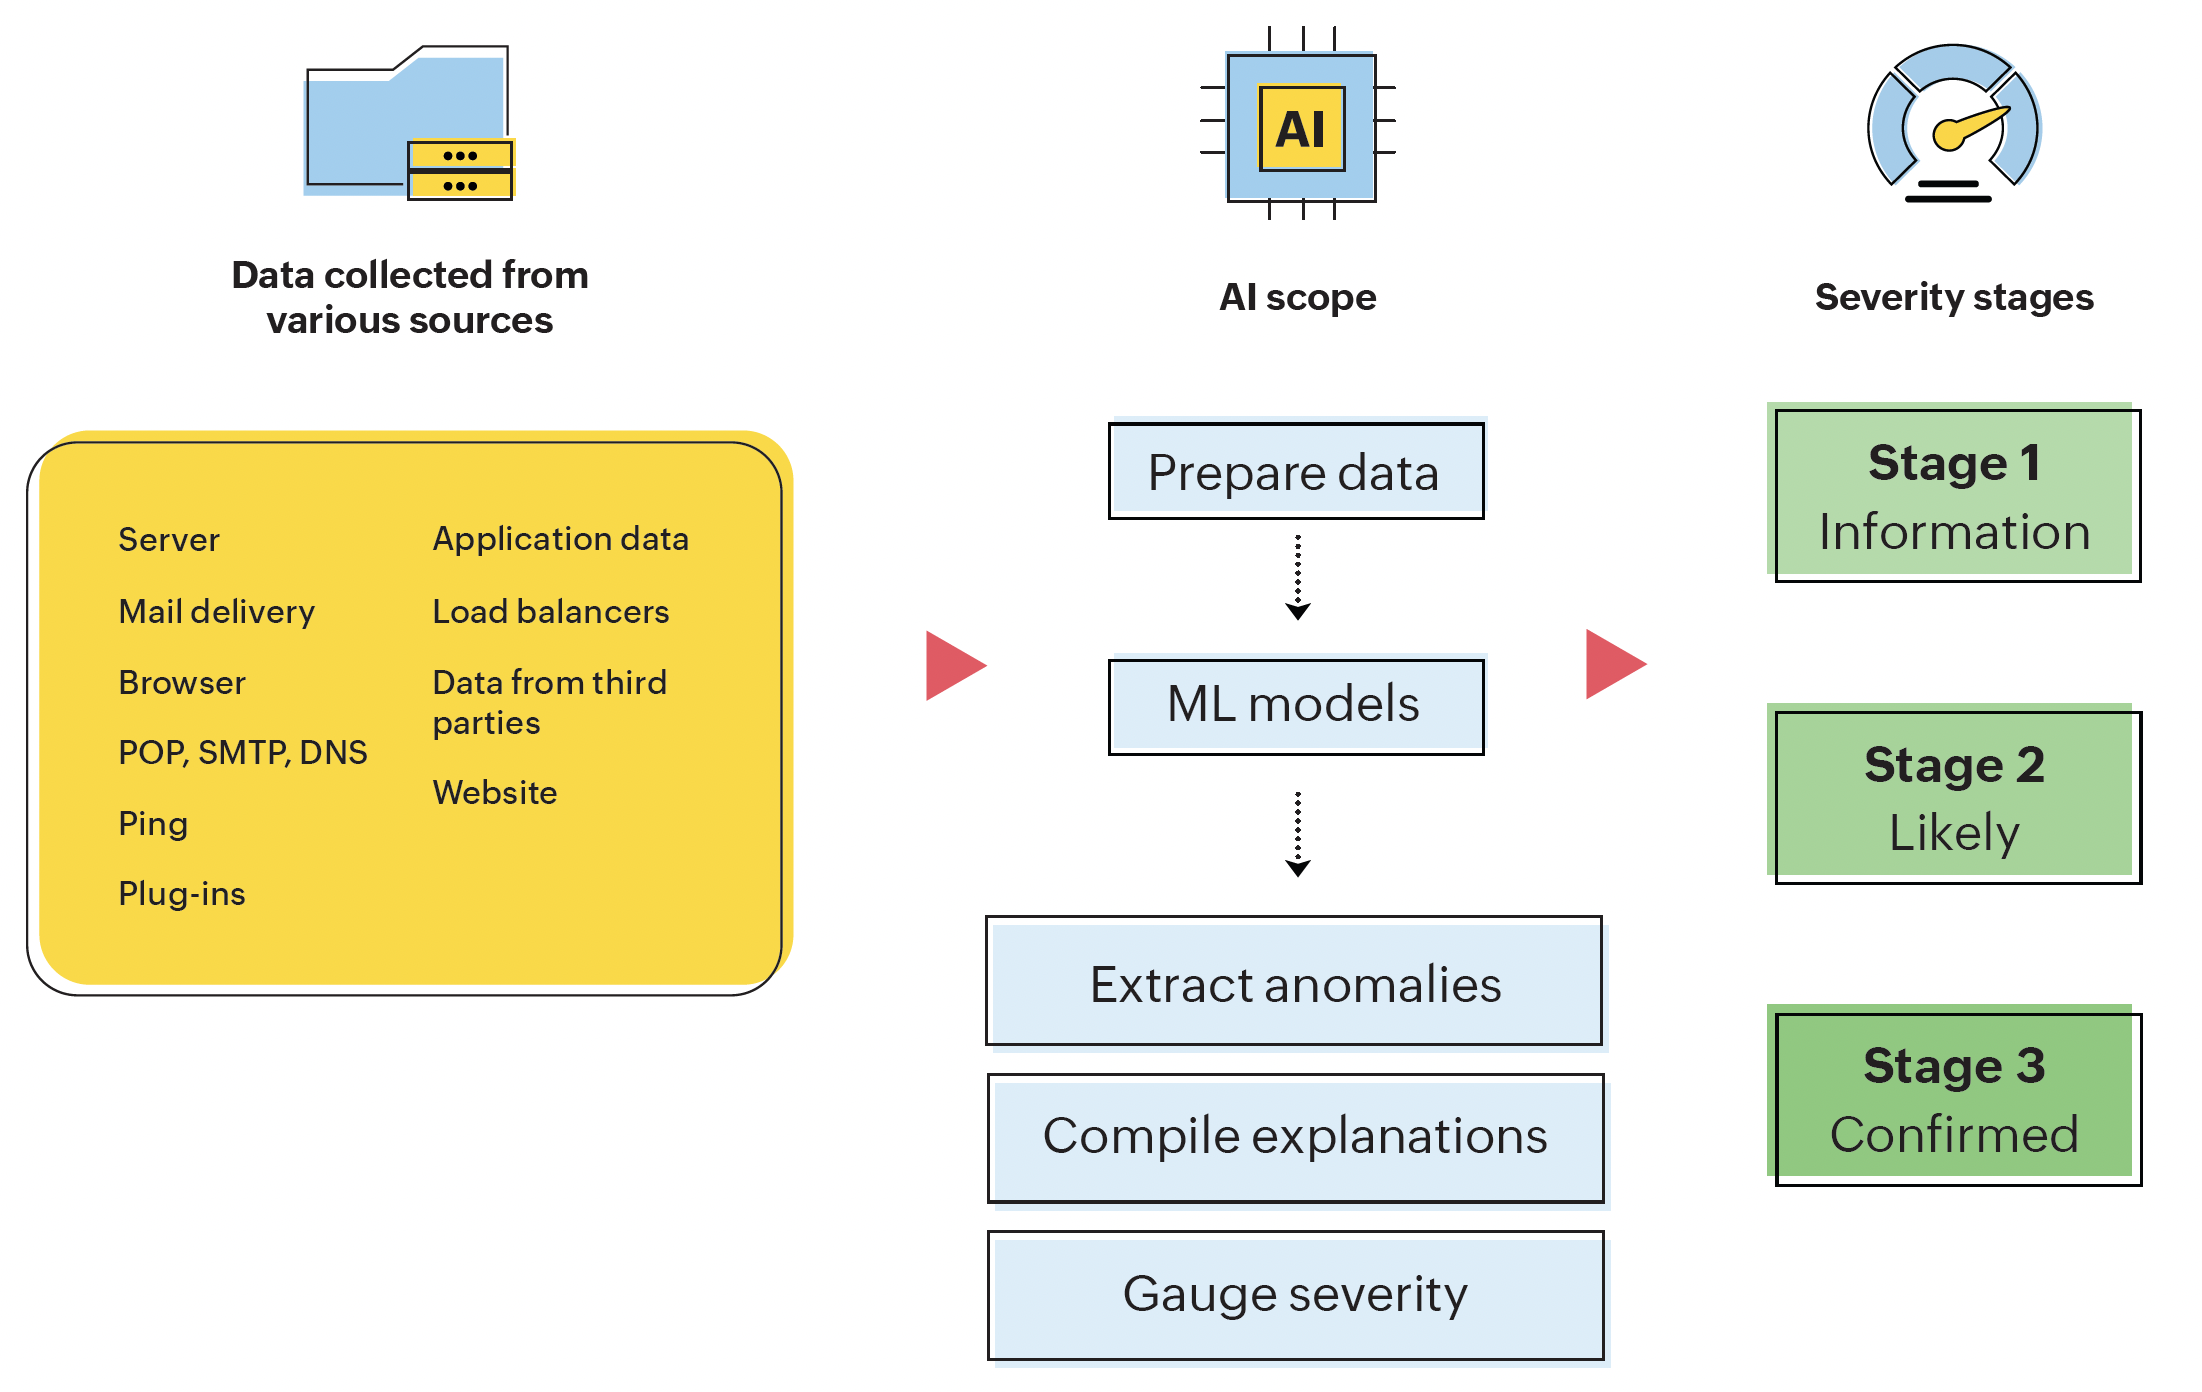
Figure 4: Anomaly detection method of our AI system
Our AI system is trained to detect two types of anomalies:
1. Univariate Anomaly:
Detect anomalies in one variable, like response time, and disk usage.
2. Multivariate Anomaly:
Detects the state of the system by capturing multiple metrics and establishing a correlation between them, like CPU utilization, and memory utilization.
Univariate anomaly
Our AI system treats the variable being monitored as a time series where the variable is polled with respect to time across uniform intervals. A crucial aspect of our AI is to smoothen trends and handle seasonality in the monitoring data. Any metric under live monitoring exhibits a characteristic behavior of its own kind, the main behaviors being trends and seasonality.
If not treated properly, trends and seasonality in a data set can interfere with actual aberrations, thereby reducing the accuracy of anomaly detection. Our AI system handles this by capturing the overall pattern direction (rise or fall). Likewise, the system also handles seasonality, which is the pattern structure that keeps recurring more or less in each time frame.
In Figure 5, we see how the process flows:
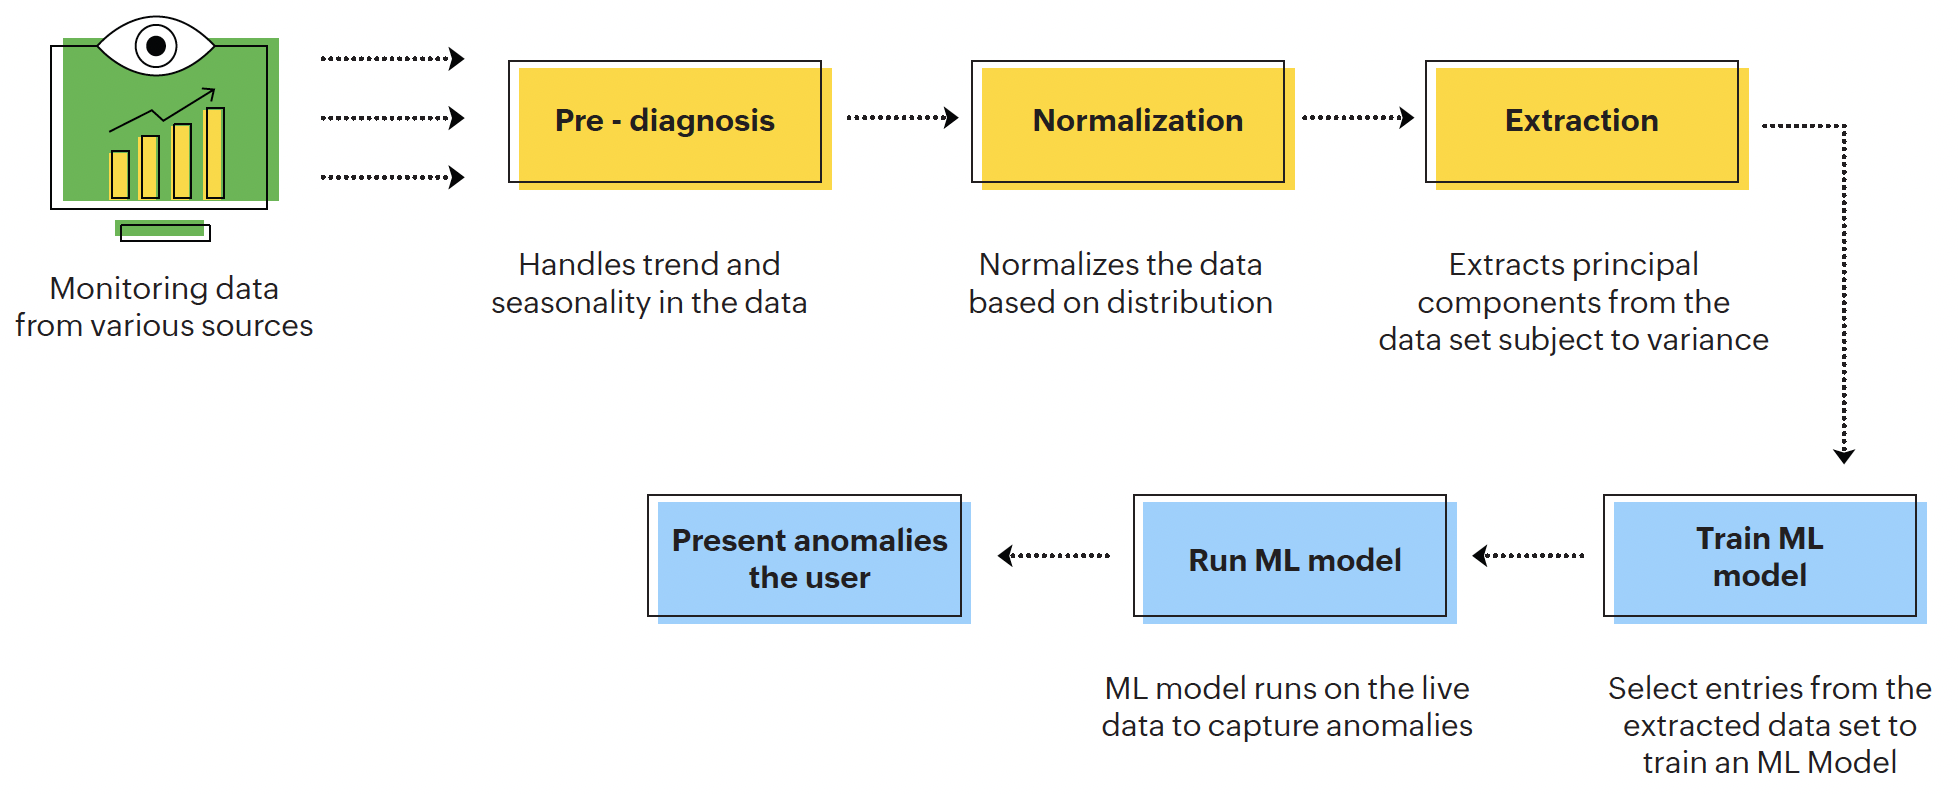
Figure 5: Process flow diagram for univariate anomaly detection
After pre-diagnosis, the data is normalized depending on its distribution. The system extracts the first few principal components from this normalized data set. The system chooses components such that the anomalies can be best represented with the dimension of the highest variance.
This approach simultaneously detects the corrupt entries and efficiently fits the components to the other reliable entries. The selected components then train a ML model, in order to remove extreme anomalies present. Once this model is executed, our AI system extracts anomalies and presents them to the user.
Multivariate anomaly
In an IT environment, multivariate anomalies can occur under the following conditions:
- Aberrations due to more than one individual parameter.
- Aberrations due to combination of two or more parameters.
- Aberrations due to disproportionate change in one element with respect to another.
When anomalies occur to one of the above, our AI system follows a different strategy. Besides detecting these anomalies, our AI system invokes the system to provide rationales on the cause and consequence of the aberrations, and the corresponding corrections to be made.
For multivariate anomaly detection, our AI system first captures the behavioral patterns of each metric being monitored live. As in the case of univariate anomalies, our AI system speculates these metrics as a collection of metrics polled across uniform time intervals.
The data on each metric, when spread over a multi-dimensional space, marks horizons. Live streaming of incoming metrics over this space aids in detecting when the system shows abnormalities or aberrations. The system then analyzes the space to find the perfect fit, and those outside the space are categorized as anomalies. Our AI system then uses adaptive learning capabilities to update the other endogenous contextually, non-anomalous data points in the space.
Below are some use cases from our IT environment for anomaly detection-
Use case |
Anomaly detected |
|
Our IT team monitors multiple parameters of our servers. When we receive a complaint that there is an issue about the performance of an application, our IT teams use our AI system's anomaly detection to analyze the important parameters closely. Parameters such as CPU, disk space, memory, uptime, ping, and DNS could give us an indication about how our servers are responding to our IT environment. Our AI system detects anomalies in server monitors and then accelerates root cause analysis. |
Multivariate anomaly detected, with explanations to the user |
|
If we receive a complaint that response time has degraded for websites that we monitor in specific regions, our AI system detects this abnormal behavior in web response time and links to an alerting platform. The platform then notifies our IT teams and starts the incident management process. The degradation in response time could be rapid due to a sudden issue with the ISP, or it could be gradual due to a memory leak. Either way, our AI system captures the behavior with explanations and helps with RCA as well. |
Univariate anomaly detected, with explanations to the user |
|
Our applications are accessed through various mobile devices. Sometimes, there is a variation in performance while being accessed by various types of devices. To capture the user experience accurately, we monitor the user behavior directly. Anomaly detection on RUM metrics helps us monitor critical data to improve user experience. For example, we monitor load actions like request start, navigation start, speed index metrics to understand a user's interaction with an application. |
Multivariate anomaly detected, with real user monitoring (RUM) |
|
To manage application performance, our AI system collects data on raw metrics like Exception counts, request counts, and response time. Monitoring such raw metrics on selected time periods helps us detect anomalies better and improve the RCA. |
Univariate anomaly detected on-the-fly for improving application performance |
Predicting outages
The last stage of the anomaly detection process was severity scaling with color coding. Once our AI system predicts an anomaly, we know how severe it is with three severity stages:
When our AI system encounters an episode of critical abnormalities, it predicts whether it would lead to an outage. The prediction is based on the following:
- Behavior of the attribute or the group it belongs to
- State of the system before the outage
- Capacity of the infrastructure
It helps to predict which infrastructure entities might get affected, by how much, and by when. Depending on the type of anomalies, our system uses various methods to evaluate if the system is in a critical state. Here's how our AI system predicts outages:
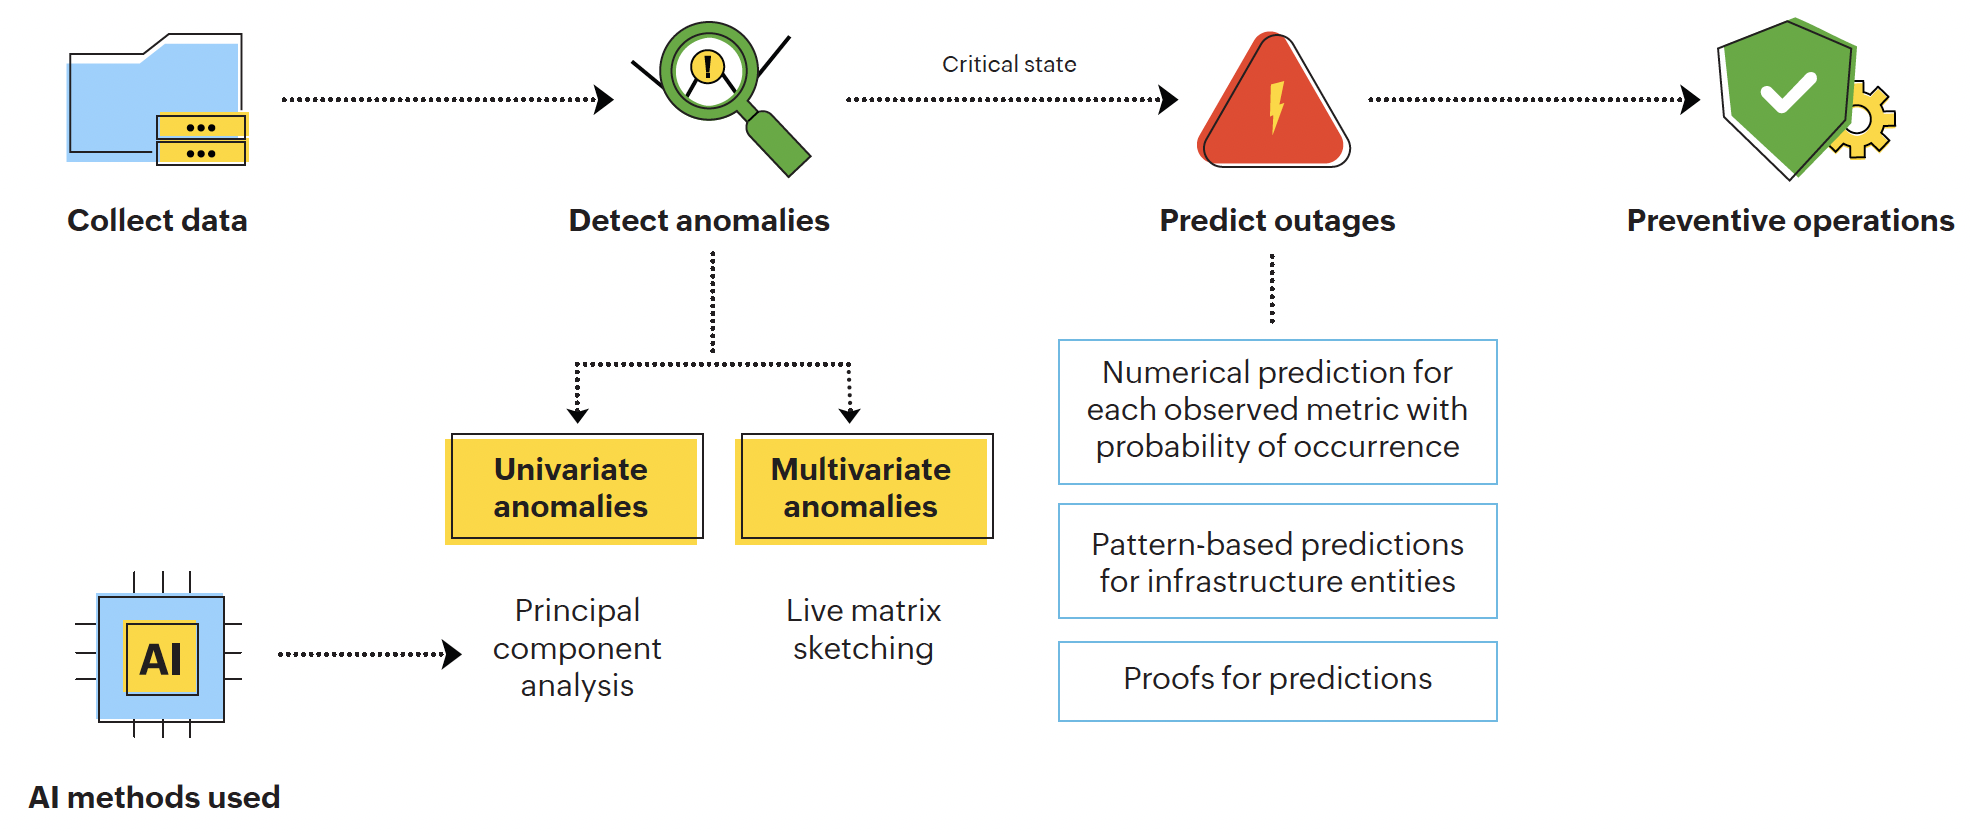
Figure 6: Process flow diagram for outage prediction
Using various numerical and pattern-based predictions with proofs, our system predicts the outages. Our IT team uses this data to perform preventive operations to avoid the outage.
Our AI system predicts outages based on the behavior of a metric before the outage and the capacity of the infrastructure. It can also be based on the group the metric belongs to. For example, let's say there is a record of an outage that had previously started off with the APM instances going down, followed by the CPU and then the server. If the same pattern repeats, our model grasps it and analyzes if it can lead to an outage again. Based on the exact values of the metrics, it predicts the severity or likeliness that this situation could lead to an outage.