ManageEngine's ITOM framework
Setting up a monitoring apparatus
Managing everyday operations
Maintaining a stable ITOM environment
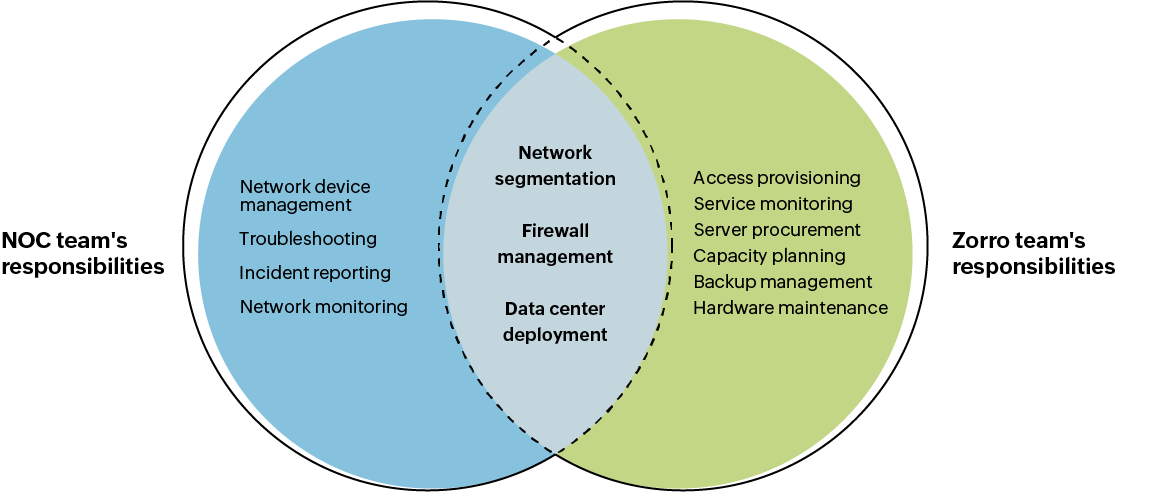
Above are the three main components of our ITOM framework. We have two designated teams to manage this framework:
1) Network operations center (NOC) team:
This team monitors the LAN, WAN, and network devices out of a central location: our corporate office in Chennai. Its scope of work includes analyzing problems with network devices (switches, routers, and firewalls), troubleshooting issues, reporting incidents, communicating with site technicians, and tracking problems through resolution.
2) Zorro team:
This team manages servers and load balancers in our DCs. Its scope of work involves maintaining, managing, and continually improving the performance of Zoho's DCs.

1. Setting up a monitoring apparatus
Monitoring networks
Our monitoring apparatus gives us a comprehensive view of our network. ManageEngine's network monitoring has two major functions:
Monitoring corporate offices
Monitoring DCs
We have a 24/7 command center equipped with screens giving us visibility all across our network in both corporate offices and DCs.
We have DCs in India, the US, Europe, China, Australia, and Singapore. In most of these countries, we have multiple sites that hold our customers' data. We are also expanding our DCs to more locations because our user base increases every day.
We have our corporate network also, with our main corporate office in Chennai and backup offices in Tenkasi and Renigunta.
To monitor such a widespread network, we need three things:
Visibility across the entire network
Alerts to notify us of abnormalities
A team of technicians who offer 24/7 support
by working in rotation

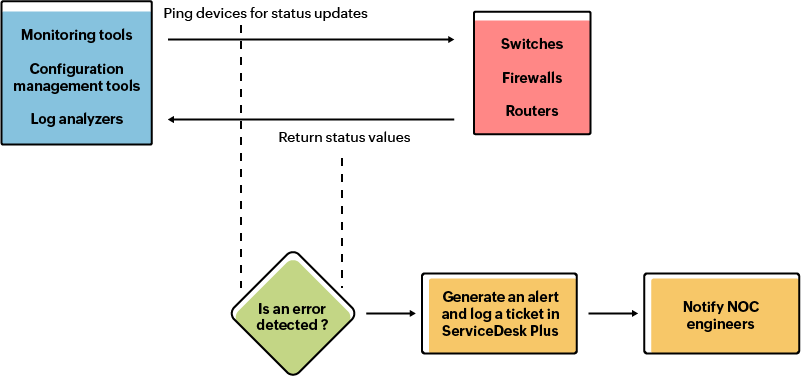
The NOC team uses in-house tools and a few external applications to monitor network performance and the uptime of network devices in all DCs. We use monitoring tools, configuration management tools, traffic and log analyzers, and more. These tools constantly ping the network devices for status updates, and if an error is detected, they generate an alert. The alert details are sent via email, which is then logged as a ticket automatically in our IT service desk.
Then the NOC engineer contacts the remote support engineers at the respective corporate office or DC via phone to resolve the issue. Upon resolution, the original alert is cleared in the monitoring tool and the ticket is marked as closed by the NOC engineer.
The NOC team monitors the following devices:
Switches:
The NOC team monitors the uptime, availability, and resource usage of switches using our monitoring tools. It also uses log analyzers to receive and analyze the alerts from syslog messages. We also analyze the interface traffic in switch ports using our in-house traffic monitoring tools.
Firewalls:
Similar to switches, the NOC team monitors the uptime, availability, resource usage (CPU, memory, and disk), and redundancies in firewalls using our monitoring tools.
Routers:
In our integrated DCs (IDCs), we monitor memory utilization and interface usage. Our ISPs handle routers in our corporate offices.
Monitoring DC performance
We use our in-house monitoring tools to get insights into our performance and dashboards to understand the trends of monitored parameters. We use the load balancer dashboard, event dashboard, service map dashboard, and more to understand how various components in our DCs are performing. Above all, we use a monitoring apparatus that gives us an eagle eye on all our DCs.
If a certain component or process within a component is abnormal, the dashboard will display it as an event while sending an email alert to our Zorro team and the other teams concerned.
The dashboard we use the most is the network dashboard, which is unique for each DC. We use the following insights from the network dashboard to understand the performance of our DCs and to take necessary action:
- Availability of servers
- Available disk space
- File system errors
- Hardware failures
- RAID status
- Application ports down (like MySQL and web servers)
- DNS lookup failures
- DNS time lag
- Power usage of various clusters
- Backup status
- Server uptime
If any one of these parameters is not functioning according to our set of standards, we receive alerts on our visual monitoring dashboards. These alerts remain on the screens until an engineer from the Zorro team resolves the errors.
In addition to the other monitoring tools we use for DCs, we use Site24x7, our in-house monitoring service, to monitor the availability of Zoho's services from different geographic locations across the globe. Like in our DCs, we establish automated email alerts for the respective application teams and the Zorro team for when a particular service is not available in a monitored location.
In conclusion, both the NOC and Zorro teams monitor various aspects of our IT operations. Our monitoring apparatus, which gives us visibility across our network, helps the teams act as needed.
2. Managing everyday operations
Overall management
ManageEngine uses a primary management tool known as Zoho Admin Console (ZAC) to manage major IT operations:
- Inventory
- DC infrastructure
- Alerts and notifications
- Server allocation and provisioning
- Load balancer configurations
- Domains and certificates
ManageEngine uses a wide range of tools to manage various ITOM requirements.
|
Tool category |
ITOM requirements |
|
Tools for monitoring traffic |
|
|
Tools for managing device configurations |
|
|
Tools for analyzing logs |
|
|
Tools for other IT operations |
|
Troubleshooting
In the previous section, we saw how the NOC and Zorro teams use monitoring tools to understand how our network is performing. Monitoring certain parameters helps us spot when there is an issue. However, to manage those issues on a regular basis, we need troubleshooting guidelines.
These guidelines provide quick action plans for the engineers when they see an issue with the monitored parameters. Here is a sample of such issues and the required troubleshooting actions:
|
Category |
Objective |
Troubleshooting action |
|
Availability of servers |
To ensure servers are in a condition to execute the assigned workload |
Use the Intelligent Platform Management Interface to contact the hardware end of the server and fix the issue. |
|
Available disk space |
To ensure the disk has sufficient storage space |
Replace the disk when an alert is generated for low disk space. |
|
File system errors |
To ensure storage disks are not corrupted |
Replace the disk when an alert is generated for file system errors. |
|
Hardware failures |
To ensure there is no failure of hardware components that might cause a drop in performance |
Repair or replace the faulty hardware depending on the warranty status. |
|
RAID status |
To ensure all the disks in the RAID are available |
Replace the disk if a disk in the RAID setup is unavailable. |
|
DNS lookup failures |
To ensure the domain is reachable |
Perform a DNS lookup and check the DNS service for errors. |
|
Application ports down |
To ensure applications are available |
Notify application teams to restart the application ports. |
Access controls
Access control mechanisms are a crucial part of managing everyday operations. We deal with the following aspects in access control:
- Physical access
- Logical access
- Access to sensitive areas
- Access for non-IT teams
|
Access type |
Scope |
Provided by |
Approved by |
Governed by |
Physical access |
Access to NOC rooms, server rooms, asset storage rooms, and IDCs |
The HR team raises a request through a dedicated access control application for employees who wish to access certain spaces. The Building Management System and the HR team provide the required access. |
A manager from the Zorro team reviews the purpose of the request and approves it through the access control application. |
The physical security policy and access control policy |
Logical access |
Access to the IT operations admin console, IT ticketing system, monitoring tools, password management tools, and other related tools |
A senior member of the team raises a request through the access control application via a separate access creation form. The request is then forwarded to the concerned team that must provide the access. |
A manager from the respective team approves the request through the access control application. |
The access control policy |
Access to sensitive areas |
Access to IDCs, physical access to DCs, and access to DCs from remote locations |
The employee raises a request through an app dedicated for such access. The Zorro team processes it by creating an account for the user in that app after a senior member approves the request. |
The request is first approved by the manager of the employee who raised it, then by the Zorro team after reviewing it. |
The information security policy, access control policy, and physical security policy |
Well-defined policies, processes, and applications help us manage access controls in a smooth, secure manner.
OS management
The Zorro team configures and manages OSs on all our servers. OS management is critical to ensure high availability and security. The Zorro team performs OS hardening to comply with the required security standards. It also performs patch management to ensure protection from vulnerabilities.
The Zorro team carries out OS hardening to remove unwanted packages and install the OS with minimal requirements. The process of hardening has three phases: preparation, installation, and hardening.
|
Preparation |
Installation |
Hardening |
|
|
|
We test the hardened OS in a local environment first. Once the testing engineers confirm that the OS is free from performance and security issues, we deploy the servers in the production environment.
Risk management
The risks associated with our IT operations are mainly divided into three categories:
- Hardware failure risks
- Downtime risks
- Data security risks
These three categories involve our IT teams to a major extent, while other risks are handled by our Incident Management and SPA teams. The functioning of these teams is covered in detail in our books: Incident management handbook and A CIO's guide to rethinking compliance.
For the risks involving our IT teams, we use controls (measures against risks) so that we are in the best position to handle such risks.
|
Risk category |
Controls |
|
Hardware failure risks |
|
|
Downtime risks |
|
|
Data security risks |
|
3. Maintaining a stable ITOM environment
ITOM support
We offer 24/7 ITOM support by having technicians work in shifts. We have segmented issues and support tickets based on difficulty. We also have a set of guidelines on how to assign tickets to technicians based on their expertise and the difficulty of the issues at hand.
To support our ITOM engineers, our in-house knowledge management tool hosts a support library. The library consists of all ITOM-related documents, like:
- Solutions to various ITOM issues.
- Procedures for ITOM activities.
- The history of previous ITOM use cases and how they were solved.
- ITOM policies.
- ITOM process narratives.
Capacity planning
We use predictive analysis to procure servers in advance to maintain high availability. We also make future projections based on a schedule to avoid the risk of running out of servers. When we reach a threshold limit of available servers, the Zorro team purchases additional ones. It also maintains a percentage of servers in the free pool for the emergency requirements of any teams.
For components in the DCs, we gather and update information on cages, power, and other requirements using ZAC, our primary management tool. For network devices like switches and ports, we collect insights using our switch port management software to ensure device procurement matches the server procurement schedule.
Backup and maintenance
Both the Zorro and NOC teams make incremental backups on weekdays and full backups on Sundays.
The Zorro team uses ZAC to make automated backups of databases on our servers. These backups are stored on a central backup server with 256-bit AES encryption. This central backup server has the same redundancy mechanism as our main servers. We store these backups on the server for a specified period based on our backup policy. ZAC scans the backup process periodically to check if it is successful. If unsuccessful, the tool raises a ticket to be resolved by the Zorro team. It also runs various checks for the integrity of the backups based on a schedule.
To retrieve server backups, we use a separate Zoho Creator application that maintains backup requests.
The NOC team makes backups of network device configurations on a schedule similar to the one the Zorro team uses for incremental backups. The schedules and procedures for both teams are governed by our company-wide backup policy. The NOC team uses our network configuration management tool. In the event of a device failure, the backed up configuration is restored. Similar to how the Zorro team operates, the NOC team also receives a ticket when there is a backup failure.
To learn more about how we manage major changes, like changes to device configurations, check out our change management e-book. During such instances of major device configuration changes, we declare planned maintenance and execute them through our change management framework.
Disaster recovery
We follow a blueprint for disaster recovery, as discussed in our business continuity e-book. The Zorro team approaches disaster recovery in two ways:
- Internal redundancies
- External redundancies
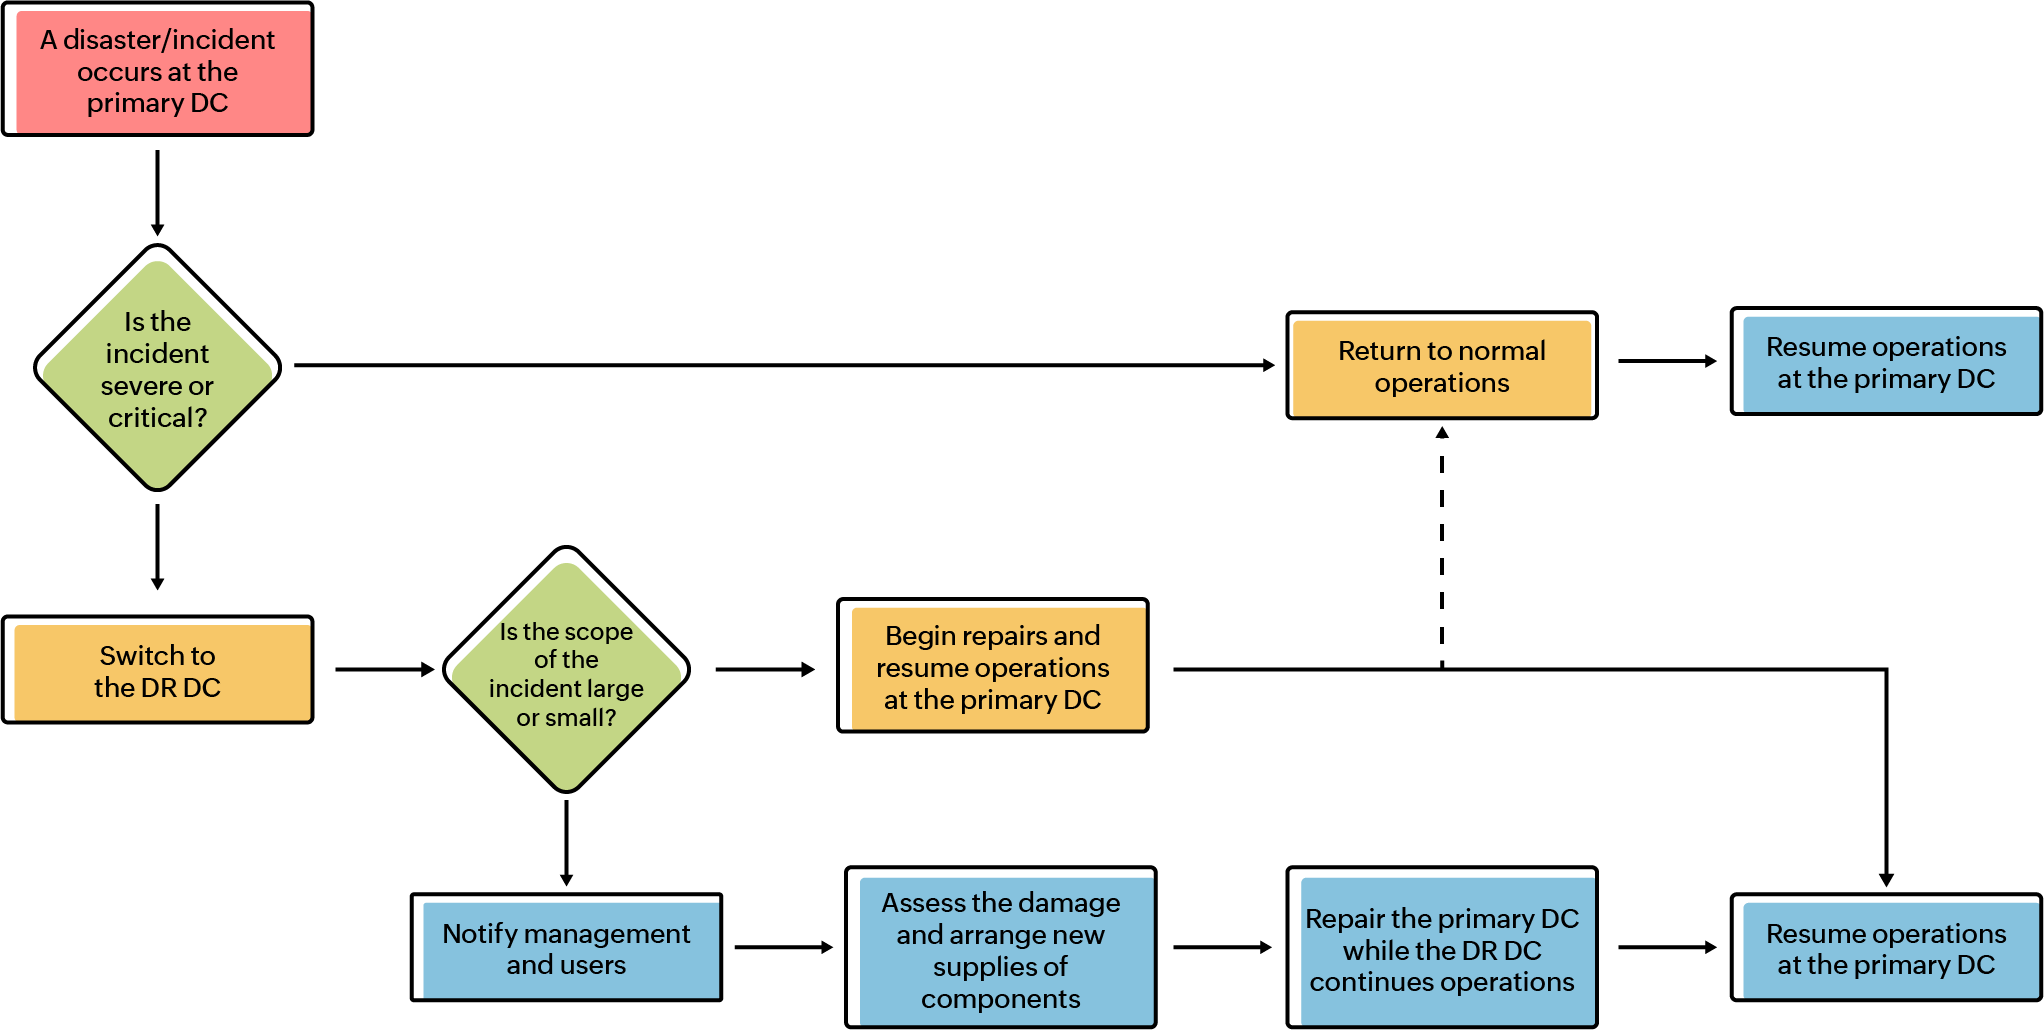
Internal redundancies are used for disaster recovery when components within a DC fail. For example, during server distribution, components are distributed across racks in such a way that the failure of one or more racks will not impact the overall functioning of the DC. Likewise, ZAC allows us to perform impact analysis and restore the service to its previous best state when there is a component failure across racks or clusters.
External redundancies are used when we have to restore the entire DC. The disaster recovery DC (DR DC) is a geographically separated replica of the main DC. When the main DC encounters failure, the DR DC takes over. Until such a situation arises, the DR DC functions in read-only mode. After the DR DC takes over, the write permission is enabled.

We test our business continuity and disaster recovery models every year.
Process improvement
We monitor the performance of our ITOM teams using two methods.
1) Ticket-based:
Tickets are divided into tiers based on their difficulty level. Each tier is given a standard resolution time. We keep track of SLAs to figure out which tier takes longer to resolve and improve the process to reduce the resolution time.
For example, here is how we measure performance during a particular period:
|
Tier |
Ticket type |
Standard resolution time |
Average time taken during the last quarter |
|
Tier 1 |
Resolvable via direct calls to engineers during their shifts |
1-2 hours |
1.5 hours |
|
Tier 3 |
Server provisioning, domain requests, new package installation requests, and more |
Up to 3 days |
2.8 days |
2) Solution-based:
We approach issues based on the type of solution provided, with a standard resolution time and various applicable solutions for each category. We always work towards reducing the resolution time by implementing each solution faster.
Here is an example of that approach:
|
Ticket type |
Solution provided |
Average time taken during the last quarter |
|
ISP-related |
Switch ISPs |
< 5 minutes |
|
LAN outage |
Switch to the DR DC |
< 30 minutes |