OpManager monitors Cisco UCS System using XML SOAP protocol. Cisco's Unified Computing System integrates computing, networking, virtualization and other datacenter components for cost effective and efficient datacenter management.
With OpManager's Cisco monitoring, you can do the following,UCS discovery in OpManager is similar to the discovery of other devices.
Once the device is discovered, it is listed under OpManager's inventory.
OpManager's cisco monitoring feature helps you monitor the status and availability of UCS devices. Detailed information like UCS components, their relationship charts, Chassis information etc., is also monitored by OpManager.
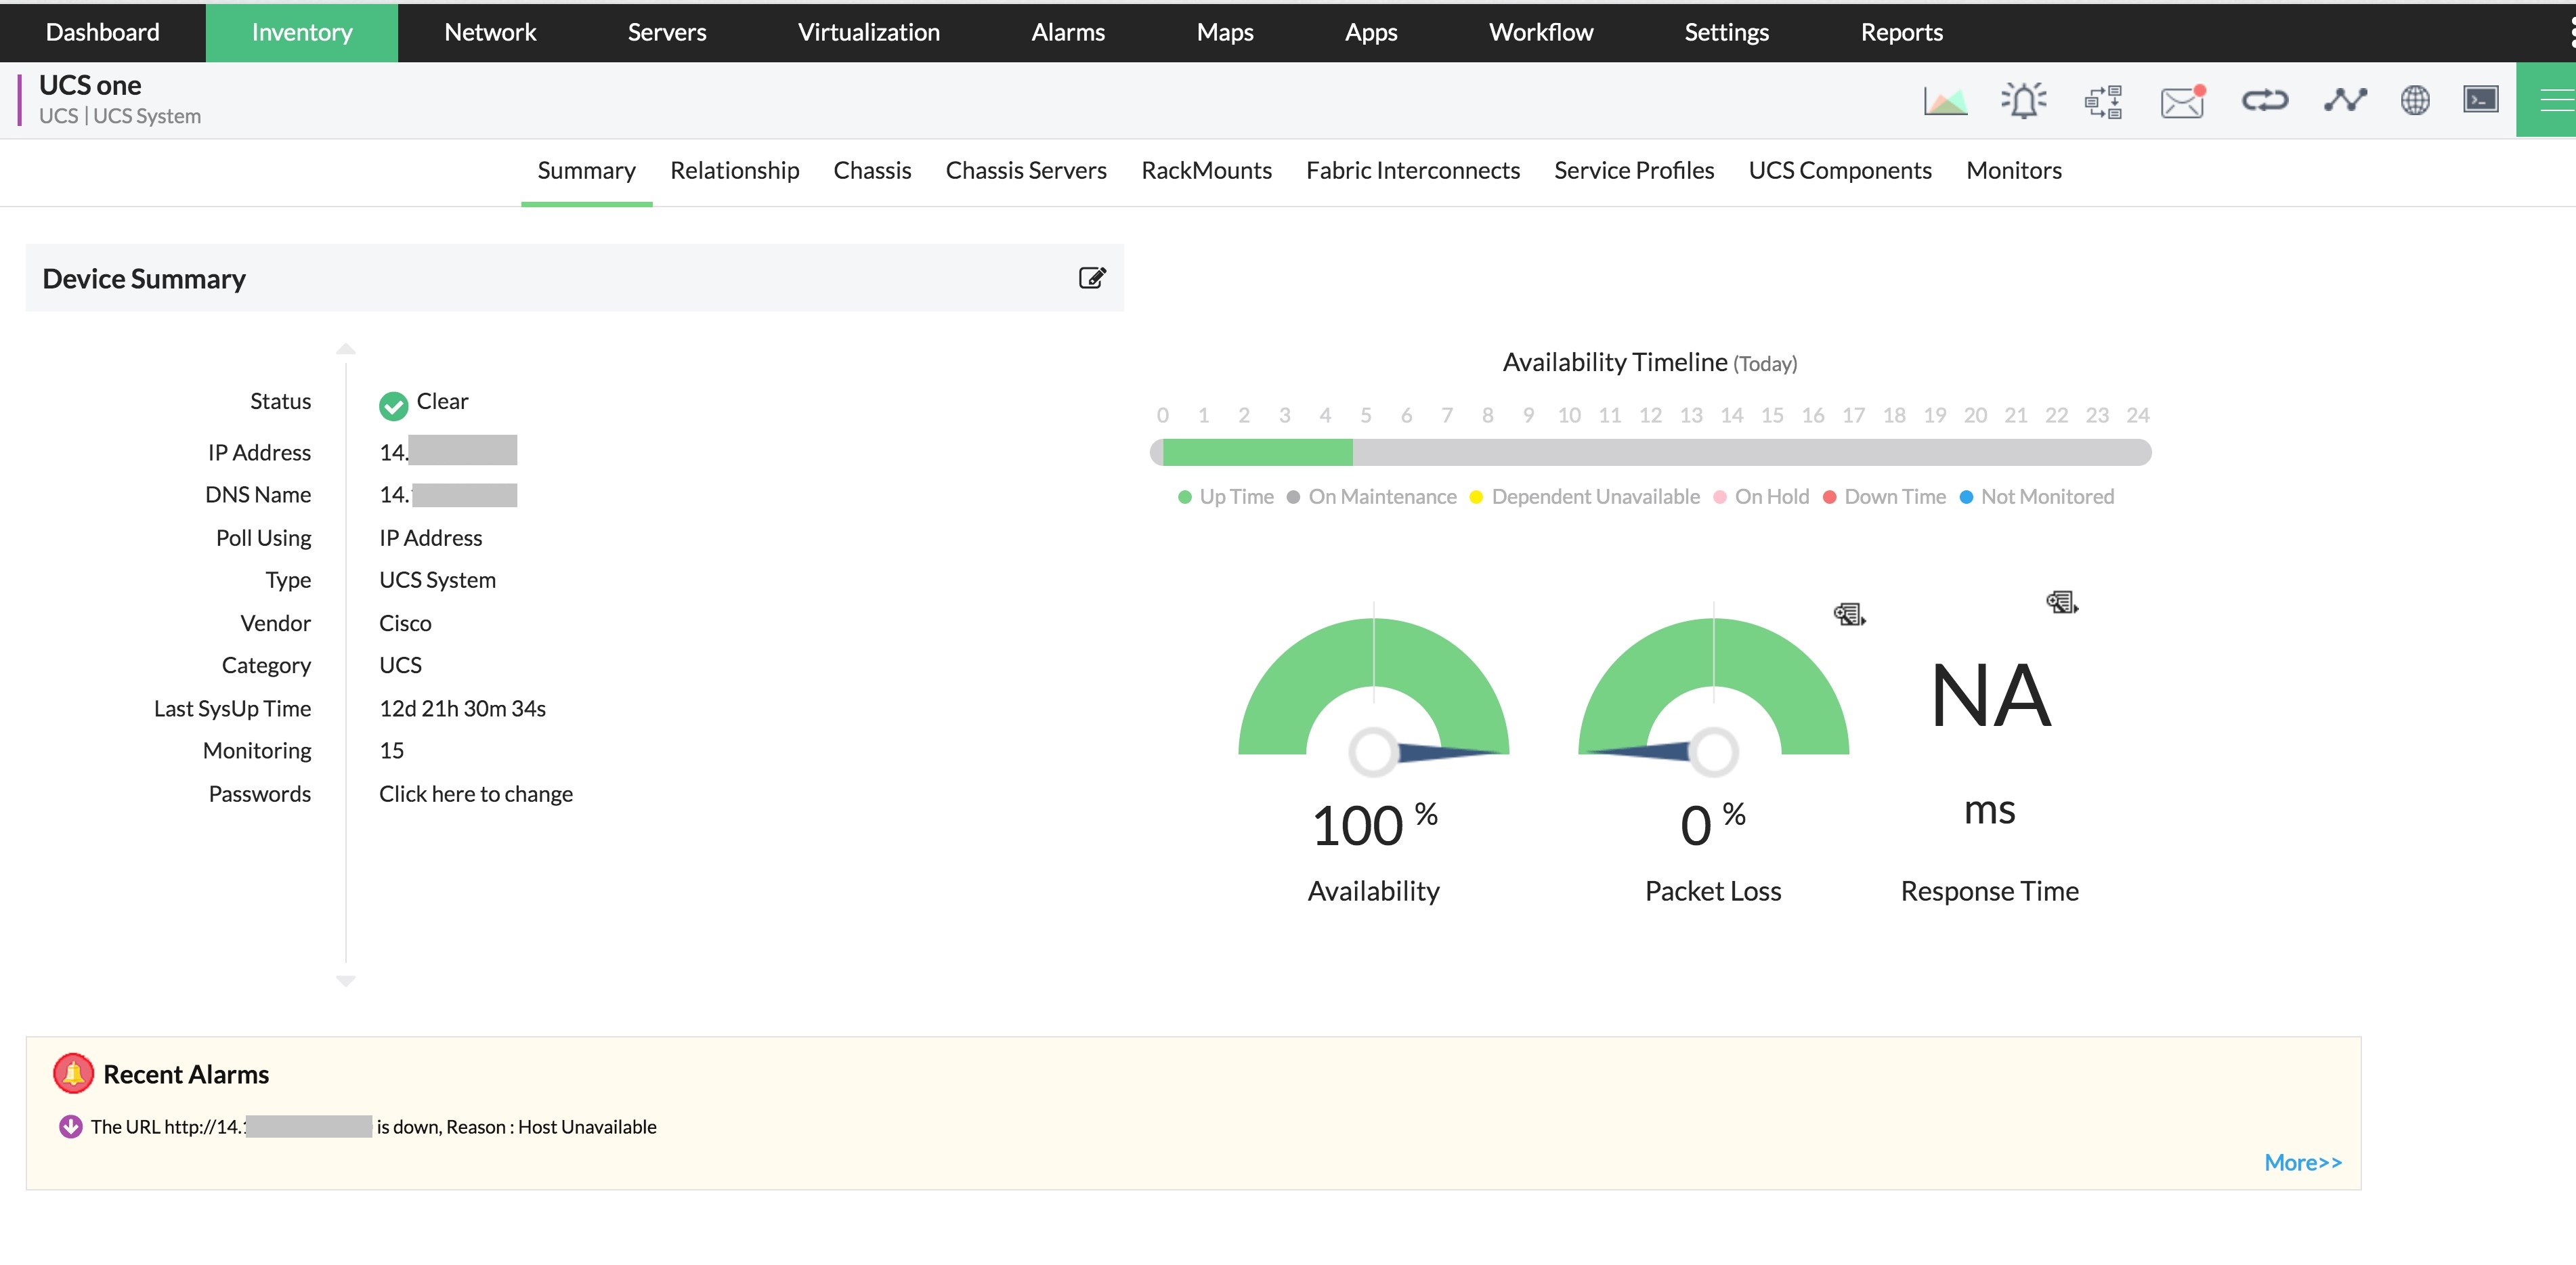
The Snapshot page (Navigate to Inventory and click on a device to open the device snapshot page.)provides details like IP Address, Monitoring Intervals, Passwords, Status and Response Times of the Device.

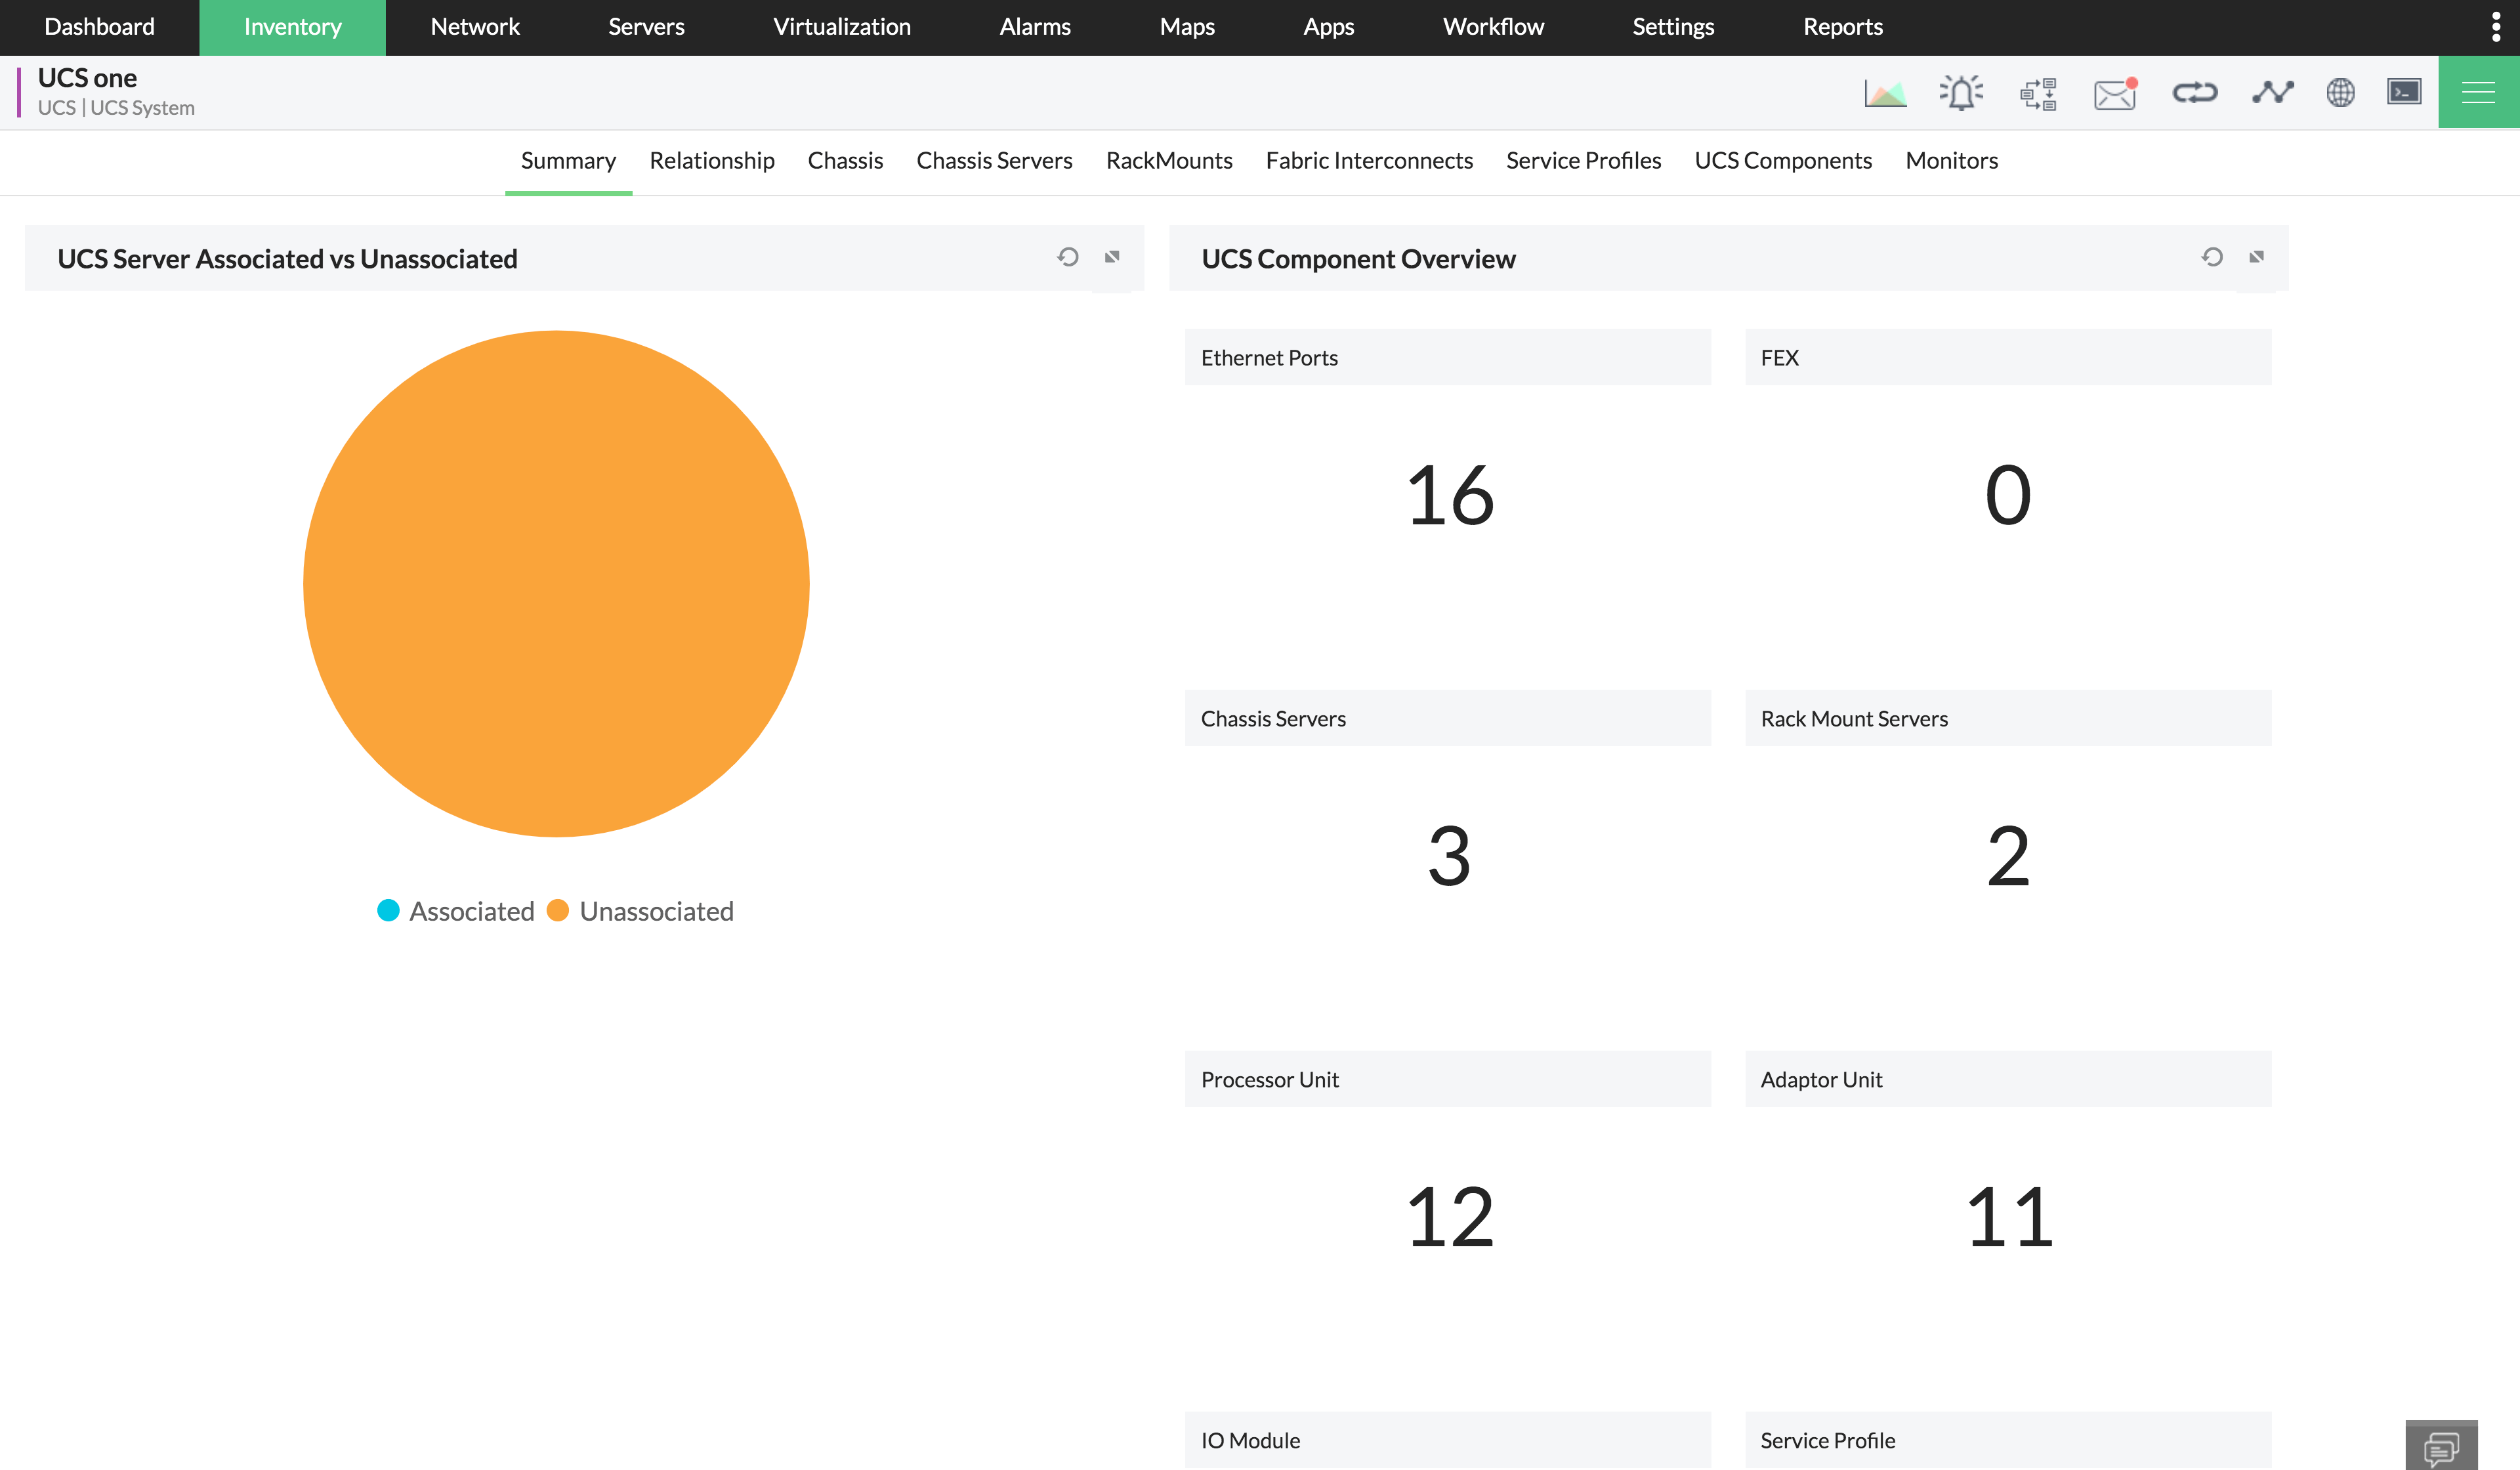
OpManager also provides the status of service profiles associated with UCS servers and an overview of UCS components that includes Chassis, Chassis servers, rack mount servers, FEX, ethernet ports etc. These can be viewed in the UCS Snapshot page.

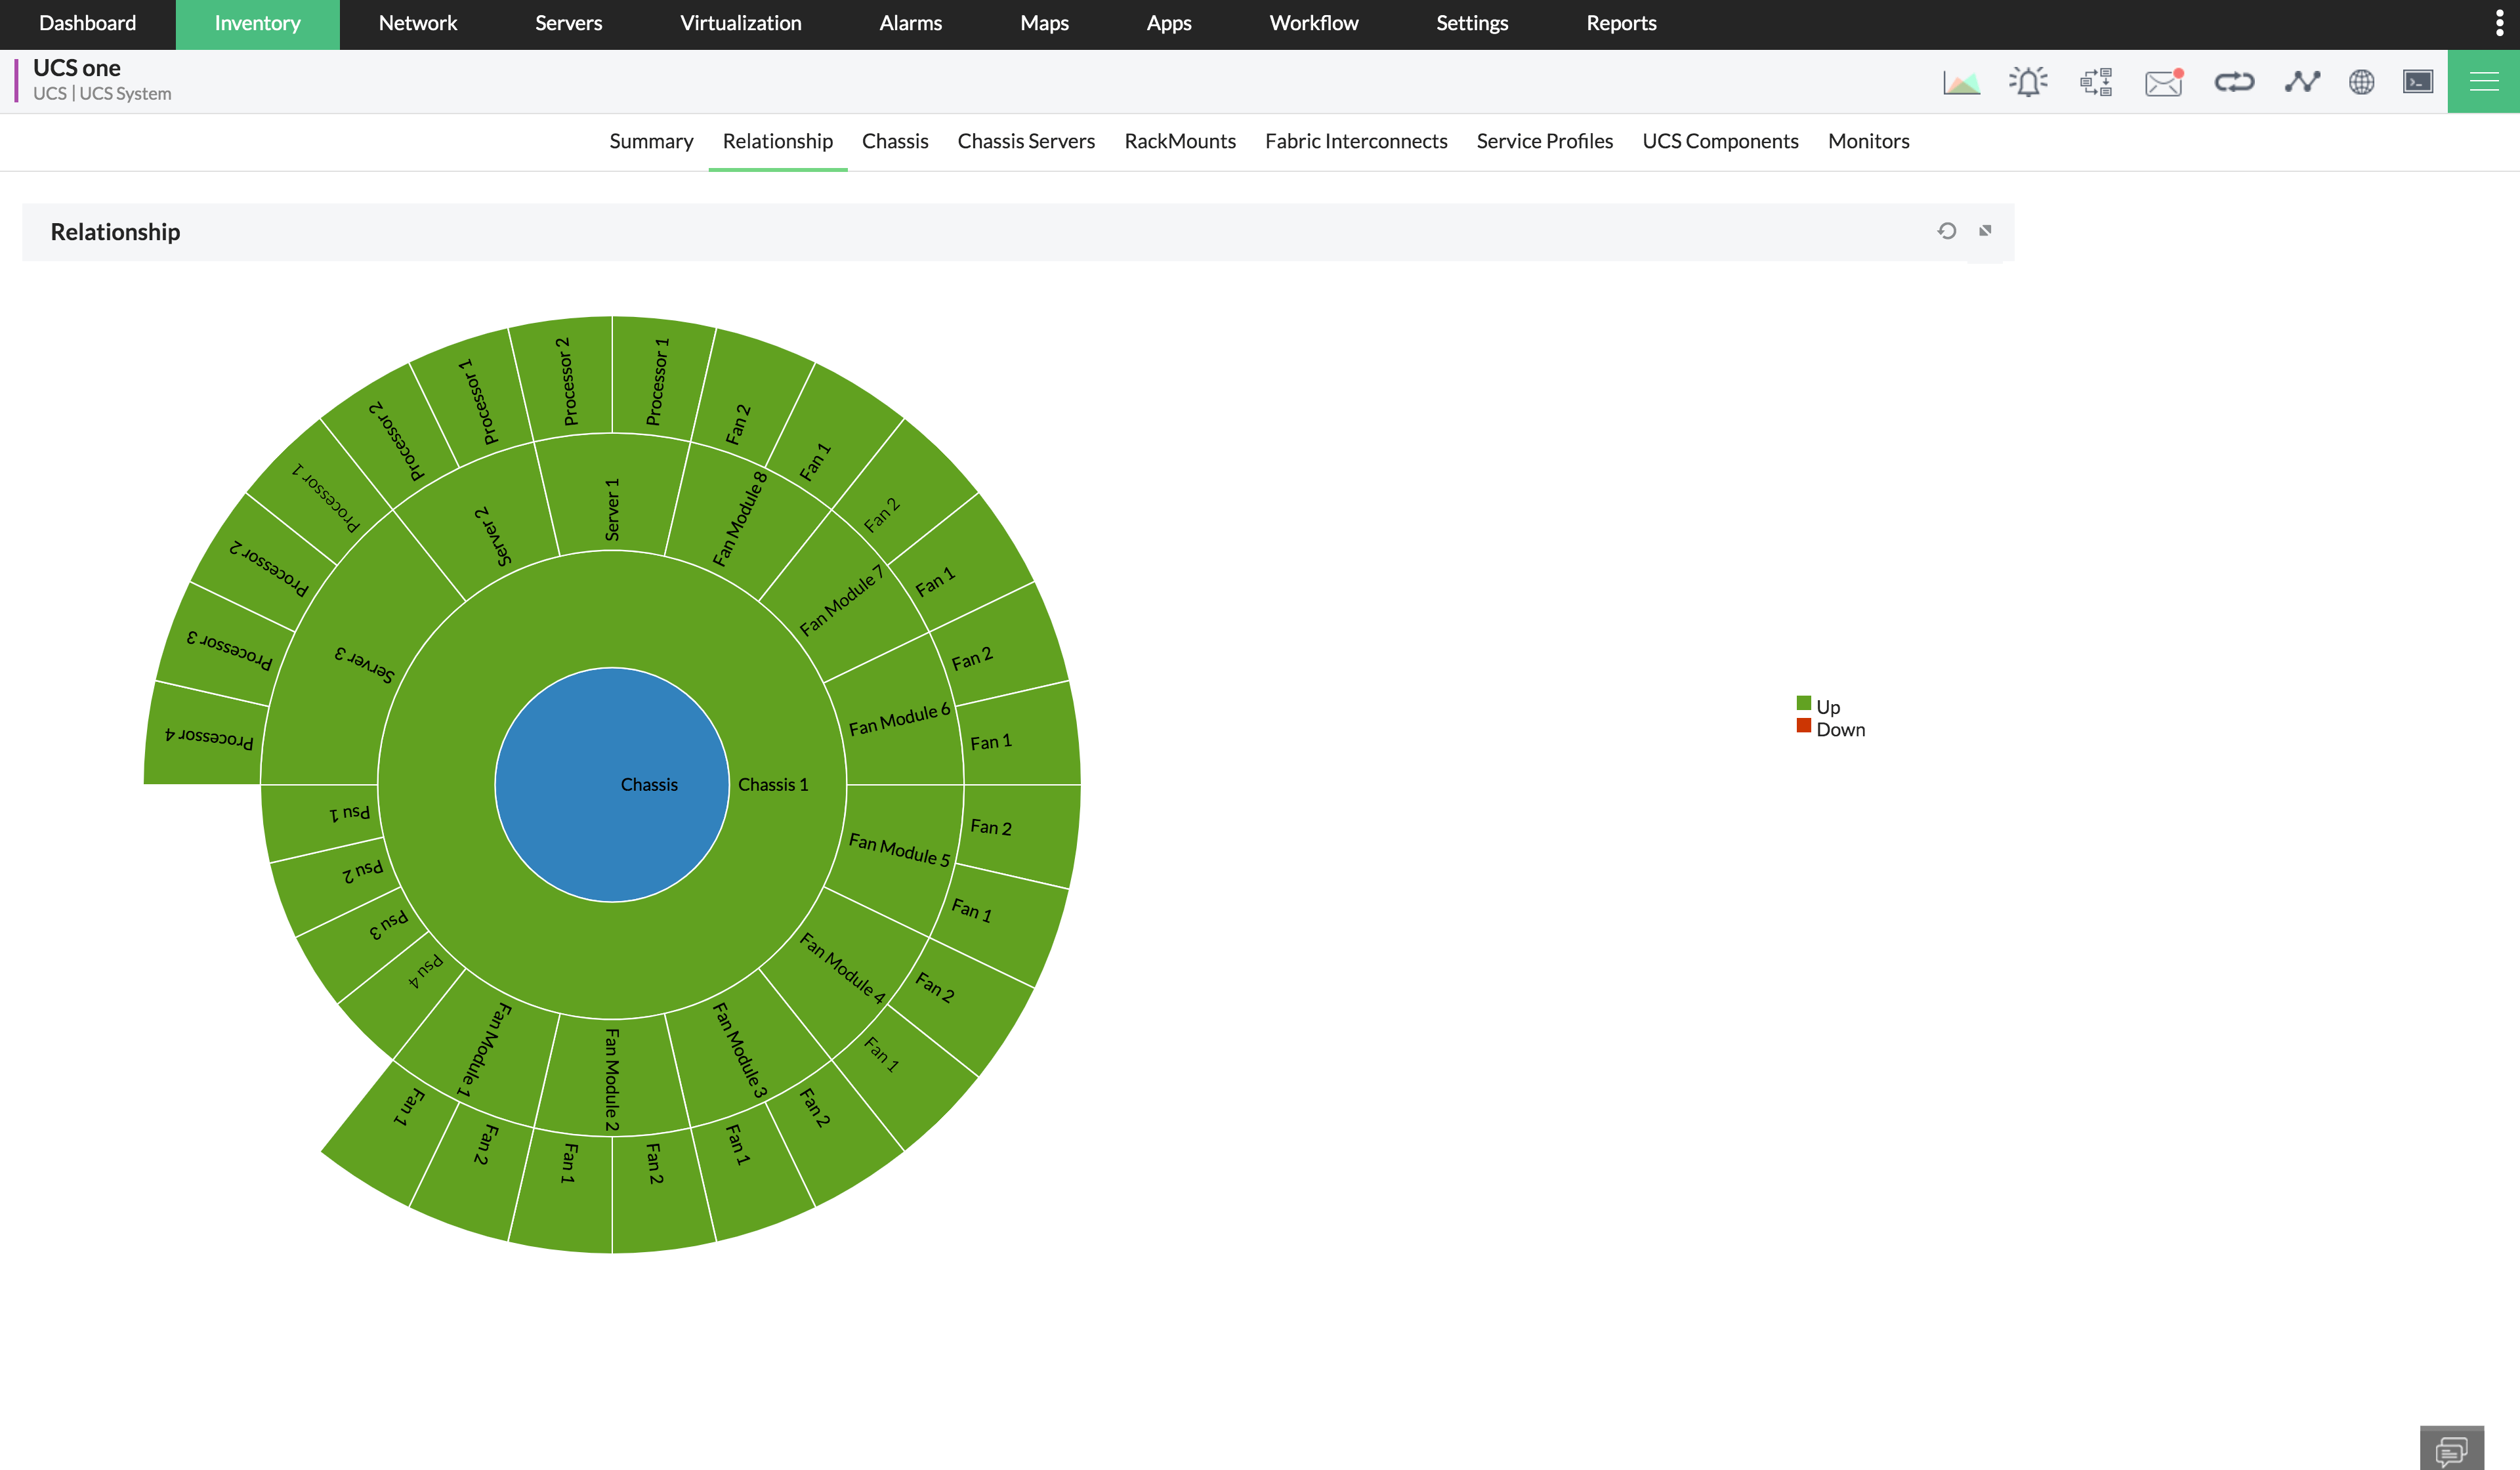
OpManager provides a graphical representation of Chassis components that includes Servers, Fan Modules, Power Supply Units, IO Modules etc. This can also be viewed under the snapshot page of the UCS device in OpManager.

Apart from this, OpManager also provides information on the number of chassis, and detailed data on the chassis servers like cores, memory, NICs, operability, Power and association State.
You can configure events from the Cisco UCS device to be raised as alerts in OpManager from the Fault Settings window. This option is available in the hamburger menu of the UCS Device Snapshot page.
Once it is enabled, users can choose one of the two methods available to collect events from the device:
Rack mounts are frames where the servers are enclosed. Several servers can be mounted on the rack as per requirement.
OpManager monitors
These are a part of UCS devices that acts as a switch, and helps in connecting servers to networks or storage networks.
OpManager monitors
OpManager also monitors and provides detailed information on the other UCS device components such as,
Thank you for your feedback!