Integrating OpManager with Log 360 - EventLog Analyzer
ManageEngine Log 360 - EventLog analyzer is an Security Information and Event Management (SIEM) solution that helps you enhance your network security and comply with government-mandated and organization-level regulations, by collecting and analyzing your network logs. By integrating OpManager with Log 360 - EventLog analyzer, users can forward their critical logs to Log 360 - EventLog analyzer, and analyze them to gain deeper insights into user behavior, and identify anomalies and potential threats.
NOTE: OpManager versions 127312 and above is compatible with EventLog Analyzer versions 12335 and above.
Configuring Log 360 - EventLog Analyzer details in OpManager
To integrate OpManager with Log 360 - EventLog analyzer, kindly follow the below steps:
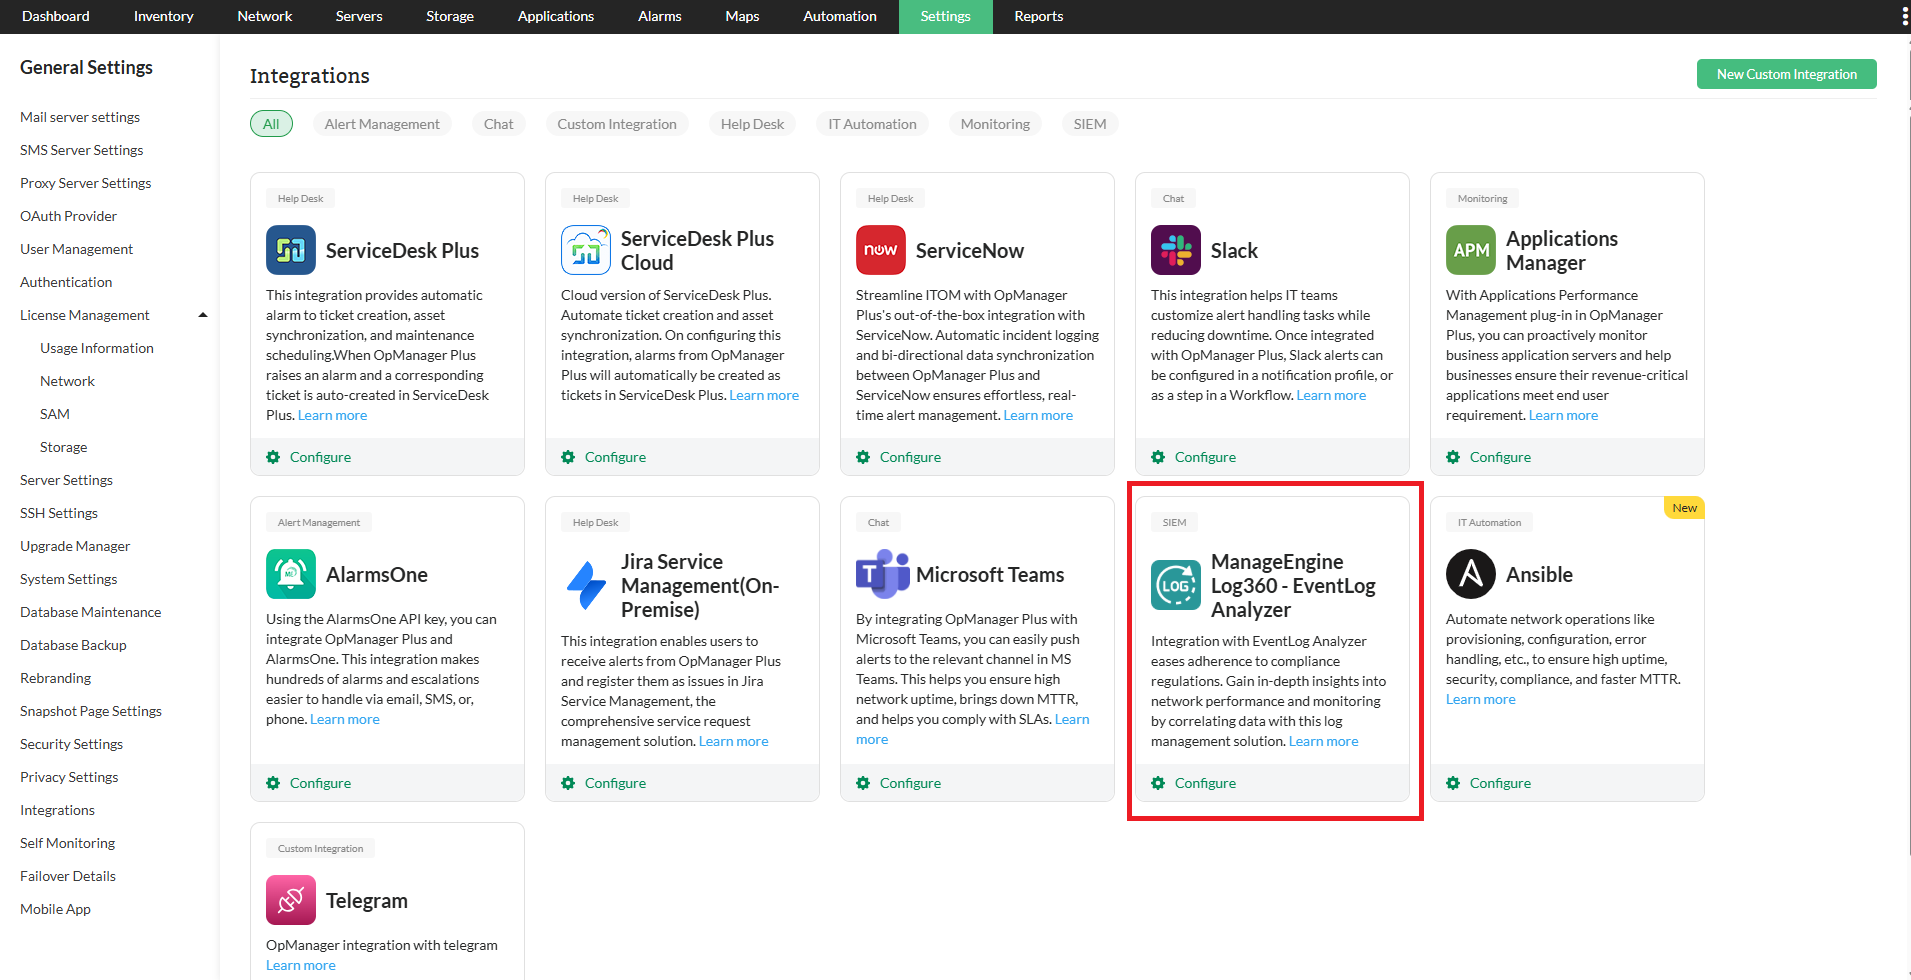
- Go to Settings -> General Settings -> Third Party Integrations.
- Now, click on the "Configure" button found at the bottom-right corner of the Log 360 - EventLog analyzer Section.
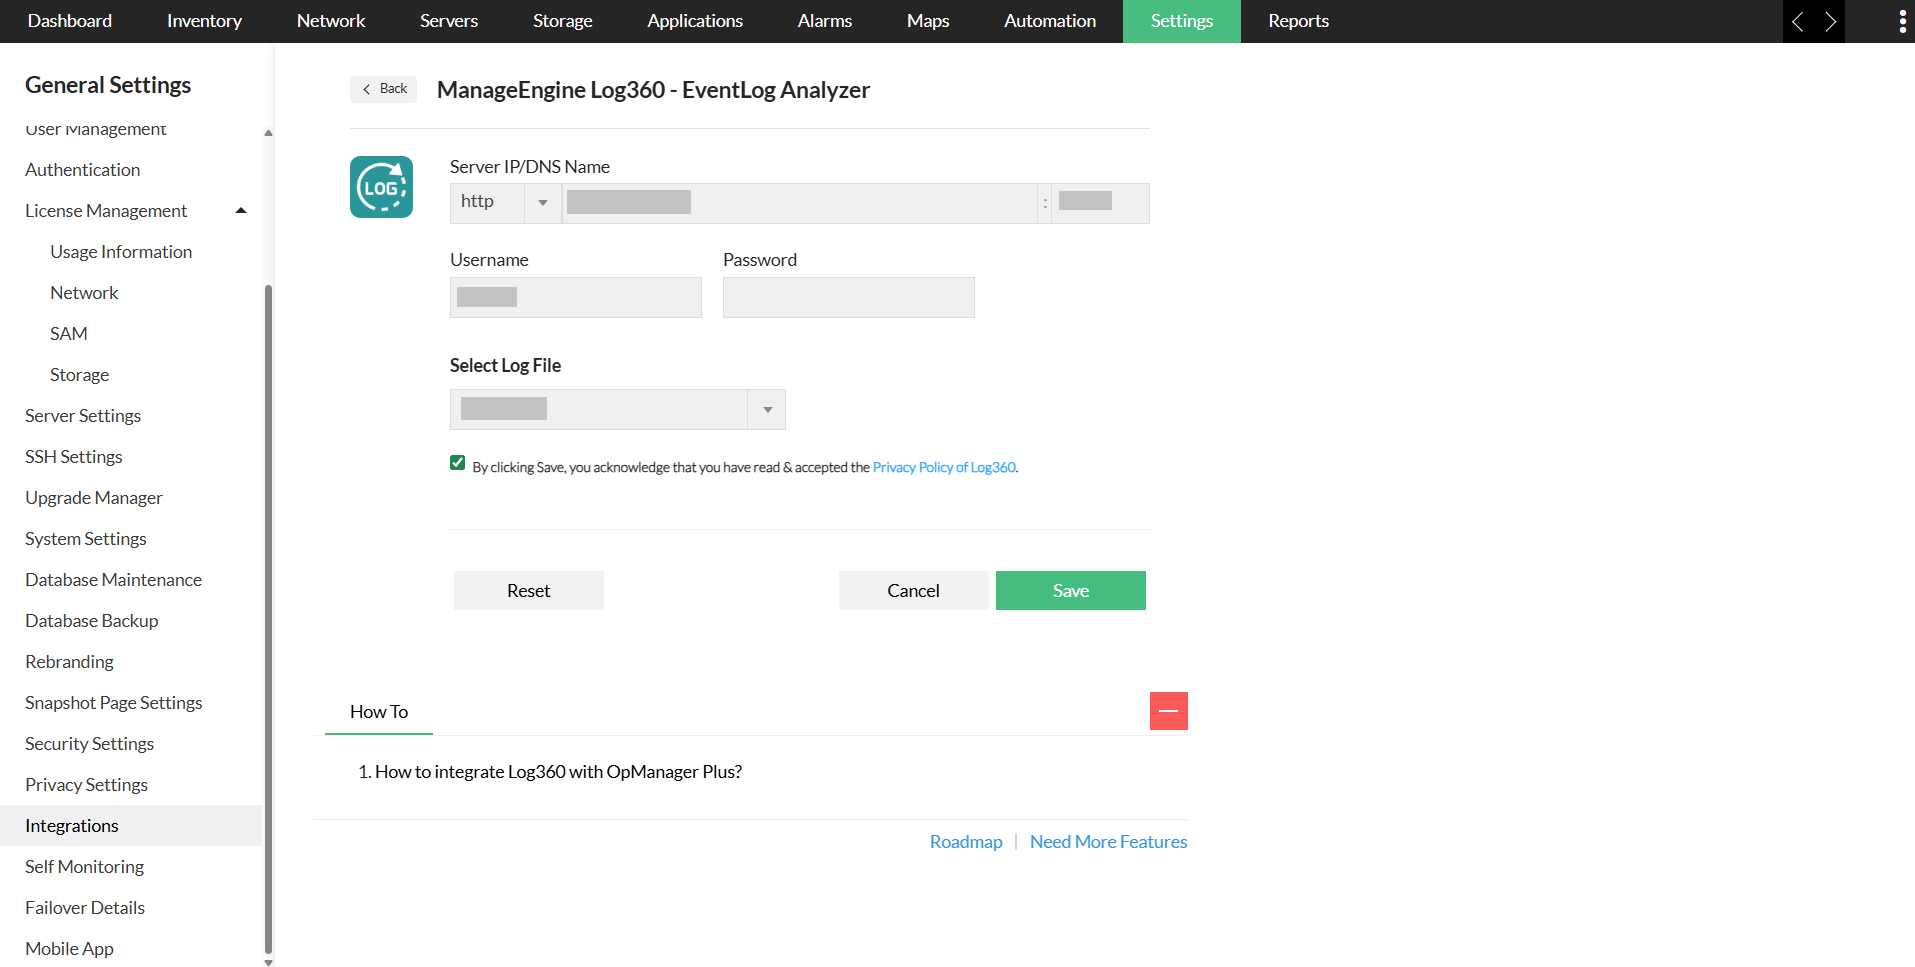
- Now, fill in the following details:
- Server IP/DNS Name: Enter the IP address or the DNS name of the EventLog Analyzer-installed server, along with the port and the protocol.
- Username: Enter the user name of the EventLog Analyzer user with the admin privilege.
- Password: Enter the password of the EventLog Analyzer user with the admin privilege.
- Select Log File: Select the logs to be forwarded to EventLog Analyzer, from the Select Log File drop down box.
- Access logs: Logs that contain requests made to a web server, capturing information like the IP address, timestamp, requested resources, and outcomes of each request
- Debug logs: Logs that are generated by OpManager during its operation, containing information used for diagnosing and troubleshooting issues.
How does the OpManager - Log 360 EventLog Analyzer integration help network admins?
By integrating OpManager with Log 360 - EventLog Analyzer, network admins can leverage the following functionalities.
Staying compliant with various regulations and frameworks
Centralized log management and analysis is a crucial mandate for most of the compliance regulations such as HIPAA, PCI-DSS, and so on. By centralizing and analyzing OpManager's debug and access logs, network admins can comply with the above said regulations.
Enhanced security
Since the debug and access logs are forwarded to Log 360 - EventLog Analyzer for analysis, network admins can know who accessed what in OpManager. Furthermore, network admins can also correlate access logs with debug logs, helping them troubleshoot network issues, fortify network security against potential unauthorized activities, and conducting extensive root cause analysis.
What are the various reports that network admins can generate using this integration
Once OpManager is integrated with Log 360 - EventLog analyzer, users' debug and access logs will automatically be forwarded to the EventLog Analyzer Server via Syslogs. The logs can then be visualized in the form of the following reports:
NOTE: ELA uses both UDP and TCP ports to receive syslogs. The ports used by default are UDP 514, UDP 513, TCP 514, and TCP 513. Users can also change these ports
Product Activity Report
The product activity report category contains the All Activity report, which generates reports for all the logs forwarded from OpManager server.
Debug Reports
The following debug reports can be generated from the serverout & stdout(debug) logs of the OpManager.
- Instance Created: Obtain a detailed report that outlines the product's startup instance with the necessary configurations, within the chosen time period.
- Services Created: Generate a comprehensive report listing the services that were created during OpManager startup within the specified time frame. For example, services like StartupControllerService, PatchUpdaterService, CacheService, and others, were initiated during this process.
- Server Started: Obtain a comprehensive report detailing when the OpManager server was started within the selected time period.
- Successful Logins: Access a detailed report showcasing successful OpManager logins, including the respective login times, all within the chosen time frame.
- Failed Logins: Receive a comprehensive report detailing unsuccessful OpManager login attempts, complete with the corresponding login times that occurred within the selected time interval.
Web Access Reports
Web access reports generated from OpManager's access logs encompasses a range of HTTP status codes, such as Status Success, Internal Server Error, Gateway Timeout, etc., each reflecting distinct outcomes of client-server interactions.
This is how users can successfully integrate OpManager with Log 360 - EventLog Analyzer, and enhance their network security by analyzing their logs.
Thank you for your feedback!