MSSQL monitoring in OpManager
MSSQL Services and Parameters can be monitored using WMI. OpManager detects the SQL servers by itself and MSSQL related resource metrics are added automatically.
Configuring monitors for MSSQL services
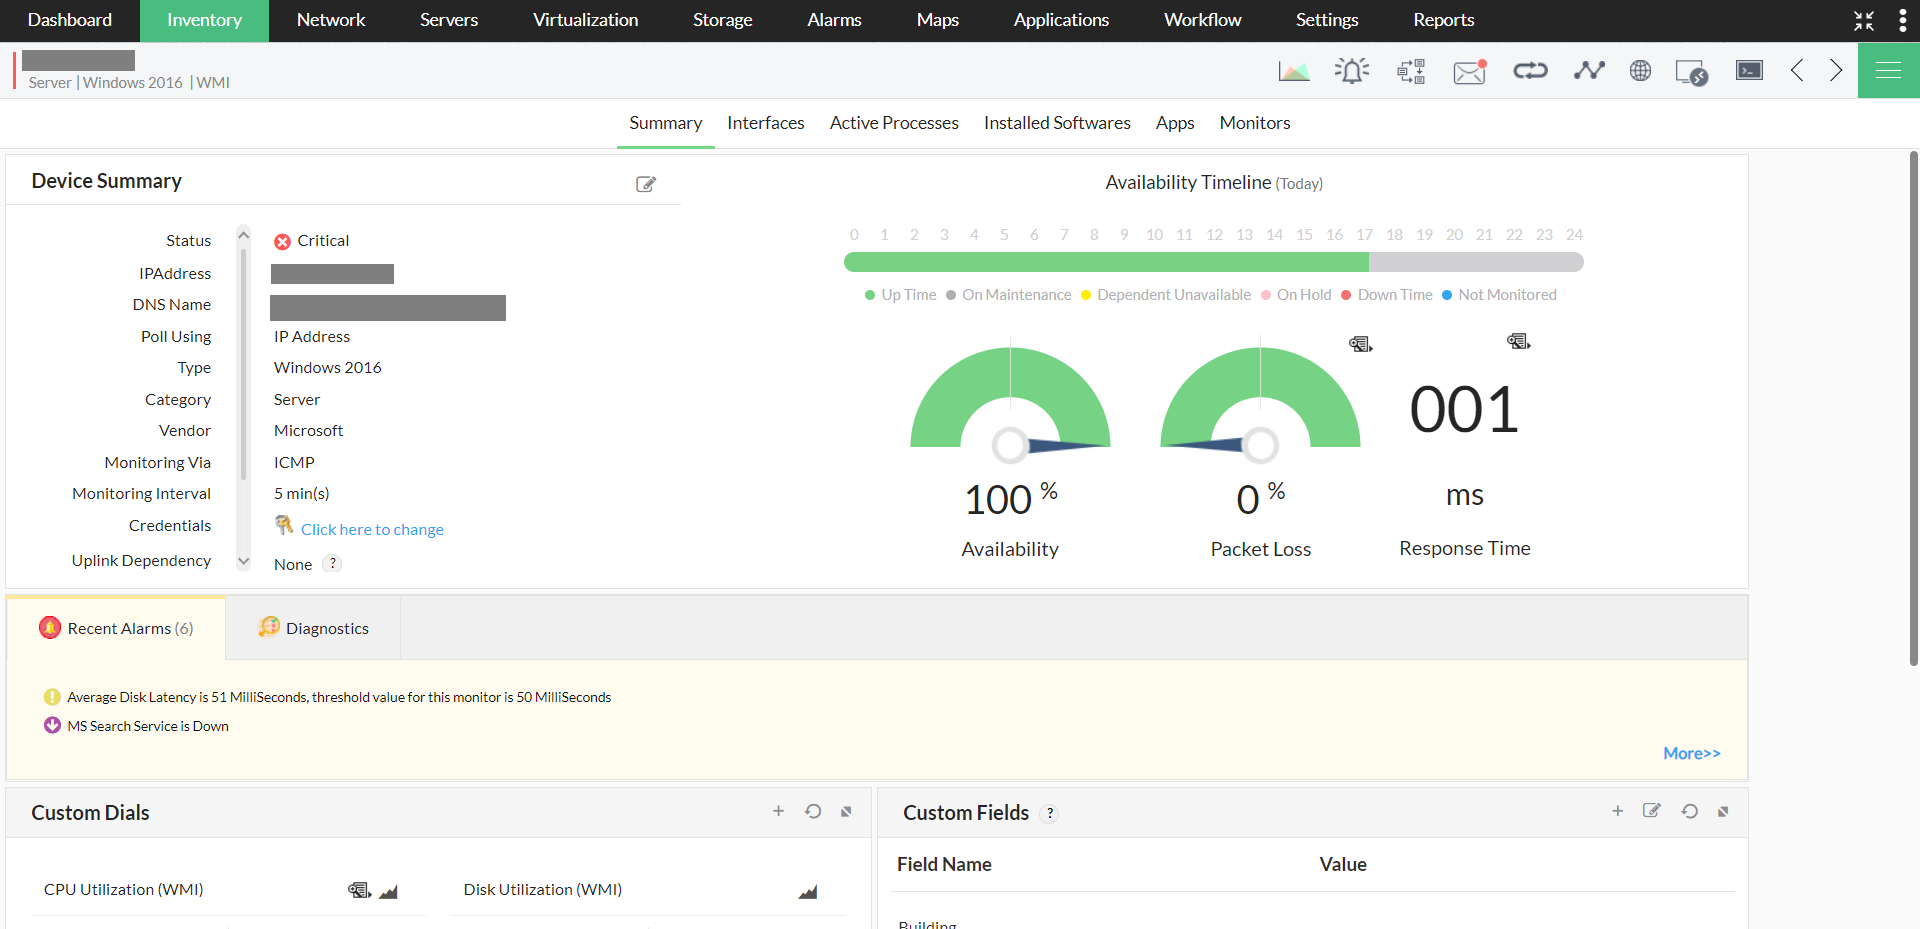
- Open the "Device snapshot" page by navigating to "Inventory -> Devices" and then clicking on a device.

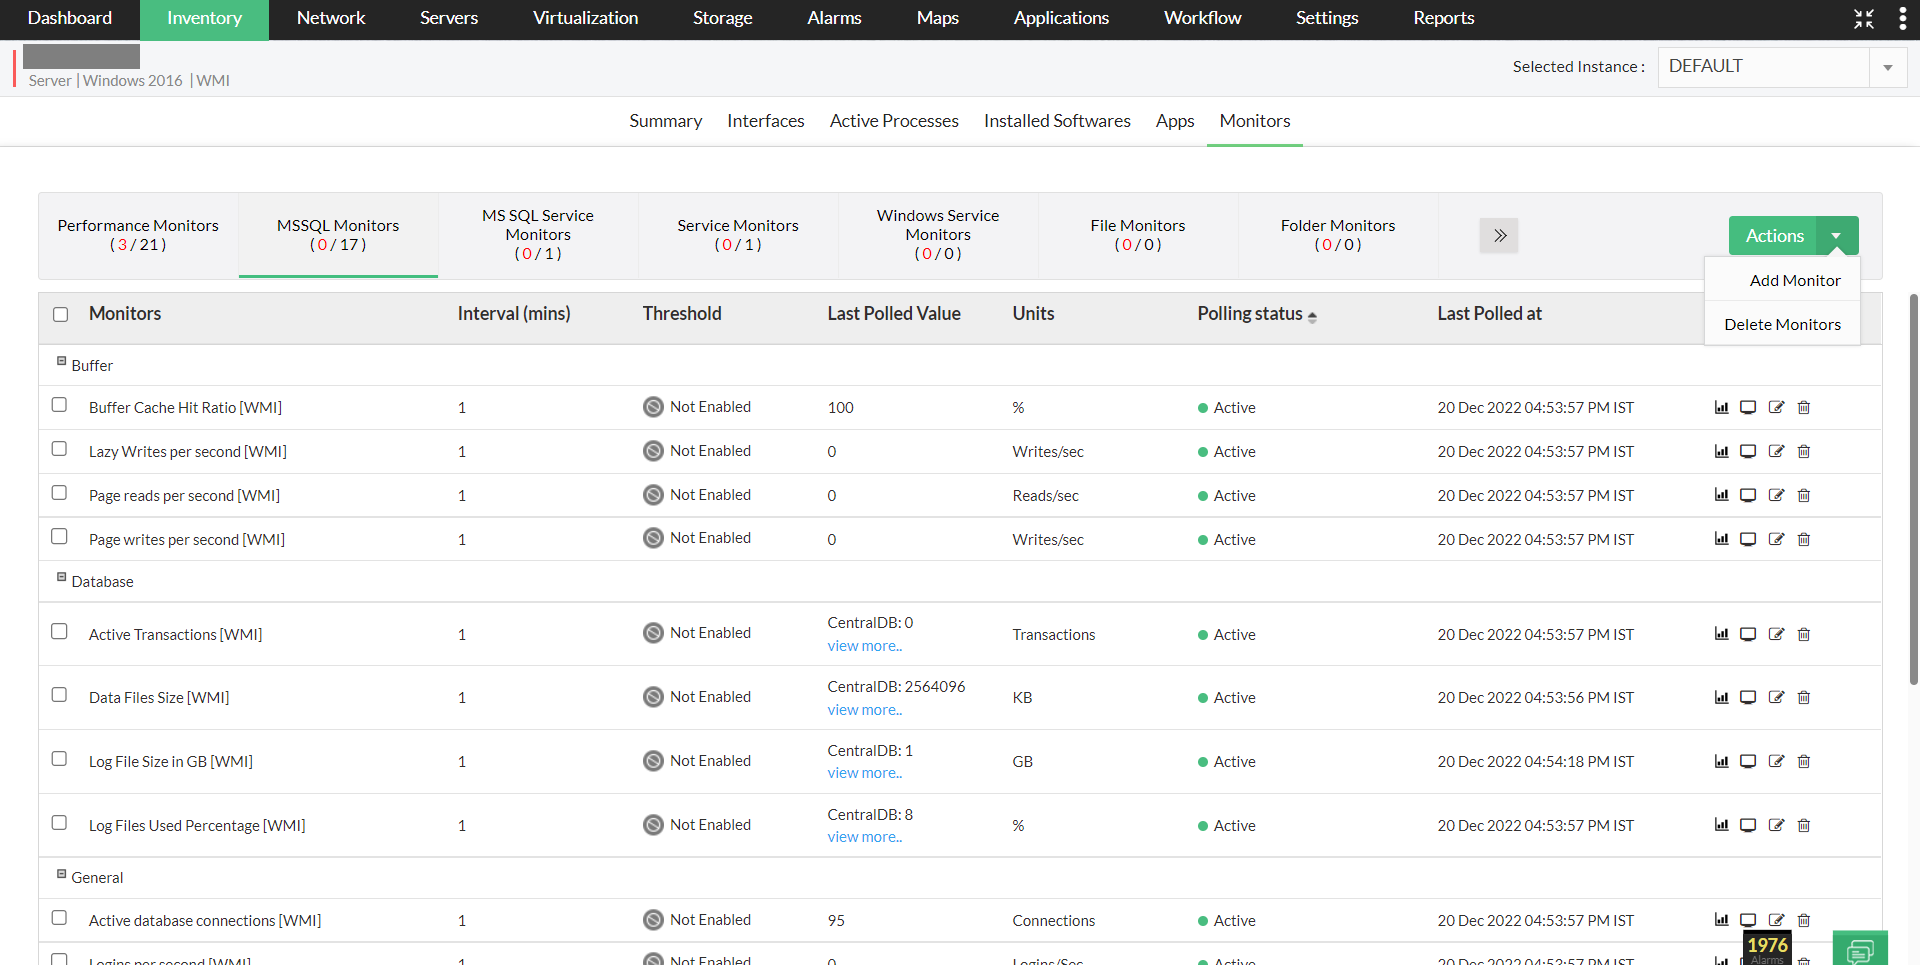
- Head to the "Monitors" tab and under the "MSSQL Monitors", select the instance at the drop-down box in the top right corner.
- A list of all MSSQL monitors, available for that instance will now be listed down.
- Now, click on the "Actions" button at the top-right corner of the page, and then select "Add Monitor".

- Now, select the service and the relevant monitors.
- Click on the "Save" button at the bottom.

- Now, select the databases to which the changes must be carried out, and click on "Save".
The monitors are now successfully associated to the device. Ensure that you have used the right credentials for the device association, since OpManager uses the credentials to communicate with devices.
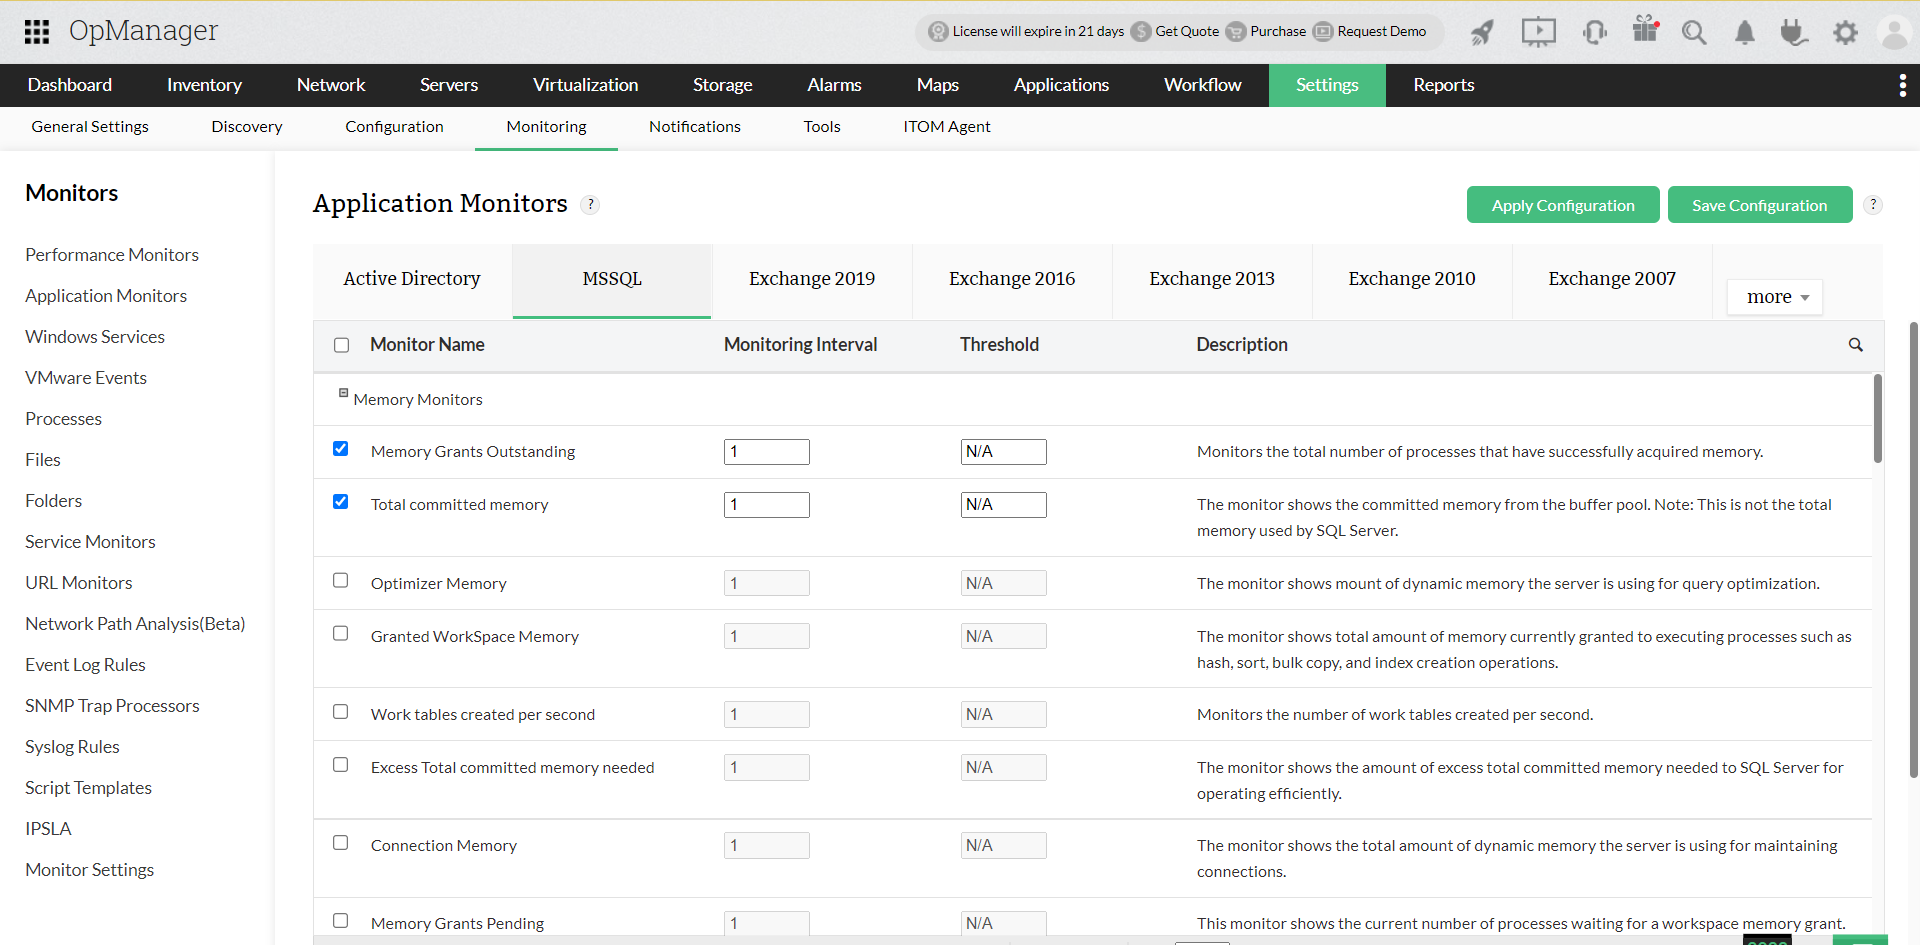
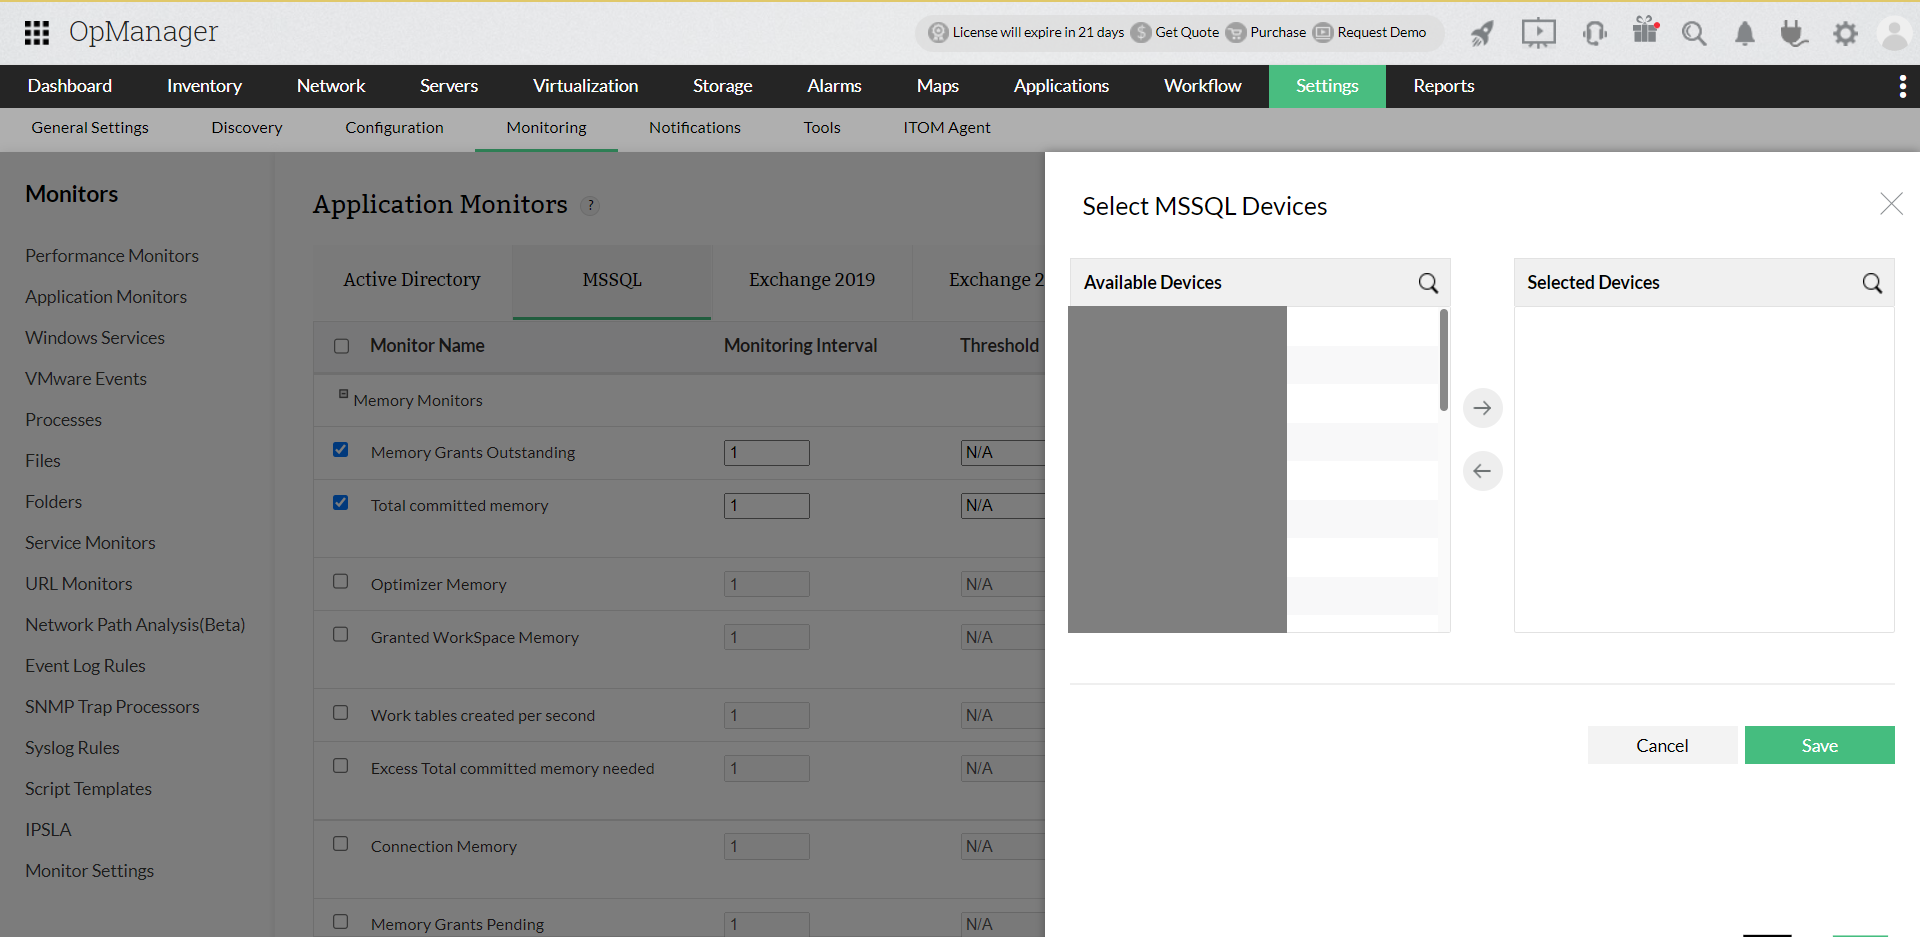
- To associate monitors to multiple devices at a time, navigate to "Settings -> Monitoring -> Application Monitors".
- Under the "MSSQL", select the monitors you want to associate. You can even modify the monitoring interval and thresholds under the respective columns.
- Once the monitors are selected, click on "Apply Configuration" at the top right corner. Clicking on "Save Configuration" will save the configuration changes, but won't apply it to the devices.

- Select the devices you want to associate from the "Available Devices" section and then move them to the "Selected Devices" section.
- Click on "Save".
Proactively monitor your MSSQL services by setting suitable thresholds
You can monitor the MSSQL services in your network by configuring thresholds. In case of threshold violation, alerts will be generated. By configuring relevant notification profiles and associating them with the respective devices, alerts will be sent out to the corresponding person at the earliest. Furthermore, users can also automate the discovery process by using the discovery rule engine feature.
Visualize your MSSQL monitoring efforts
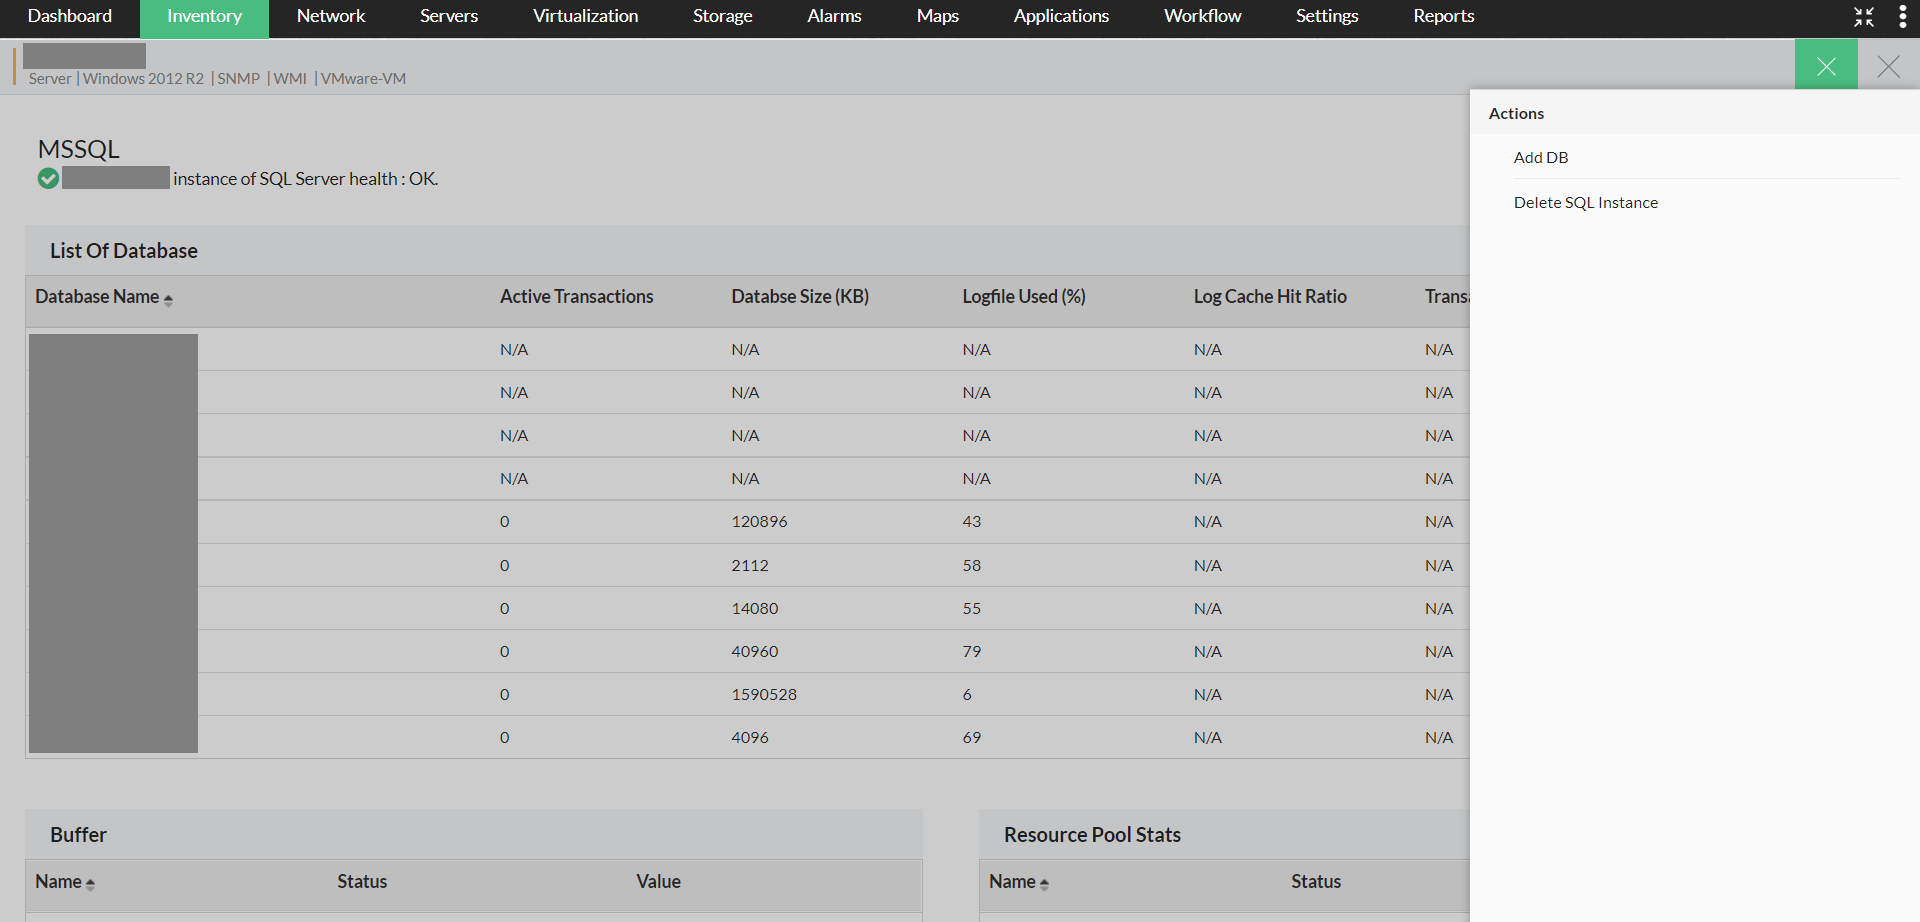
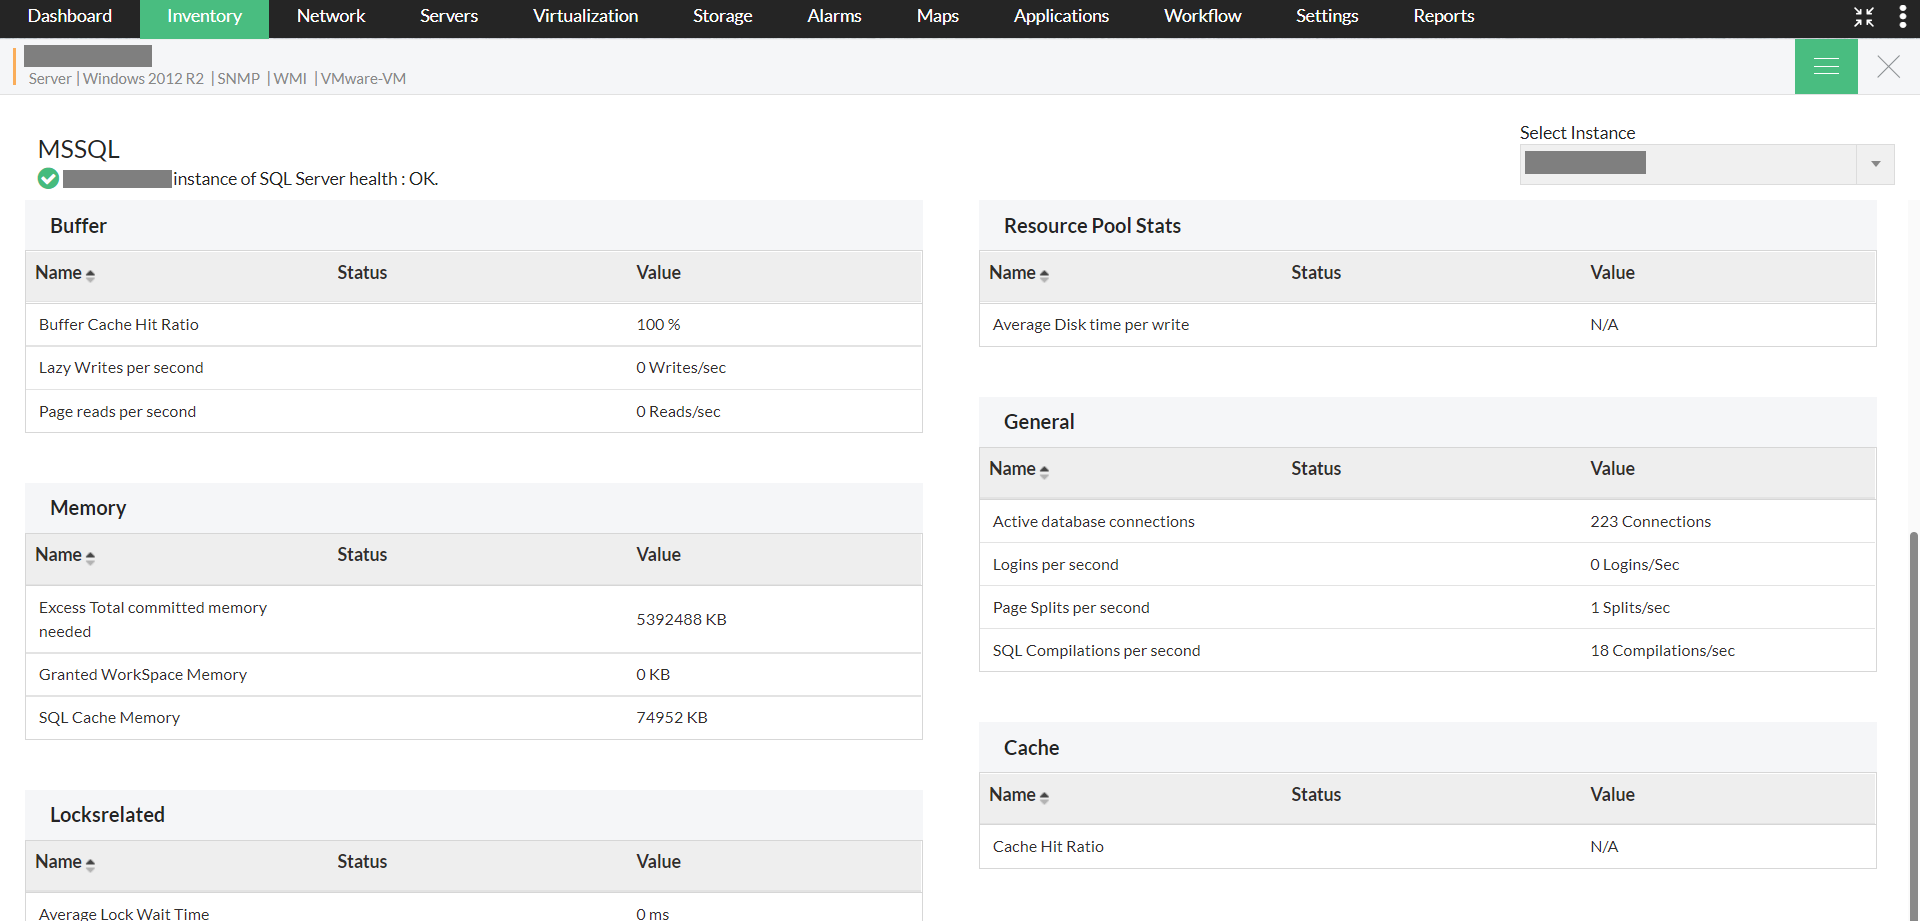
In the device snapshot page, click on the more icon found at the top-right corner of the page. Now, select "MSSQL" to view your MSSQL monitoring dashboard. By selecting a specific instance, users can view all the monitors listed, along with their buffer and resource pool stats. Furthermore, users also have the option to add and delete databases from MSSQL dashboards by clicking on the menu option at the top right corner of the page.


Thank you for your feedback!
