Cloud SIEM solution for managed security service providers
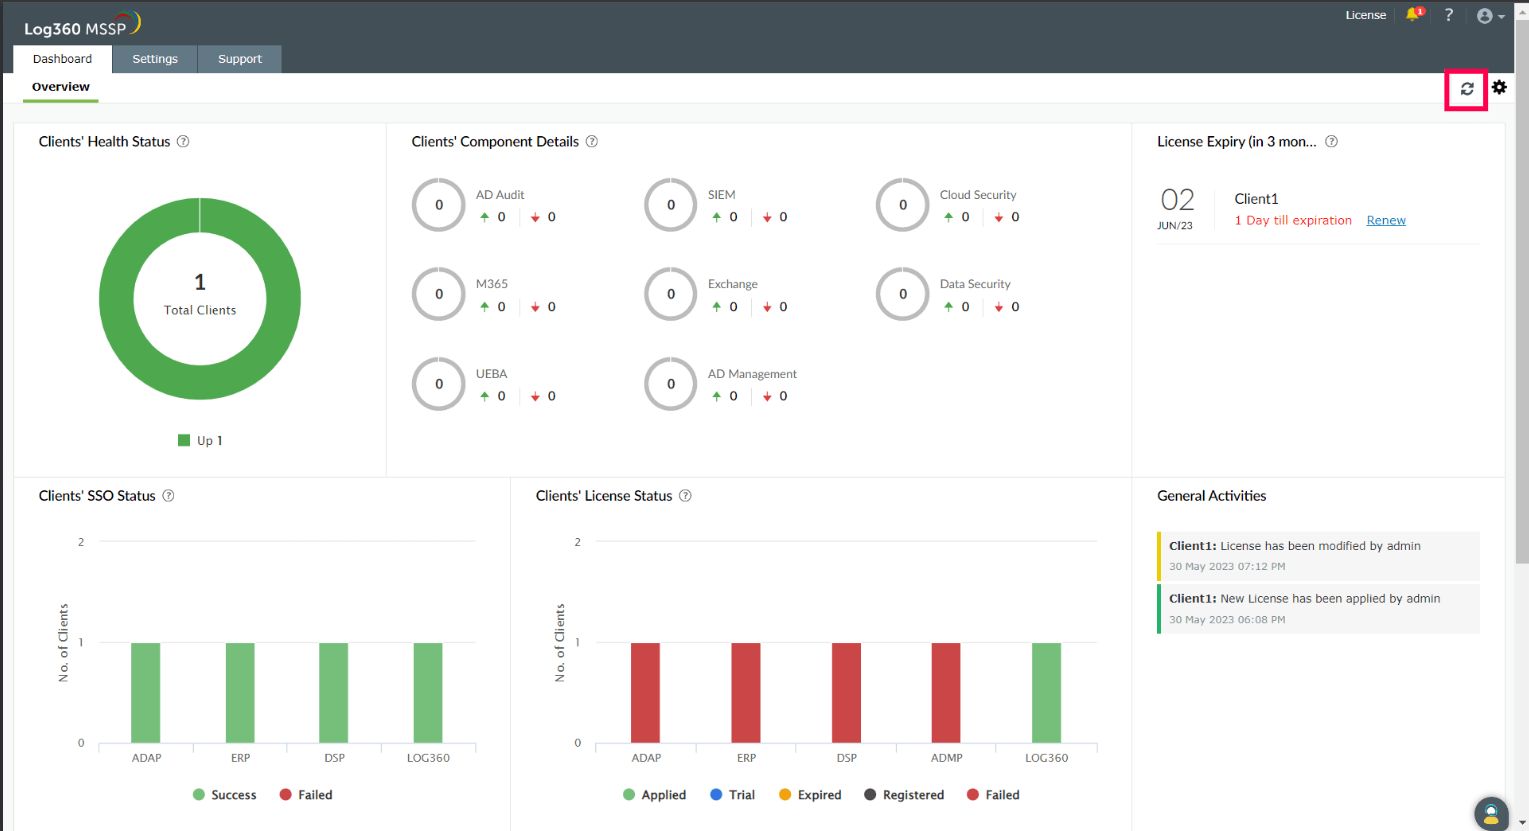
Sign upThe Log360 MSSP dashboard provides a quick overview of the integrated clients' health status, clients' integrated child components health status, license details and license status of clients, and SSO status of technicians in the form of charts. Here are some tips to help you resolve your dashboard issues.
Important: To view the dashboard with widgets you have to ensure that one or more clients are integrated with Log360 MSSP.
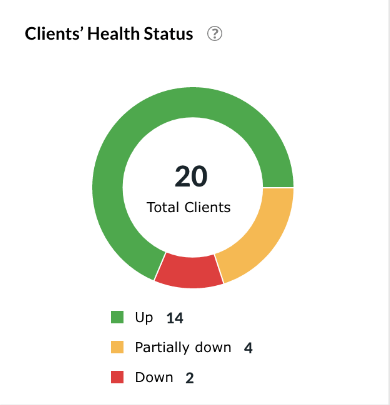
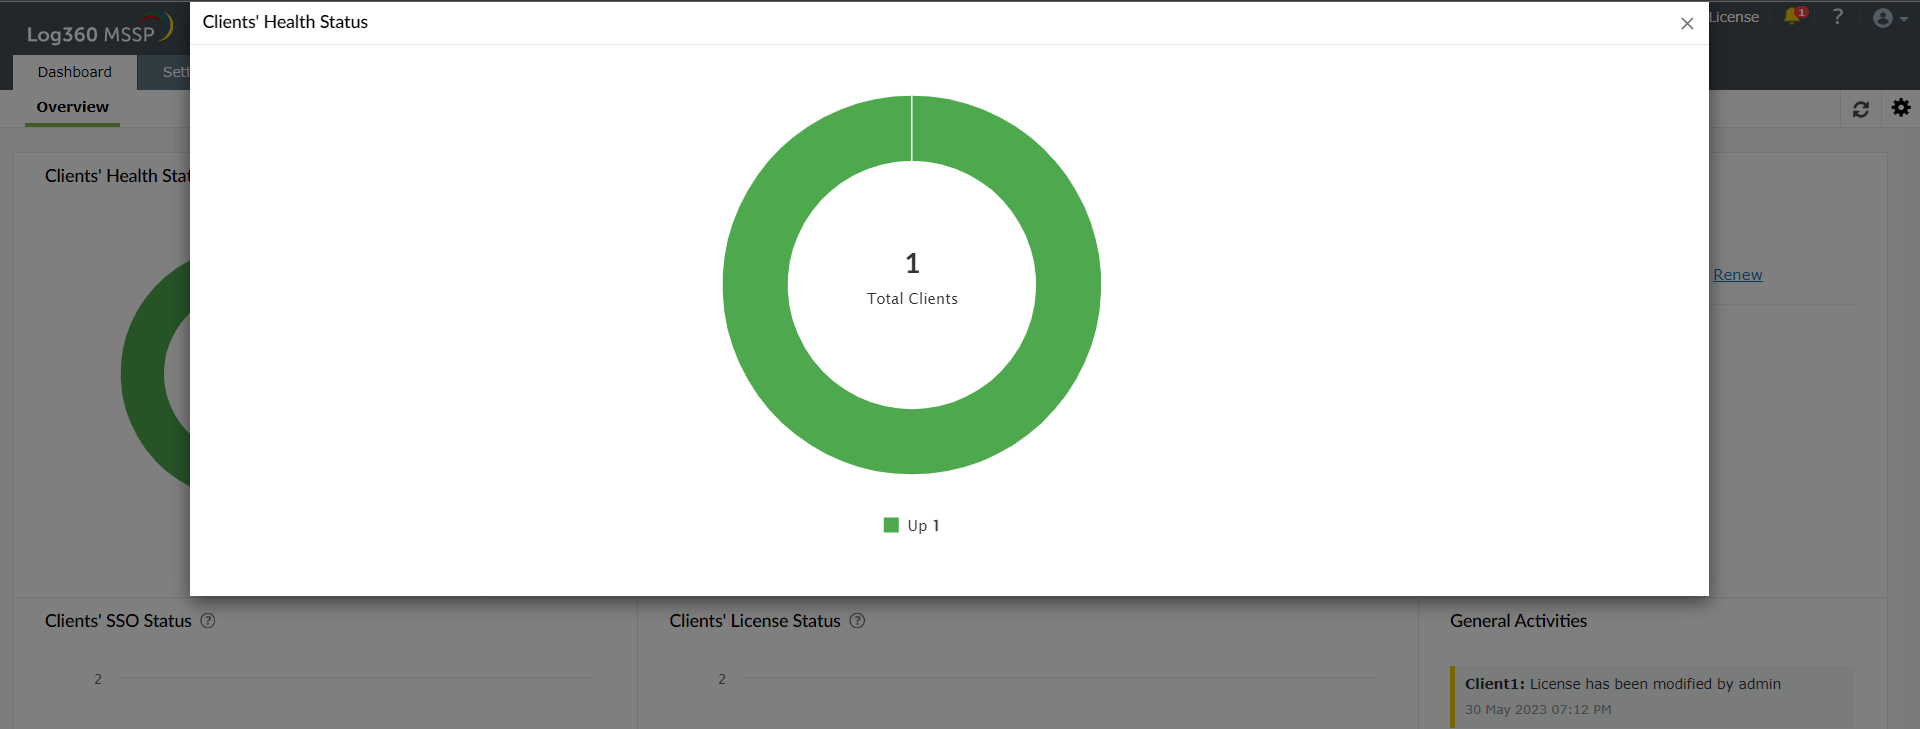
This widget shows the health status of the integrated clients. The statuses shown in this widget are Up, Partially Down, Down. By hovering over any slice of the chart, the clients respective to the status are shown.
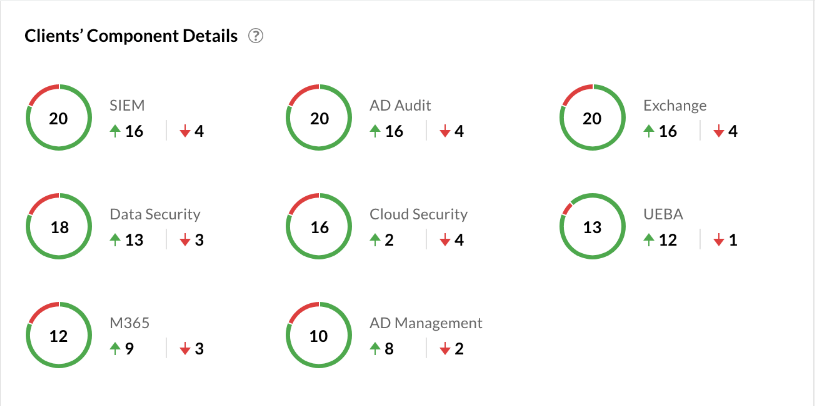
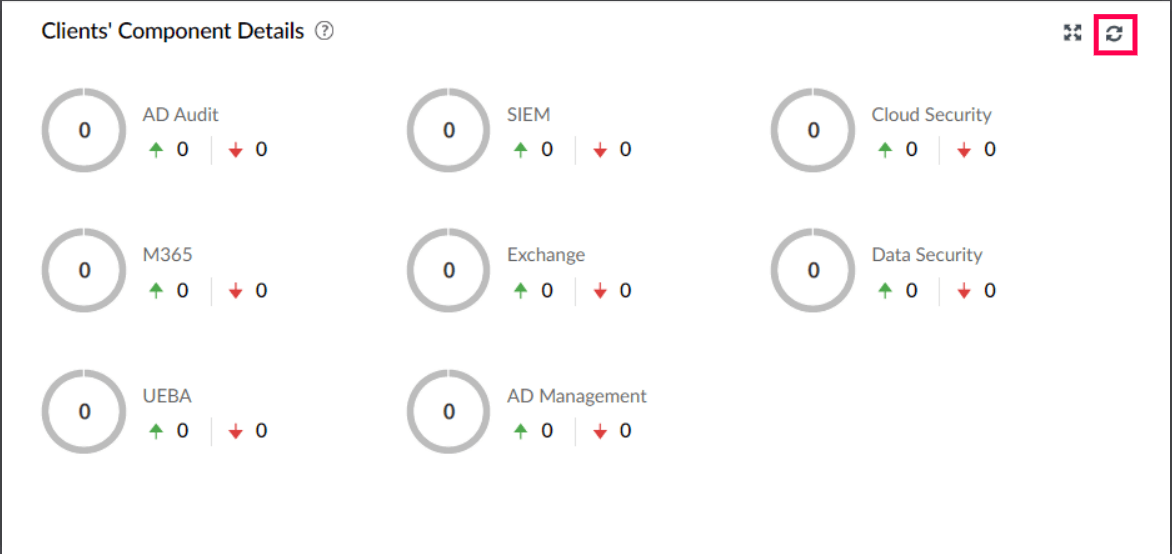
This widget shows the health status of the integrated clients' child components.The statuses shown in this widget are Up and Down. By hovering over the up or down count, the clients respective to the status are shown.
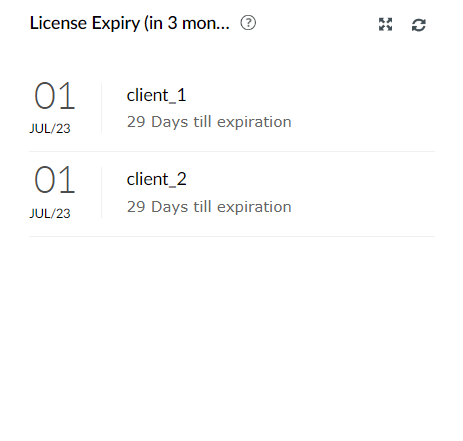
This widget shows the details of the client licenses which are going to expire in three months.
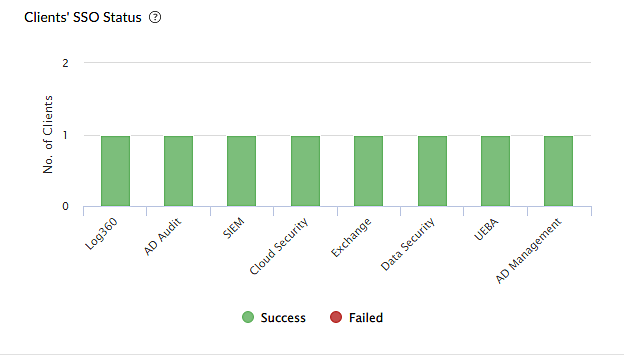
This widget shows whether SSO is working or not for a technician.The statuses shown in this widget are Success and Failed. The X-axis shows the client name and its integrated child components. The Y-axis shows the Number of clients. By hovering over each bar in the chart, the clients respective to the technician's SSO status are shown.
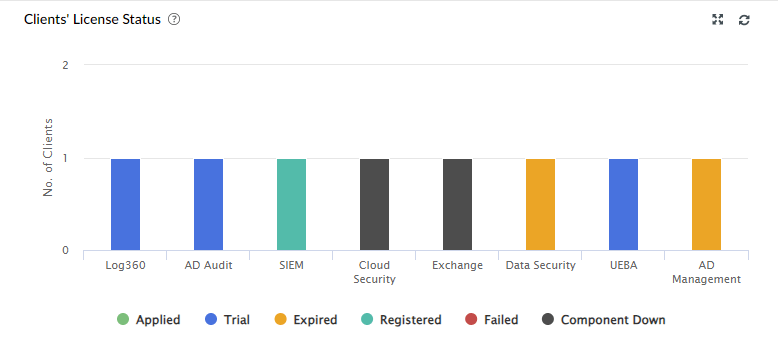
This widget shows the status of the license of the clients and its integrated child components.The statuses shown in this widget are Applied, Trial, Expired, Registered, Failed, Component Down. The X-axis shows the client name and its integrated child components. The Y-axis shows the Number of clients. By hovering over each bar in the chart, the clients respective to the license status are shown.
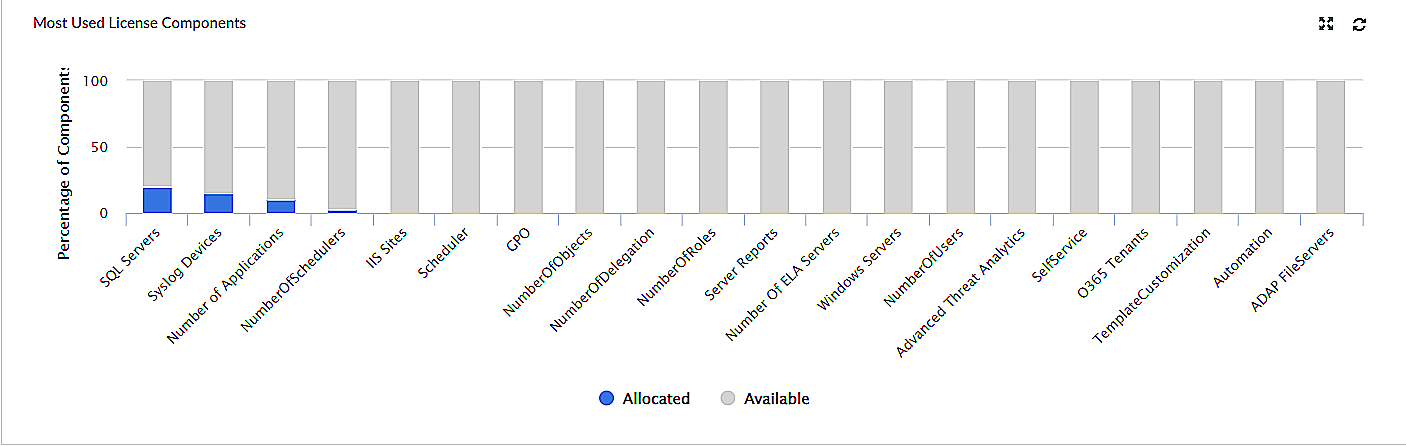
This widget shows the usage details of the license components allocated to the clients. It shows how many components have been used and how many are available. The X-axis shows various license components and the Y-axis shows the percentage of the used components and available components.
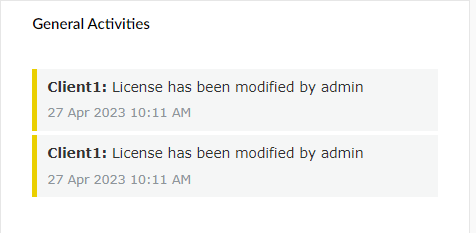
This widget shows the 30 most recent activities made on client licenses.
To customize the dashboard according to your preferences, the following options are available to you:
To reorder the widgets in a tab,
To change the time interval for the automatic refreshing of the dashboard,
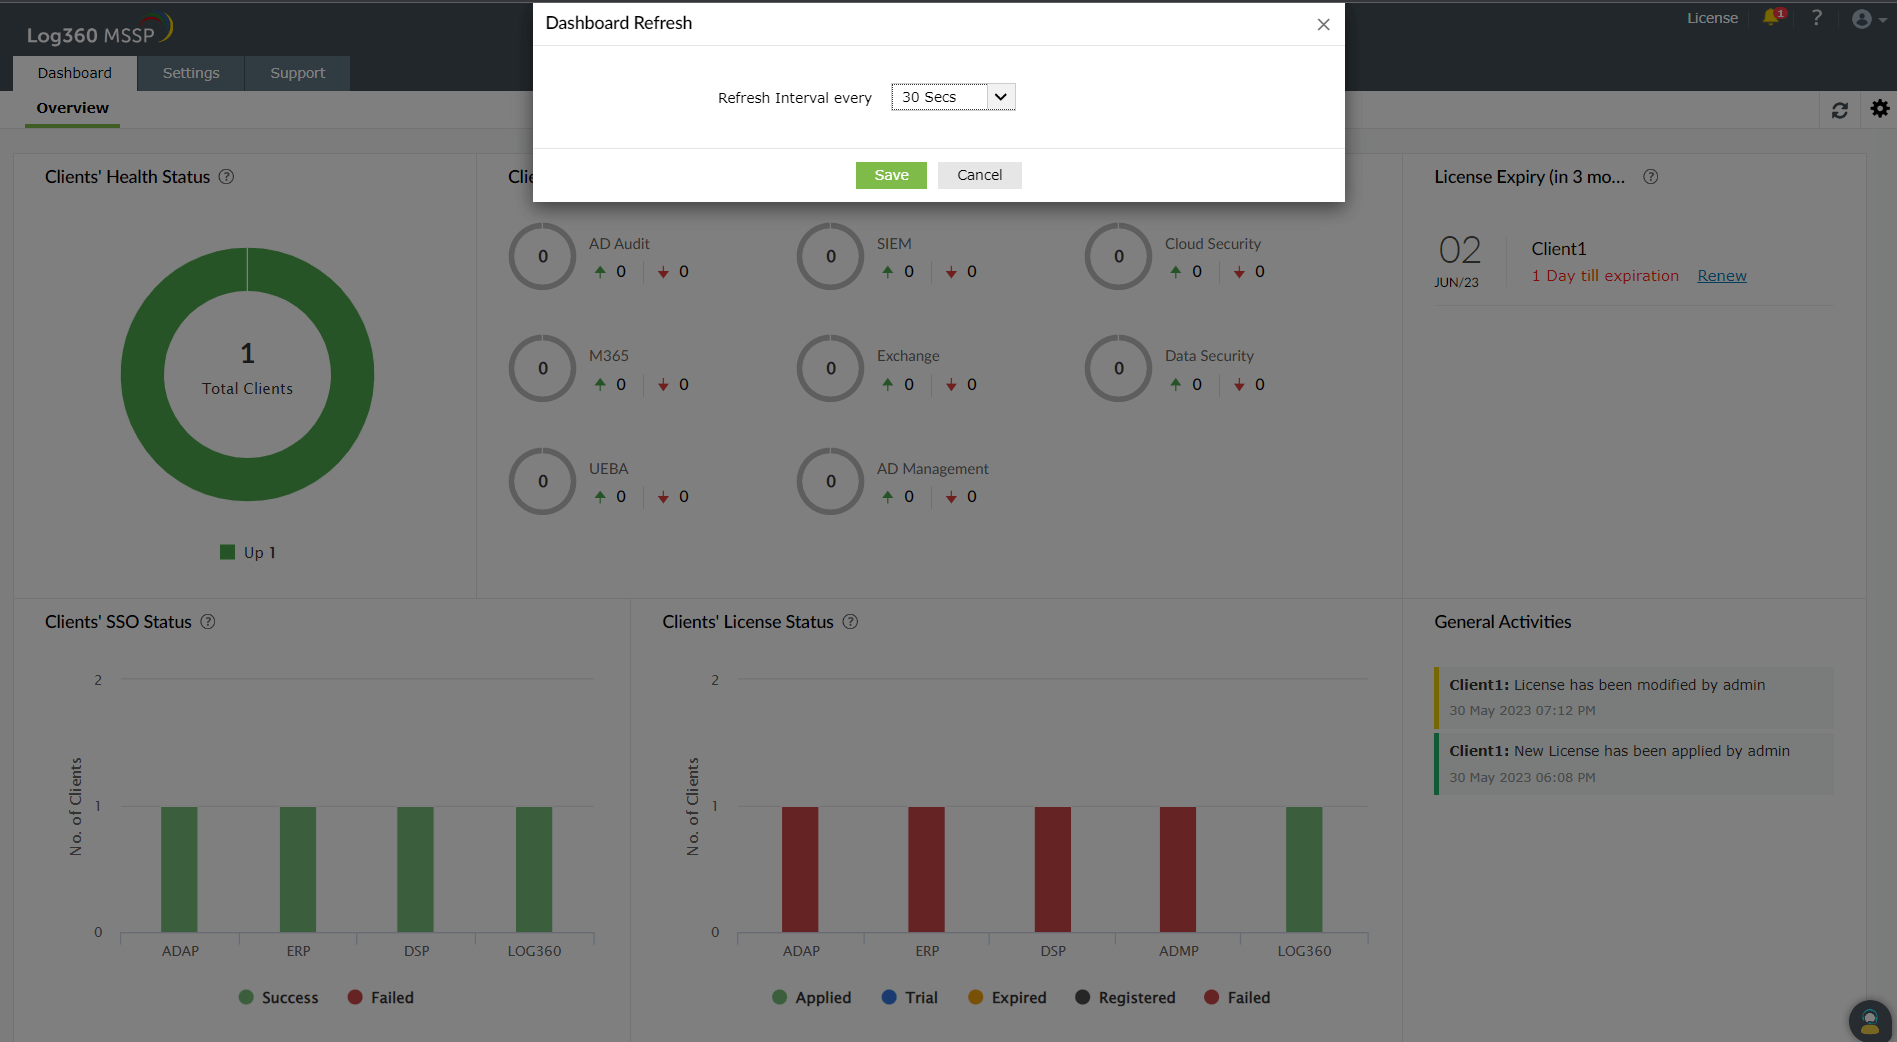
Note: If you choose Never for the refresh interval, the dashboard will never be refreshed automatically. You will have to refresh it manually.
Copyright © 2023, ZOHO Corp. All Rights Reserved.