Closed-Loop Remediation - Observability
Reactive approach used to be the norm
Traditional network management is heavily reliant on manual intervention to identify and resolve issues. The most notable symptoms in traditional monitoring are:
- High costs: Increased staffing needs and longer resolution times can significantly impact your bottom line.
- Downtime: Unresolved network bottlenecks and slowdowns disrupt user productivity and damage your reputation.
- Human error: Manual troubleshooting is prone to mistakes, potentially causing further problems.
Introducing Closed-Loop Remediation
Closed-loop remediation is a self-correcting mechanism that automates network issue resolution. It continuously monitors your network, detects problems, takes corrective actions, and verifies if the issue is truly fixed. This creates a closed loop, ensuring efficient and reliable network performance.
Benefits of Closed-Loop Remediation
- Faster Response Times: Automated remediation allows your network to respond to issues in real-time, minimizing downtime and service disruptions.
- Enhanced Efficiency: Streamline the entire remediation workflow, eliminating manual handoffs and delays.
- Continuous Improvement: Identify patterns and trends in network incidents to proactively address underlying issues before they escalate.
- Reduced Human Error: Automation minimizes errors caused by manual troubleshooting.
You can't fix what you can't see: Infrastructure observability is mandatory for closed-loop remediation
Closed-loop remediation involves facets that stretches beyond just network performance monitoring. The scope is wider and hence, a regular network performance monitoring tool will fall short of achieving true closed loop remediation.
To achieve automated remediation, it is essential to achieve infrastructure observability. An infrastructure observability solution presents you a holistic view of the entire IT infrastructure, including network devices, servers, applications, virtual and cloud environments. A wide range of data is collected to analyze and identify problems to in turn understand the underlying causes; the unknown unknowns as they say.
Network Hiccup? OpManager Plus Takes Care of Business
OpManager Plus provides comprehensive closed-loop remediation capabilities, let's understand that with a use case:
John is an IT admin, who's entrusted with overseeing his organization's network infrastructure. Inevitably over the course of normal operations, an network issue pops up.
Here's how OpManager Plus uses closed-loop remediation to automatically diagnose and fix the problem:
Detection & Allocation
Seeing the big picture with Observability:OpManager Plus gathers telemetry from across entire network, including cloud environments. It analyzes this data to pinpoint the problem and determine its severity.
OpManager Plus, as an all-in-one unified observability tool, is equipped with advanced capabilities designed to manage your dynamic IT environment seamlessly. Features such as AI and ML-powered adaptive thresholds, network performance monitoring, cloud observability, configuration and change management, firewall log management, and bandwidth managemen, offers comprehensive observability into your IT infrastructure. When these capabilities are combined with powerful visualization and reporting features, OpManager Plus provide a level of granular observability that can significantly enhance your organization's efficiency and productivity.
Assigning ownership:Based on pre-configured user roles or custom user roles set within OpManager Plus, the platform automatically assigns ownership of the incident to the most appropriate team or individual. This ensures the right people are notified and can take action.
User roles feature in OpManager Plus enables IT admins to enforce accountability while also providing a foundation to access control. With this feature, IT teams can ensure each network issue is assigned to the right people. The result is improved team collaboration, efficient workflow and seamless incident management.
Ticket creation:Leveraging OpManager Plus' integration with ITSM tools like ServiceDesk Plus or ServiceNow, a detailed ticket is automatically generated. This ticket outlines the specific problem and its potential impact, keeping everyone on the same page.
OpManager Plus brings ITOM and ITSM together, thanks to tight integration with ManageEngine ServiceDesk Plus (SDP) and ServiceNow, providing an efficient IT fault management system to automate creation and assigning of trouble–tickets.
Reaching the right people, right away:Thanks to notification profiles within OpManager Plus, the responsible team or individual receives an immediate notification about the incident. This ensures a swift response to the issue.
When a fault is detected in your network, an event occurs and multiple events correlate to trigger an alarm. You can configure OpManager Plus to notify the network administrator or perform automatic actions based on the alarm raised for a device using the notification profiles feature.
Remediation
Getting to the bottom of the issue:OpManager Plus's built-in root cause analysis feature goes beyond just identifying the issue. It delves deeper to pinpoint the exact cause, allowing for a more effective and permanent resolution.
OpManager Plus' Root Cause Analysis (RCA) simplifies performance troubleshooting by aggregating data from various network components. Users can create an RCA Profile to collect and analyze performance data from specific devices, interfaces, or URLs. This centralized platform allows for visual comparison and annotation of findings, leading to faster and more accurate problem resolution.
Taking corrective action:Based on the identified root cause, OpManager Plus triggers pre-defined workflows (automated scripts) within the platform. These workflows may involve restarting a specific network device, rerouting traffic, or even applying configuration changes – all automatically. Alternatively, OpManager Plus can integrate with tools like Ansible to execute even more complex remediation runbooks.
OpManager Plus boasts of tightly coupled IT automation workflow feature. With enterprise workflow automation capabilities at your fingertips, you can start/stop/resume services, processes, and automate other tasks with over 70 workflow actions based on user-defined conditions.
Validation & closure
Putting the fix in place (Deployment):Once the most suitable solution is identified, OpManager Plus utilizes its configuration management features to deploy the fix directly into the network environment. Diffview functionality allows John to review the changes being made before deployment for added peace of mind. Additionally, rollback features ensure a safety net in case the fix introduces unintended consequences.
OpManager Plus' configuration and change management features come handy to ascertain the optimal configuration setting for your network. Leverage Diff View to see side-by-side comparisons of configuration files. With configuration restore feature, you can rollback a configuration to its baseline in no time. Diffview and configuration restore combines to give IT admins ample time to evaluate a new fix and take corrective measures without affecting business productivity.
Double-Checking the fix (Validation):John doesn't have to rely on guesswork. OpManager Plus automatically generates in-depth reports and visualizations to validate the effectiveness of the deployed solution. This allows John to confirm that the network issue has been truly resolved.
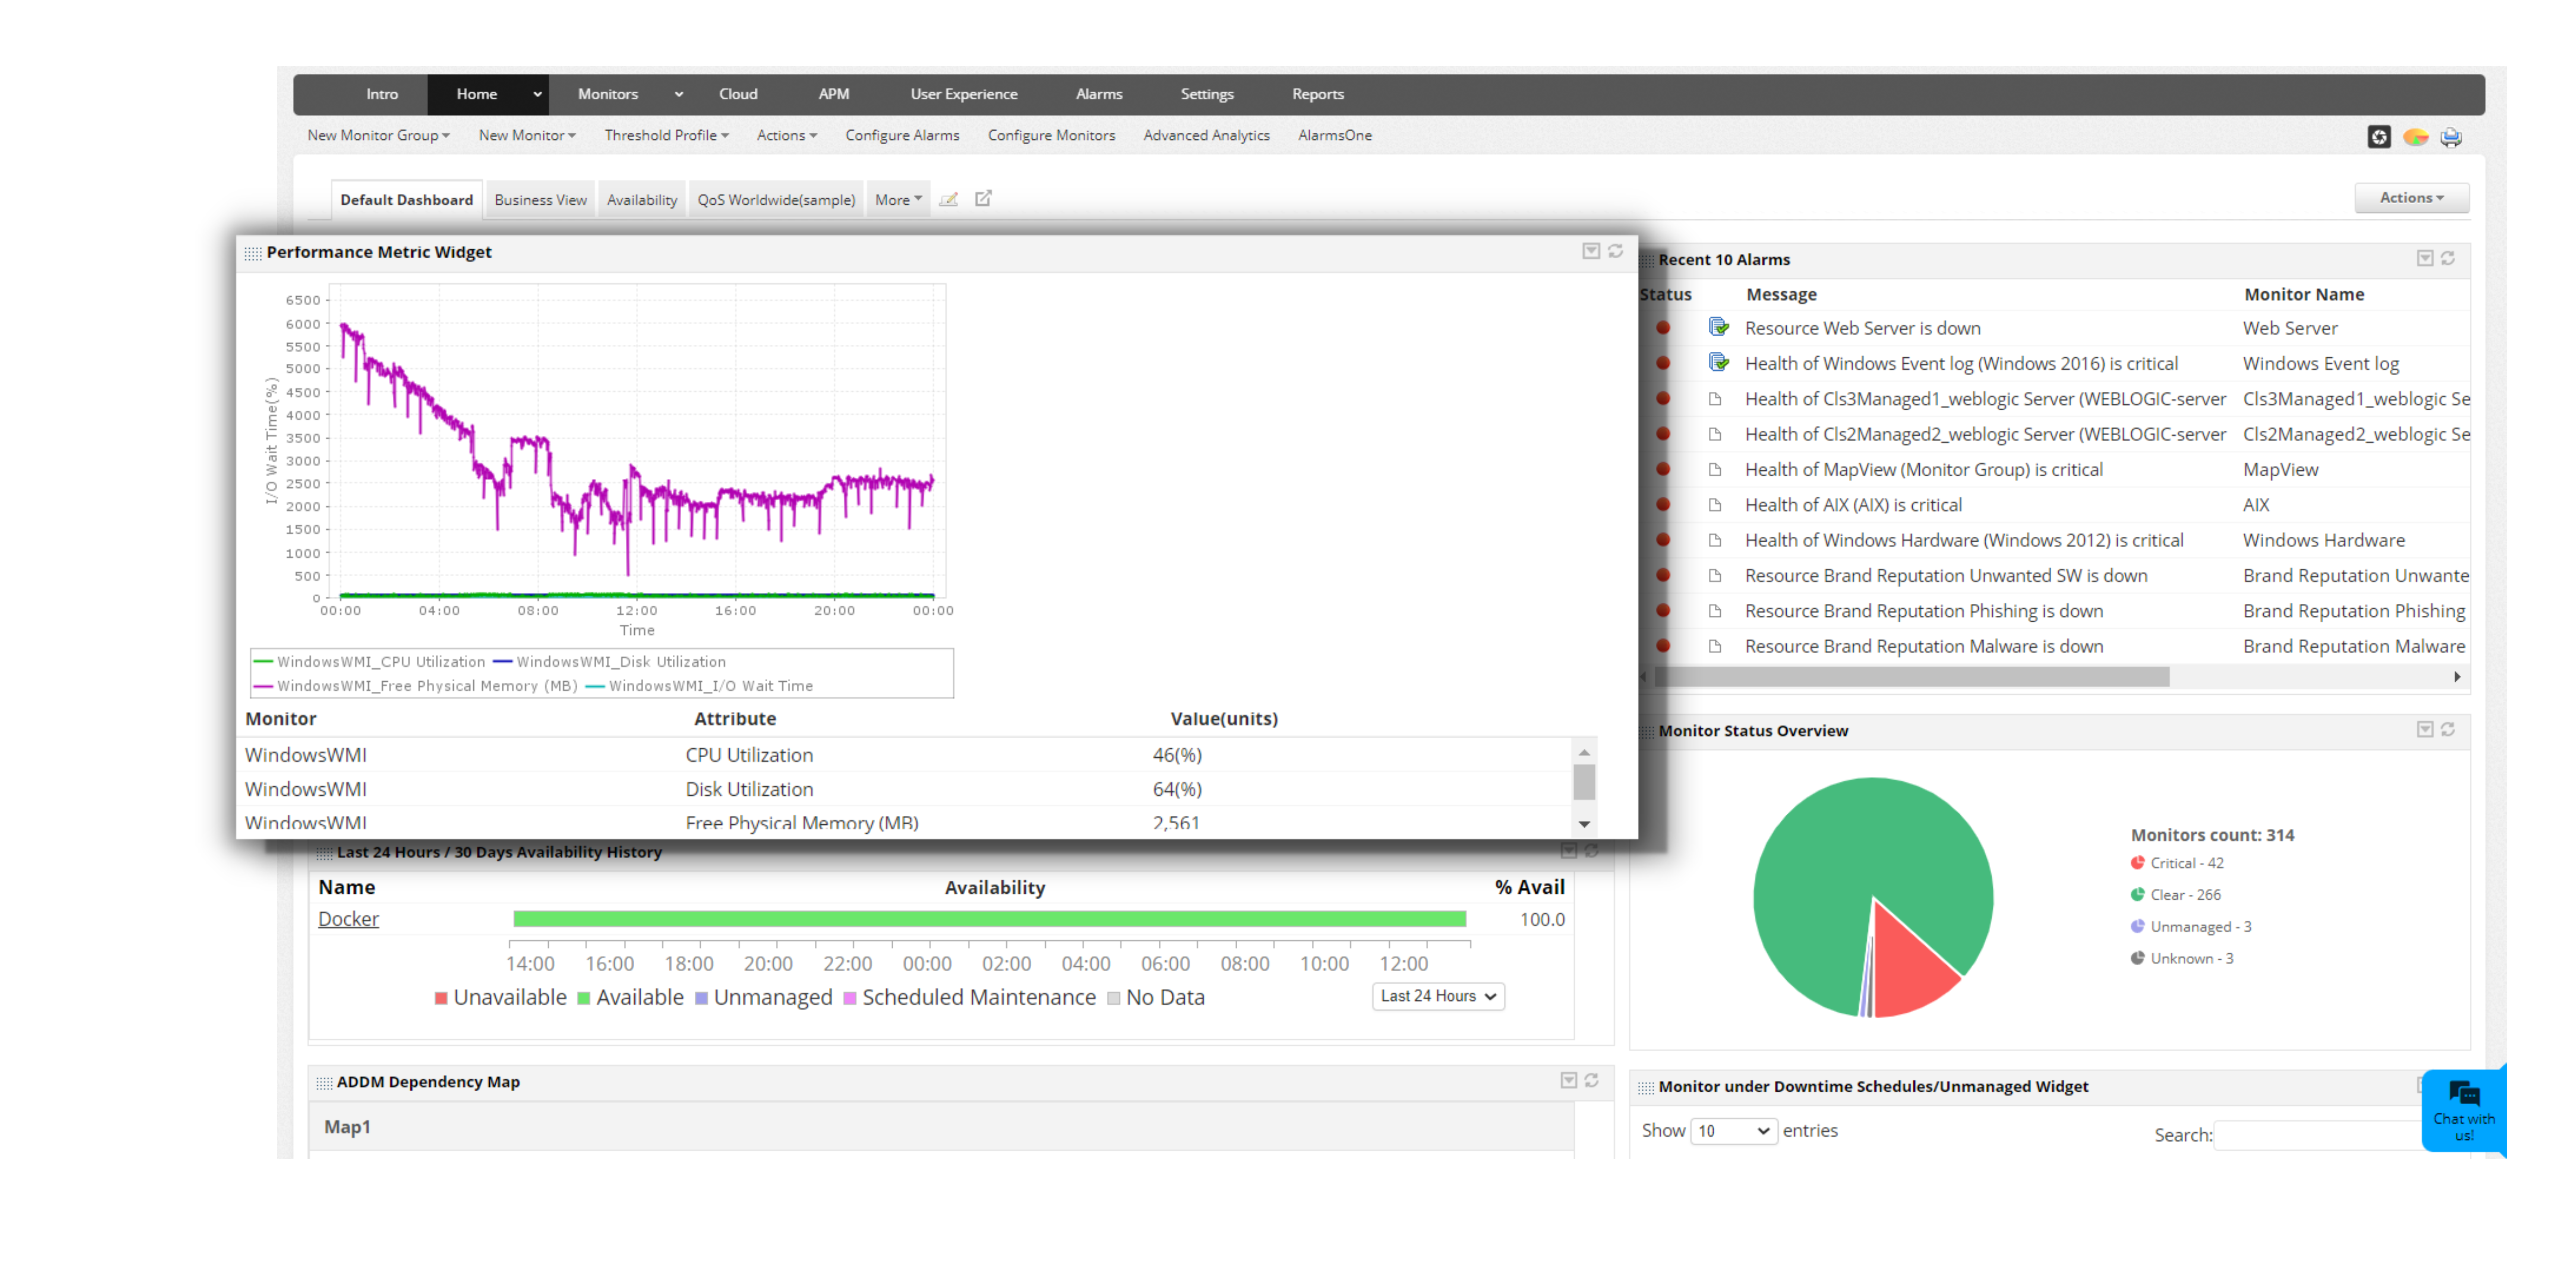
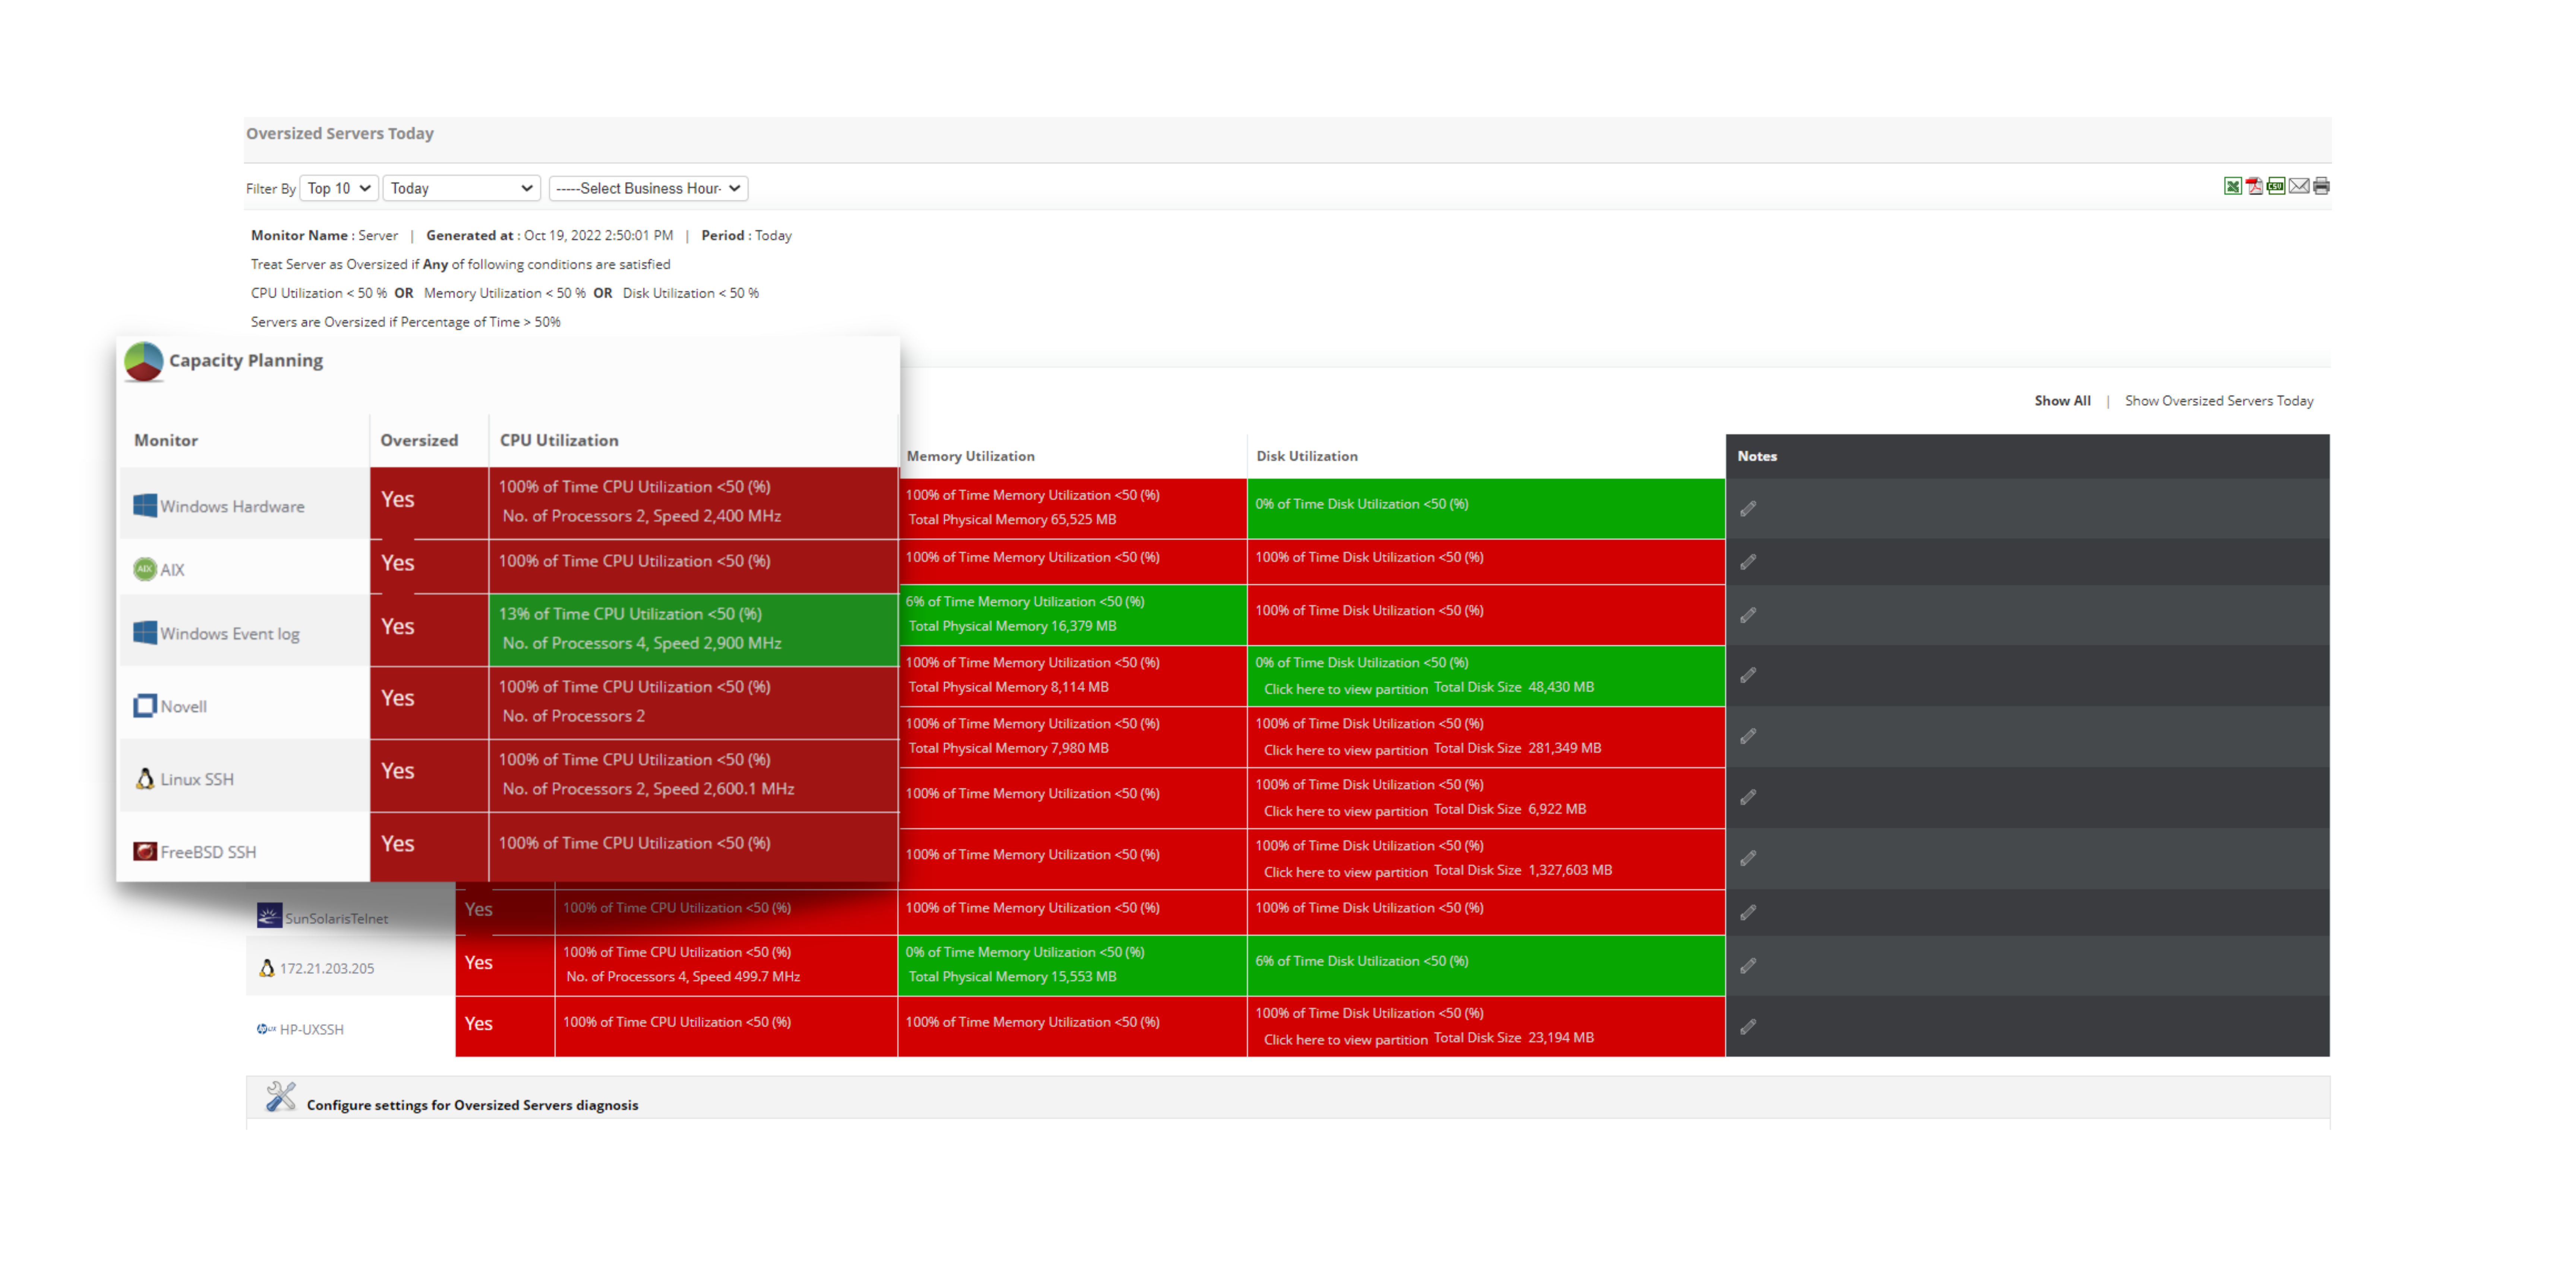
Get real-time overview of your network and review health, availability and performance using advanced visualization features. Customizable dashboards with charts and graphs provide a real-time overview of network health. Gain a clear picture of your network layout with 3D data center views, Layer 2 maps and rack views. Over 100 pre-built reports offer in-depth analysis of historical data, helping you identify trends and track network performance over time.
Help us serve you!
Contact us now to make your enterprise network observable and get answers to all your network management needs. Download a fully functional, 30-day trial of OpManager Plus, or check out our online demo.


