If JD Edwards Enterprise system is the backbone of your business, keeping it healthy and high performing can go a long way in ensuring smooth operations and maximum efficiency. Common issues such as slow logins with endless wait time, lagging transactions, and frustrated users can make any IT administrator break a sweat.
Applications Manager is a proactive JD Edwards monitoring tool that ensures that your system operates flawlessly, and your business thrives without interruptions.
Monitor JD Edwards EnterpriseOne from end-to-end with these capabilities:


Whether you're running JD Edwards on Oracle, SQL server or DB2, you need to make sure the database is stable and performing optimally. Applications Manager enables you to monitor the health and performance of databases and become aware of problems as they occur.
More on database monitoring.
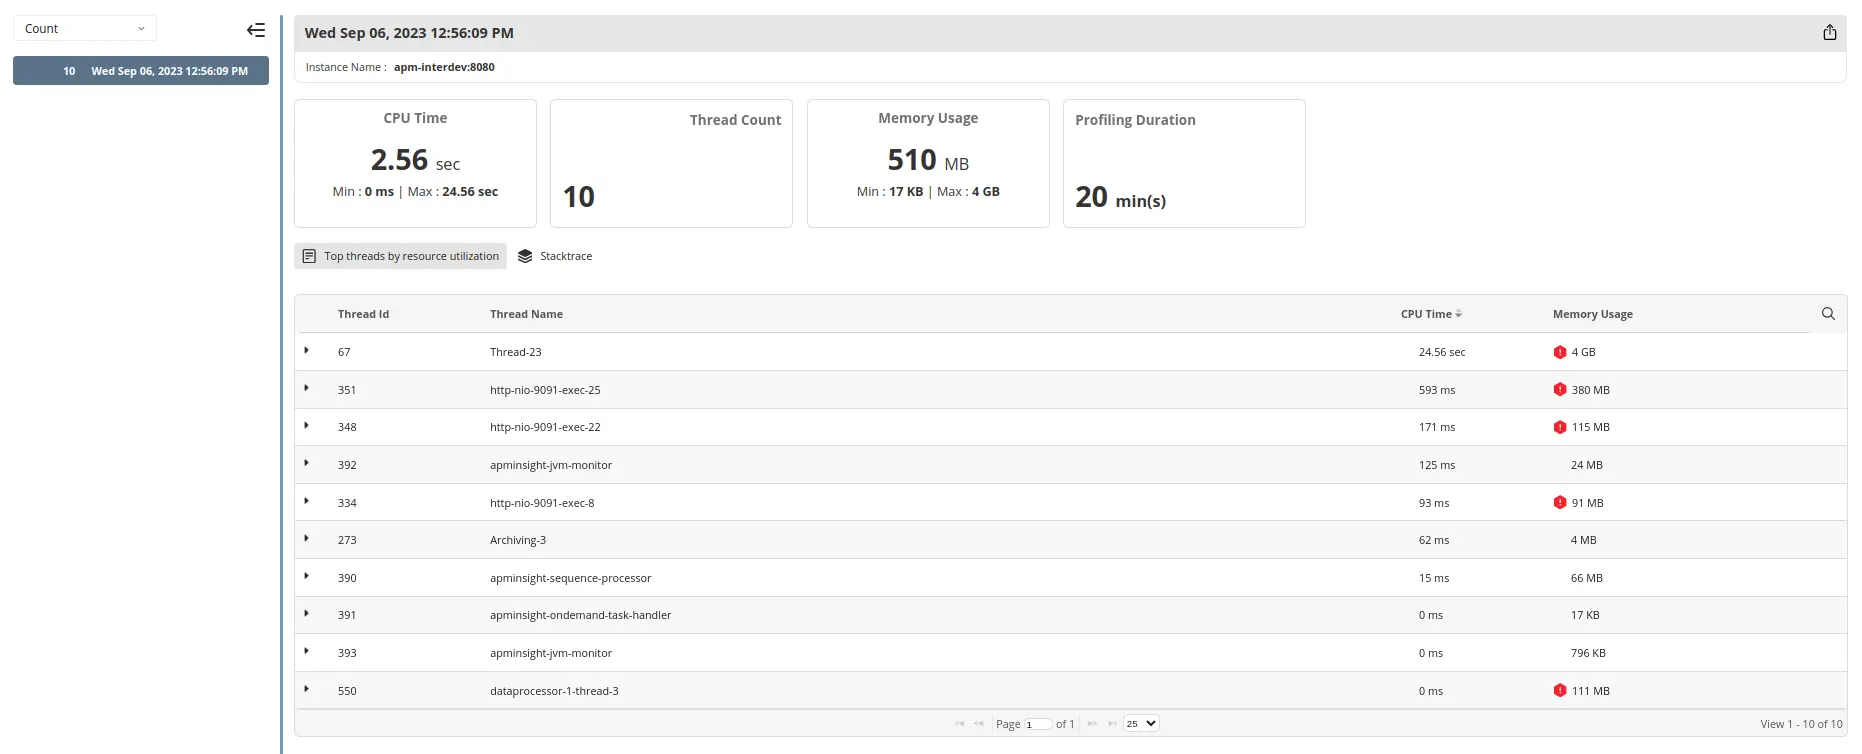
The application server is the central framework of your JD Edwards application that handles the processing of business logic and interacts with the database. Ensuring optimal performance and availability of these servers is crucial for a smooth JD Edwards experience.
Applications Manager offers in-depth monitoring for JD Edwards EnterpriseOne application servers and provides insights into critical KPIs such as CPU utilization, memory usage and response times. This not only helps prevent resource bottlenecks, but also ensures high availability, thereby facilitating seamless business operation via your JD Edwards system.
Applications Manager supports monitoring of various application servers such as Oracle Weblogic, IBM WebSphere, and Microsoft Internet Information Services (IIS) among many others ensuring comprehensive support regardless of the application server your JD Edwards system is running on!
Your JD Edwards system relies on a network of endpoints to communicate and exchange data.These digital gatekeepers are crucial for a seamless user experience. Applications Manager's synthetic monitoring capabilities simulate real-world interactions to uncover potential issues before they impact users. From response times to error screenshots, it can act as your first line of defense to prevent endpoint failures that may disrupt your business.

Understanding how real users interact with your JD Edwards web applications is essential for delivering a smooth and efficient user experience. Applications Manager's RUM tool provides deep insights into user behavior, performance metrics, and user satisfaction by capturing data from actual user sessions. You can track individual user sessions, measure key performance indicators like page load times and transaction speeds, and analyze performance across browsers, devices, and location. By evaluating user satisfaction and setting up real-time alerts for anomalies, you can resolve issues promptly! Applications Manager serves as a monitoring tool for JD Edwards, helping you optimize web applications for enhanced performance and user engagement, ensuring a seamless user experience and smooth operations.

Whether you're managing finances, human capital, the supply chain, projects, or customer relationships, Applications Manager has you covered.
Take control of your business performance with Applications Manager. Experience lightning-fast logins, seamless transactions, and happier, more productive users—make this your reality! Download a 30-day, free trial now and start exploring instantly!
It allows us to track crucial metrics such as response times, resource utilization, error rates, and transaction performance. The real-time monitoring alerts promptly notify us of any issues or anomalies, enabling us to take immediate action.
Reviewer Role: Research and Development

"I like Applications Manager because it helps us to detect issues present in our servers and SQL databases."
Carlos Rivero
Tech Support Manager, Lexmark
Trusted by over 6000+ businesses globally