Ensure your MySQL databases perform at their best with ManageEngine Applications Manager’s MySQL monitoring capabilities. Get instant visibility into critical metrics like queries, replication, connections, and resource utilization to keep your databases running smoothly. With real-time alerts, detailed performance analytics, and intuitive dashboards, Applications Manager helps you detect and resolve issues faster, minimize downtime, and ensure consistent database performance across environments.
Simplify MySQL monitoring with Applications Manager
ManageEngine Applications Manager’s MySQL monitoring tool helps database administrators gain complete visibility into MySQL performance and availability. Track key metrics, analyze slow queries, and detect anomalies before they affect end users. With intuitive dashboards and smart alerts, you can proactively troubleshoot issues, optimize resources, and ensure uninterrupted database operations.
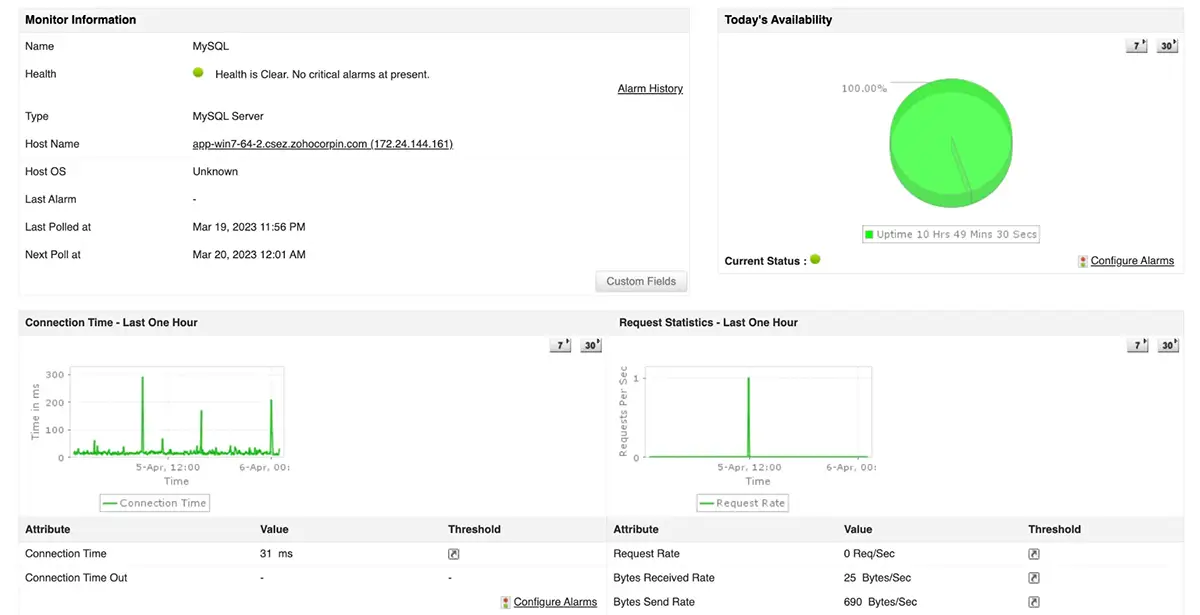
Applications Manager uses intelligent forecasting reports to help predict the growth trend of critical MySQL resources that could result in performance bottlenecks and downtime. It also provides an understanding into the database usage patterns which gives room for capacity planning. With the aid of key MySQL metrics obtained from the MySQL performance monitor, you can easily understand the health, availability, and performance of different MySQL components.
Track key MySQL metrics to ensure reliable performance
Applications Manager tracks essential MySQL metrics that help you understand and fine-tune your database performance:
- Connections: Monitor open, aborted, and active connections to identify potential bottlenecks in user access.
- Requests: Measure the rate at which requests are processed, sent, and received to spot workload imbalances.
- Threads: View thread activity, cache size, and status to optimize concurrency and reduce latency.
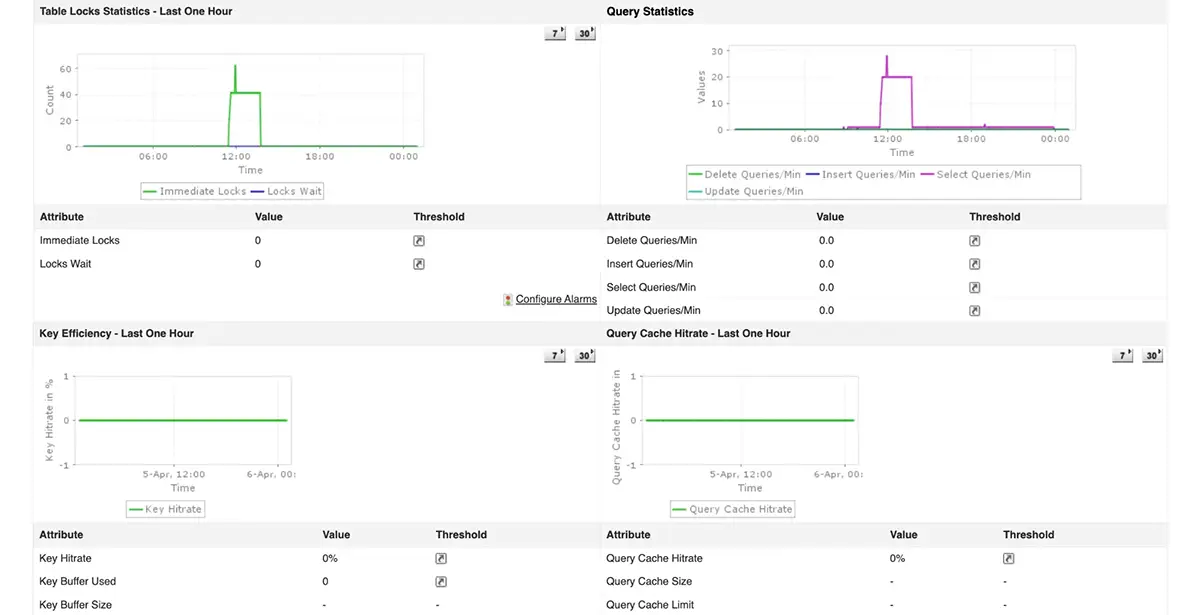
- Table locks: Detect lock waits and rejections to prevent performance degradation during concurrent transactions.
- Key hits: Track key cache hit rate and size to improve read performance and reduce disk I/O.
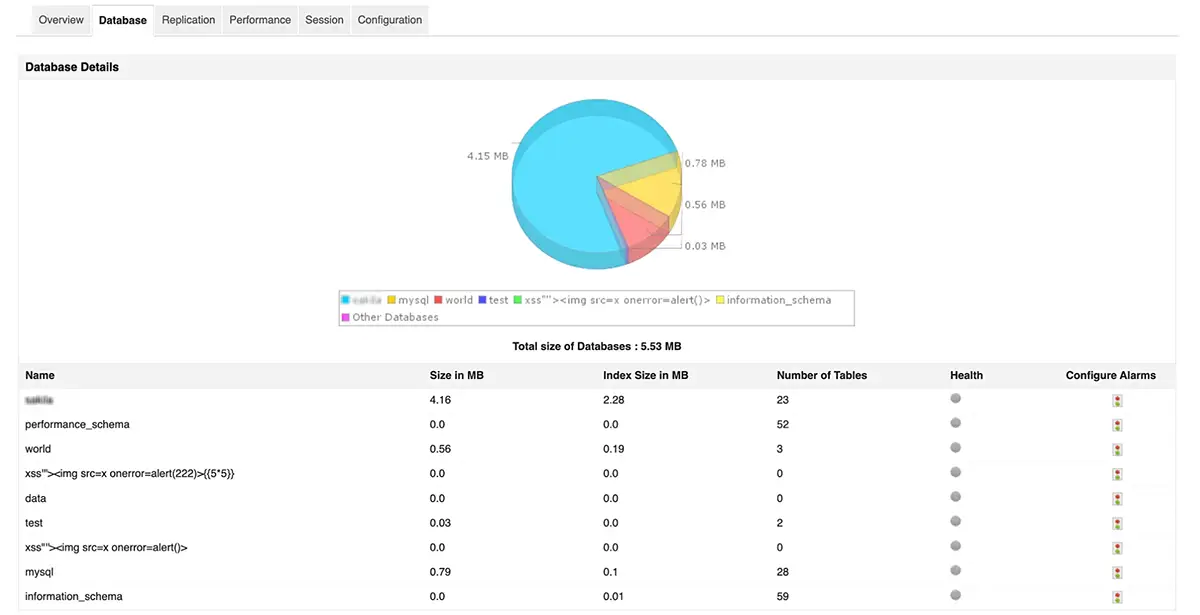
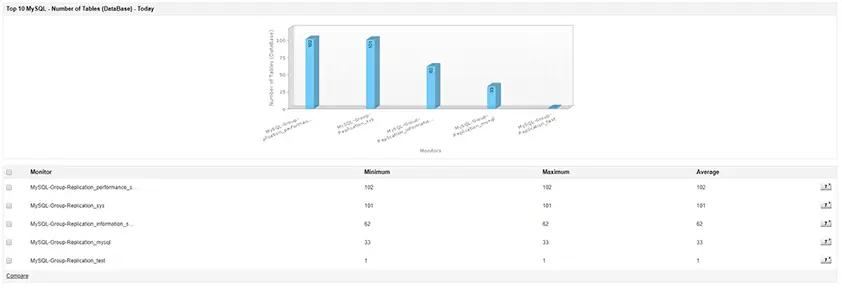
- Databases: Visualize memory usage and index size distribution across system databases for efficient capacity planning.
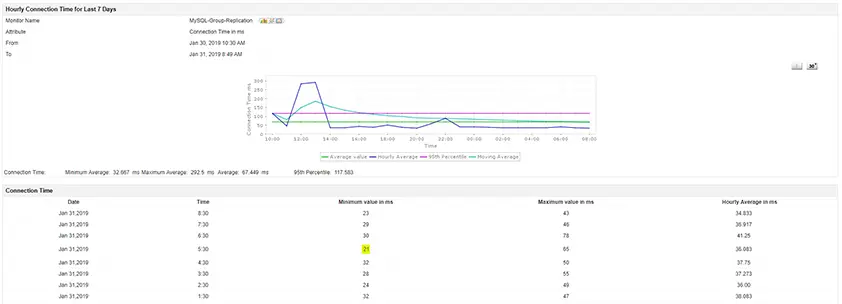
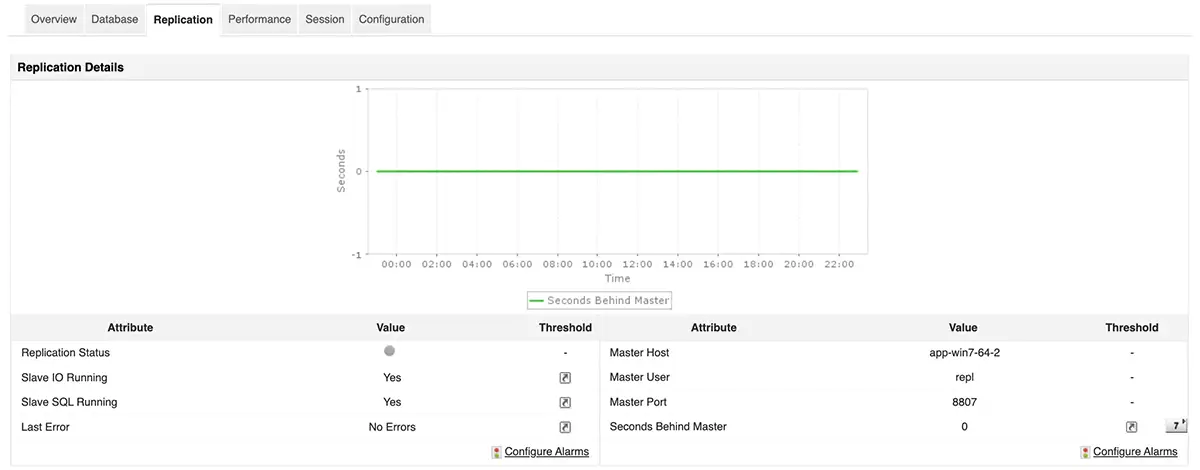
- Replication: Analyze master-slave replication metrics and time lags to maintain data consistency.
- Queries: Identify queries consuming high CPU or execution time and optimize them for better performance.
- Sessions: Track session states, commands, and query details to assess real-time database workload.
- Variables: Get a complete view of system variables and configurations in a single dashboard.
MySQL monitoring use cases
1. Proactive performance validation after deployments
Use MySQL monitoring to validate database performance immediately after application releases or schema changes, and quickly identify regressions before they affect users.
2. Early warning for abnormal workload patterns
Detect unusual spikes in query volume, connections, or resource usage through MySQL monitoring to spot workload anomalies that often precede performance issues.
3. Operational visibility for shared MySQL environments
MySQL monitoring helps teams understand how multiple applications or tenants impact shared databases, improving accountability and capacity planning.
4. Faster incident triage during application slowdowns
When applications slow down, MySQL monitoring provides immediate database-level context to confirm or rule out MySQL as the root cause.
Monitor MySQL servers to improve performance and prevent downtime
Detect slow MySQL queries with proactive MySQL monitoring
Monitor every aspect of your MySQL environment, from query execution to replication lag, with Applications Manager’s in-depth dashboards and reports. Gain insights into how workloads, queries, and replication configurations affect performance, and resolve issues quickly to ensure continuous database availability.
Use Applications Manager’s MySQL query monitoring feature to analyze query execution time, CPU usage, and response patterns. Set up threshold-based alerts to get notified when critical queries slow down, and use detailed reports to pinpoint the root cause of latency.
Ensure database availability with MySQL replication monitoring
Applications Manager helps monitor MySQL replication topologies to ensure data consistency and minimal latency. Track replication lag, master-slave synchronization status, and data flow errors in real time. Get instant alerts for replication delays and maintain continuous data availability across database nodes. If your environment includes MS SQL, our SQL Server monitoring features bring equivalent depth!
Trace MySQL queries and uncover performance bottlenecks with APM
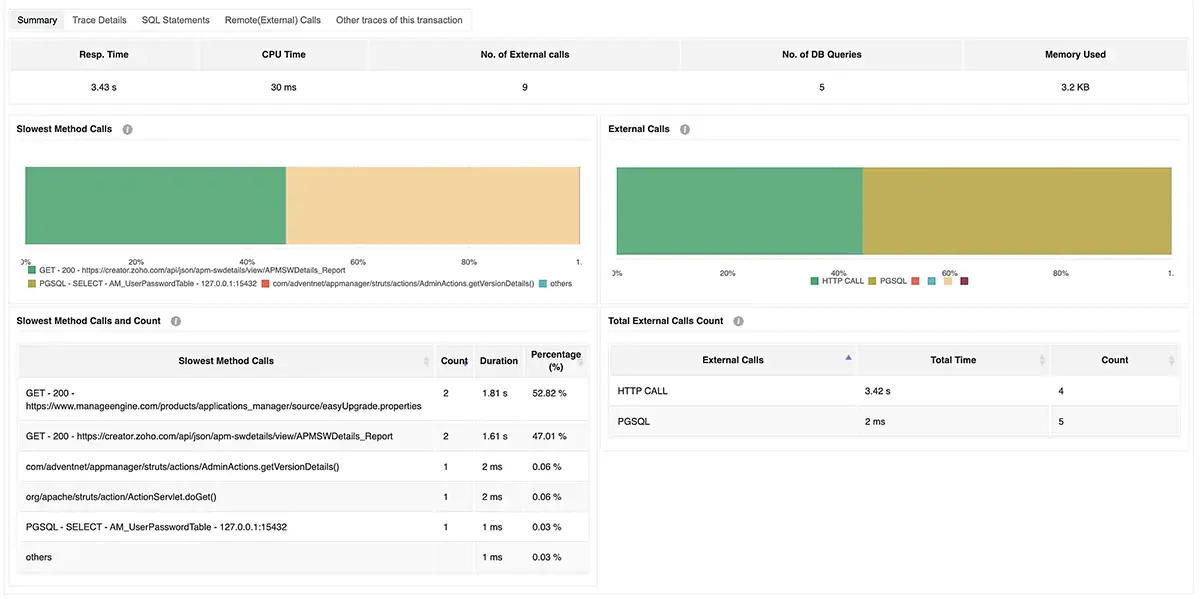
Integrate Applications Manager’s application performance monitoring (APM) feature to trace MySQL queries in your Java, .NET, Node.js, or PHP applications. Visualize query paths, execution times, and dependent code blocks to isolate issues faster and improve overall application performance.
Predict MySQL performance trends with machine learning insights
Applications Manager leverages machine learning-based forecasting to predict future growth and utilization trends of your MySQL servers. Analyze historical performance data, compare reports, and anticipate capacity needs before they impact performance. Create and schedule custom reports to track progress automatically.
Furthermore, Applications Manager's MySQL monitoring also offers the flexibility to create your own custom reports and schedule these reports to be generated at regular intervals of time.
Choose a MySQL monitoring tool that scales with your business
Applications Manager combines advanced analytics, intelligent alerting, and automation to help you manage MySQL databases of any size. Whether you’re monitoring standalone servers or complex clusters, it ensures high performance, proactive issue resolution, and data-driven insights. Get started in minutes and experience full-stack observability in your MySQL ecosystem.
ManageEngine Applications Manager can easily be configured to check MySQL performance in just a few minutes. To experience our MySQL monitoring software on your own, download a 30-day free trial now!

