Visualizing application performance monitoring (APM) and Real User Monitoring (RUM) data together offers a comprehensive view of both application performance and user experience. The RUM Analytics tab in Applications Manager provides a detailed, user-centric view of application performance, enhancing problem diagnosis and resolution. This improves user experience, supports data-driven decision-making, and ensures effective resource management.
While APM focuses on the application's technical performance, RUM provides insights into how real users are experiencing the application. This dual perspective ensures that technical metrics align with user satisfaction.
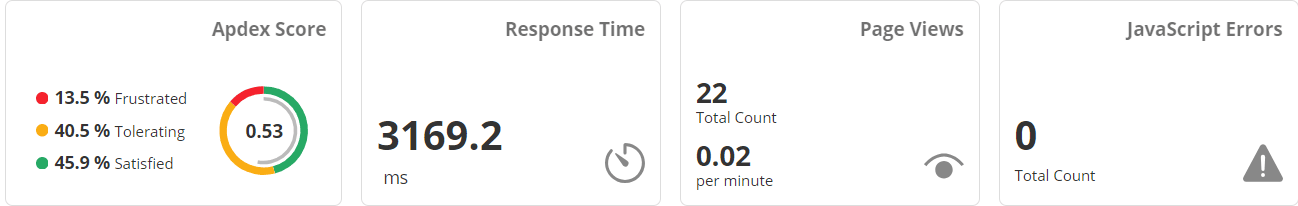
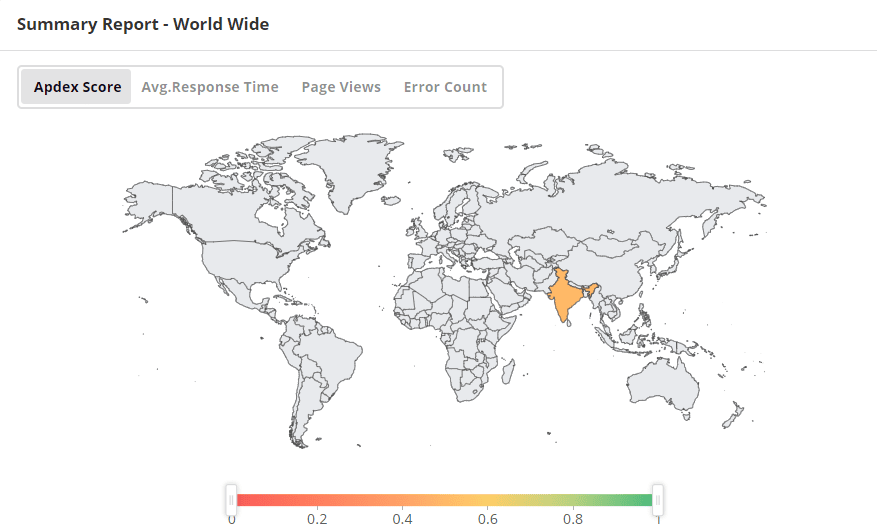
By analyzing data such as the Apdex score, you can understand how users perceive the performance of your applications. Monitoring Page Views offers insights into your website or application's traffic volume, helping you understand user interest and engagement levels.
Keep track of the response time and JavaScript errors metrics and take preventative measures if they reach alarming values to ensure user satisfaction.
Understand how backend performance issues impact your application's performance. If a server bottleneck is causing slow page loads, RUM Analytics can show the extent of the impact on user experience through increased response times.
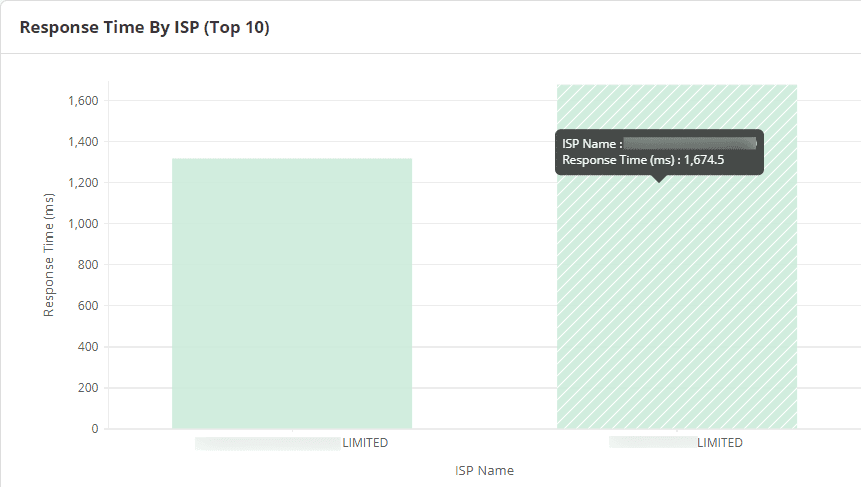
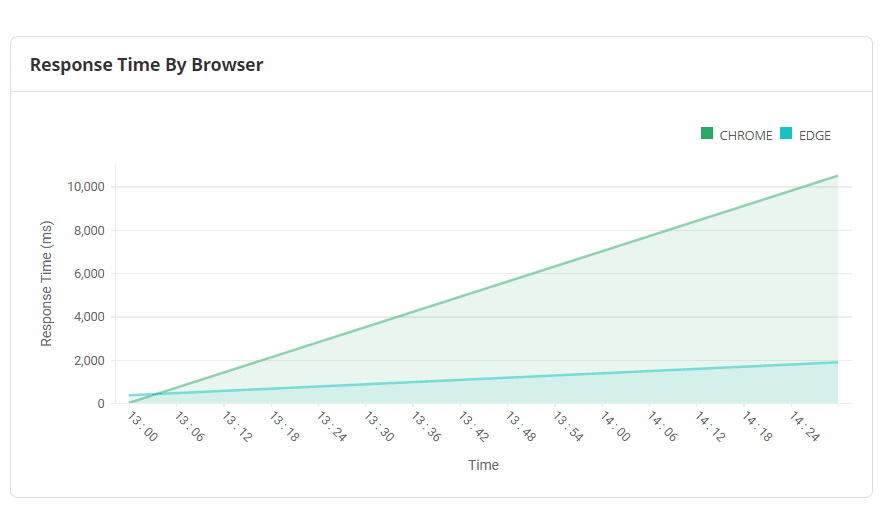
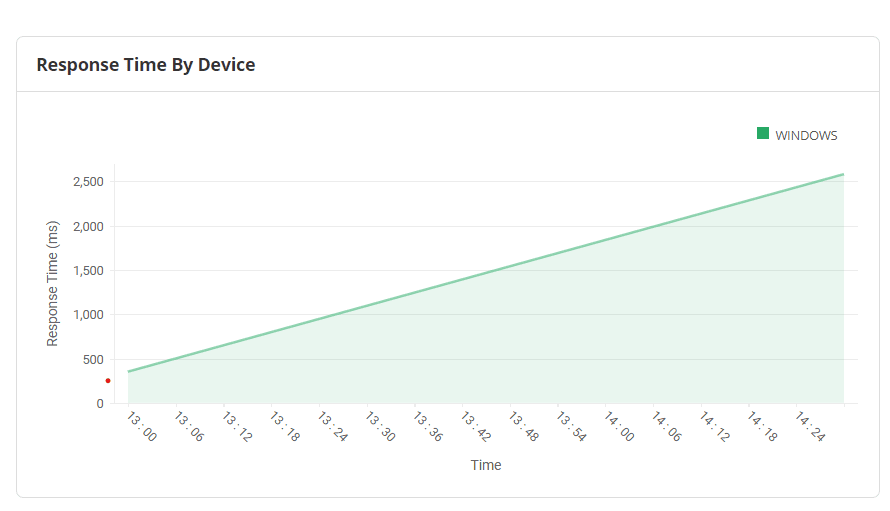
By using application-level analytics on response times by ISP, browser, and device, you can proactively identify and resolve performance bottlenecks before they significantly affect users, leading to a smoother and more reliable user experience.
Worldwide summary reports provide a comprehensive view of application performance across different geographical regions. This helps in identifying regional performance variations and ensures a consistent user experience globally. Pinpoint locations where users are affected by slow website performance based on Response Time, Page Views, Error count, and Throughput in real time.
RUM Analytics provides key RUM metrics in the same console as APM Insight. While APM provides insights into server health, database performance and code execution, RUM provides insights into front-end performance. Combining this data offers a holistic view that allows for thorough performance analysis. Instead of looking at server performance in isolation or user experience metrics alone, the combined data gives a complete picture of application health. You can correlate user behavior with performance metrics and assess the impact of application changes on user experience and business goals. Navigating to the RUM monitor from RUM Analytics is also easy and can be done using a single click.
Download a 30-day free trial of Applications Manager and explore the APM-RUM integration instantly!
It allows us to track crucial metrics such as response times, resource utilization, error rates, and transaction performance. The real-time monitoring alerts promptly notify us of any issues or anomalies, enabling us to take immediate action.
Reviewer Role: Research and Development

"I like Applications Manager because it helps us to detect issues present in our servers and SQL databases."
Carlos Rivero
Tech Support Manager, Lexmark
Trusted by over 6000+ businesses globally