Reports
Overview of reporting features
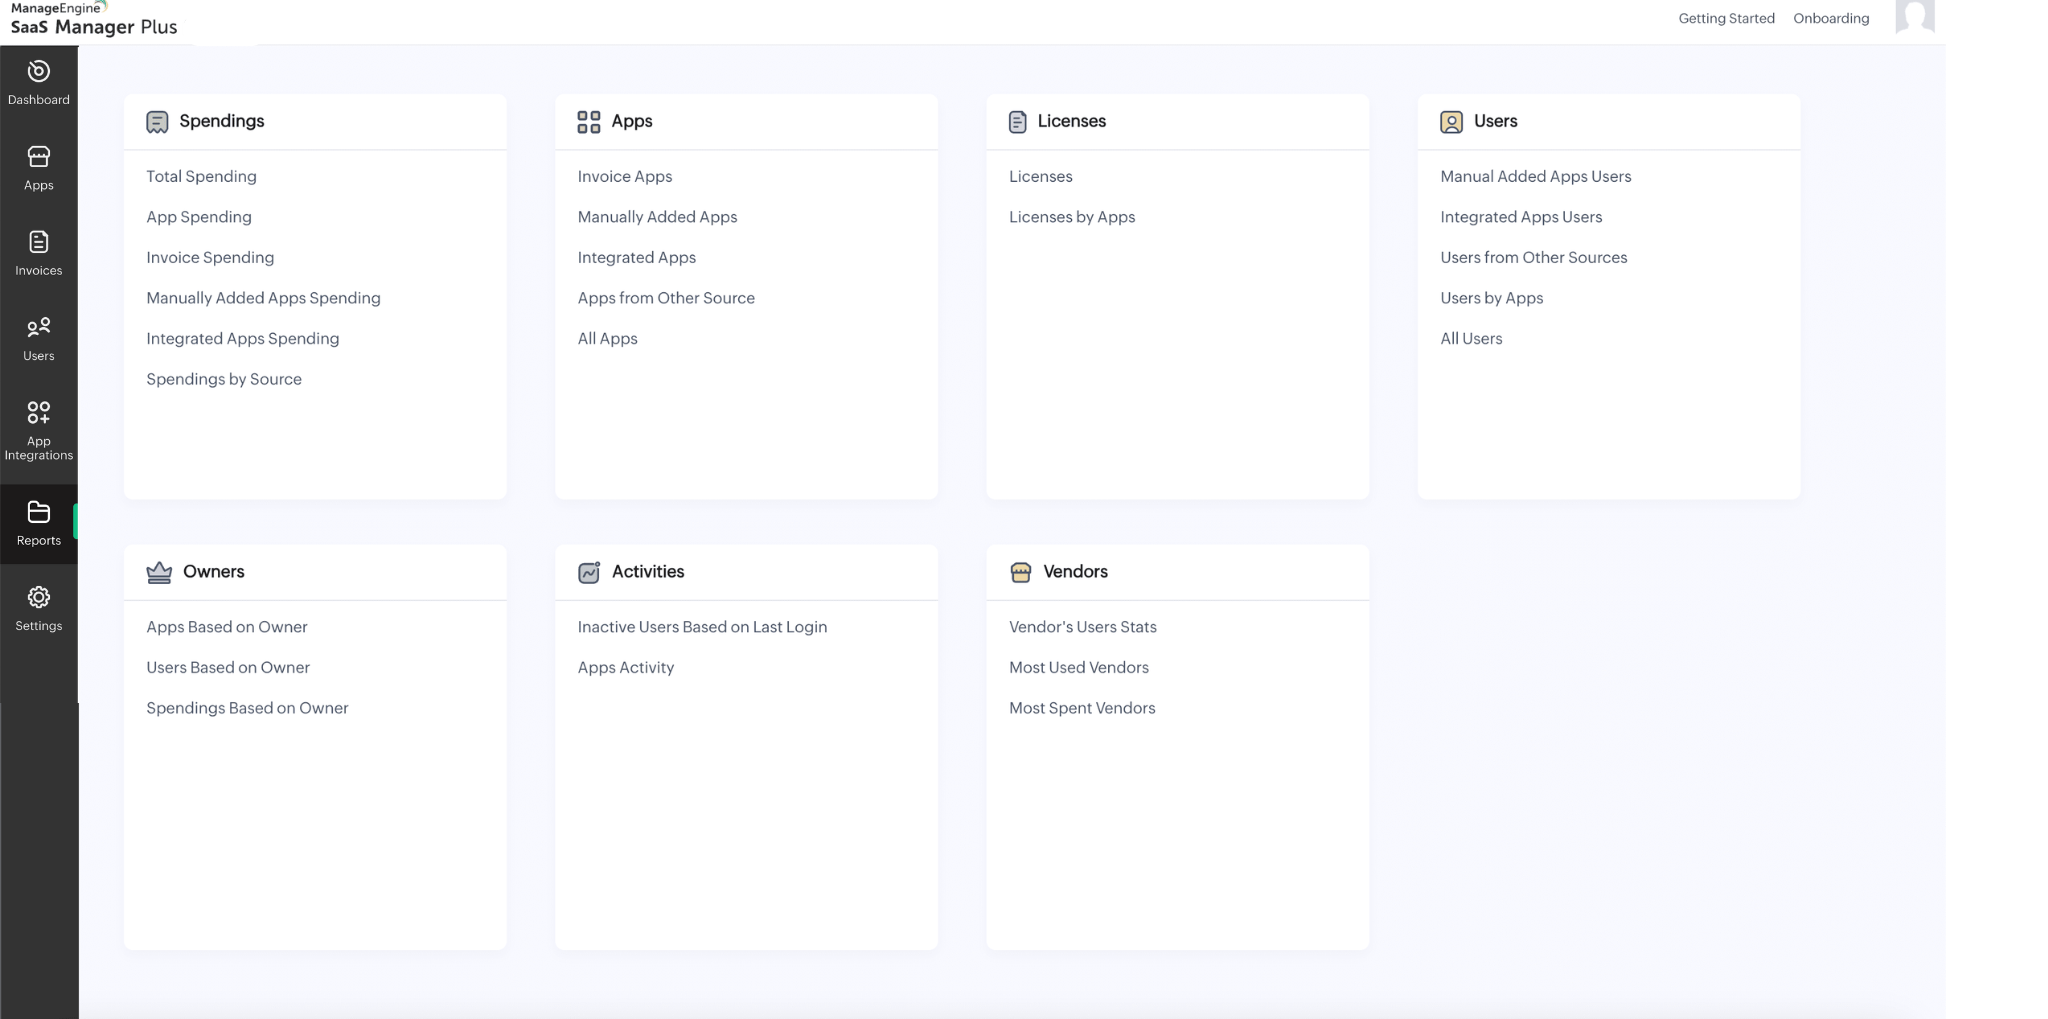
The reporting module offers a range of reports to help you analyze spending, user statistics, activity, and more. Each report provides specific information to assist you in making data-driven decisions and optimizing your processes.
Spendings
a. Total Spending
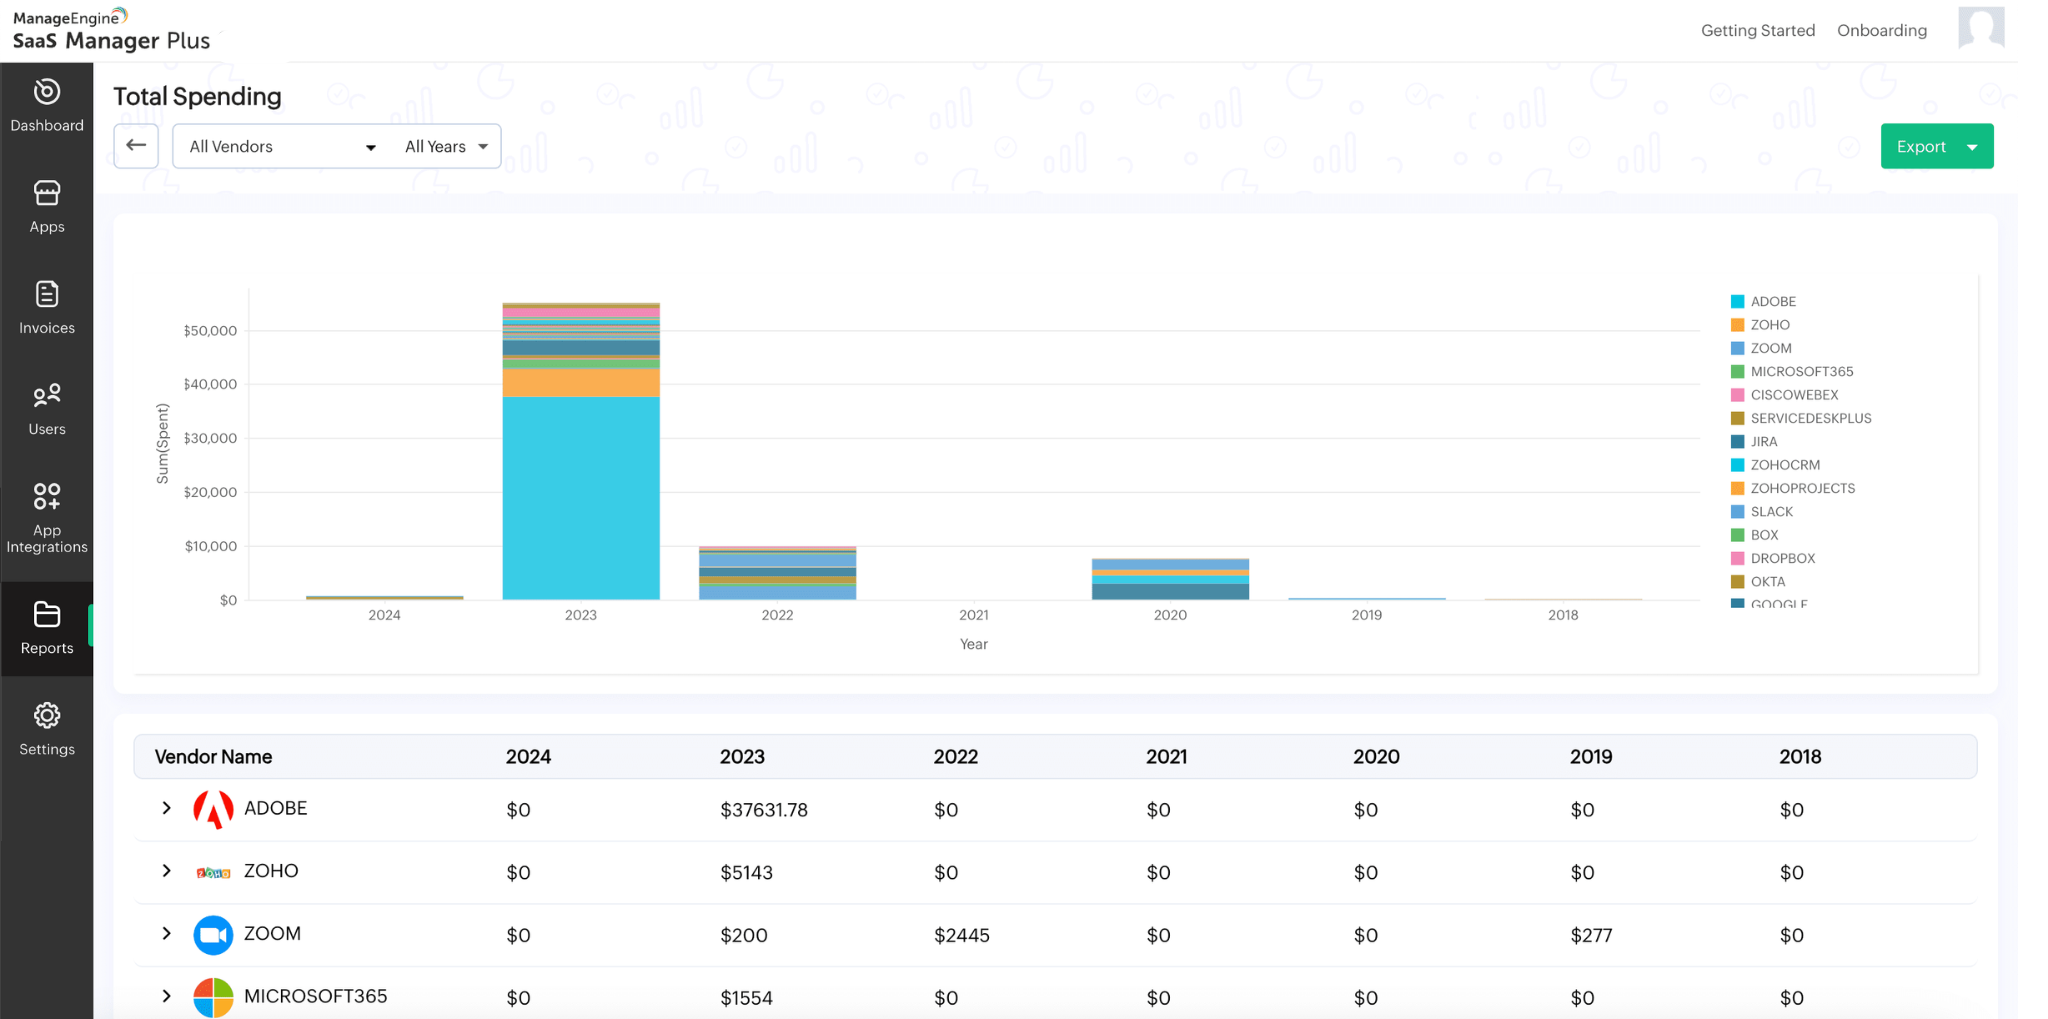
The Total Spending offers a comprehensive overview of spending patterns associated with different vendors. This report displays a breakdown of expenses each vendor incurred over a selected period. It includes the vendor name and spending data for each year. In the top-left corner, you will find two drop-down boxes: one for selecting vendors and another for choosing the desired year.
An Export button is also available in the top-right corner to export the data as a PDF or CSV file.
b. App Spending
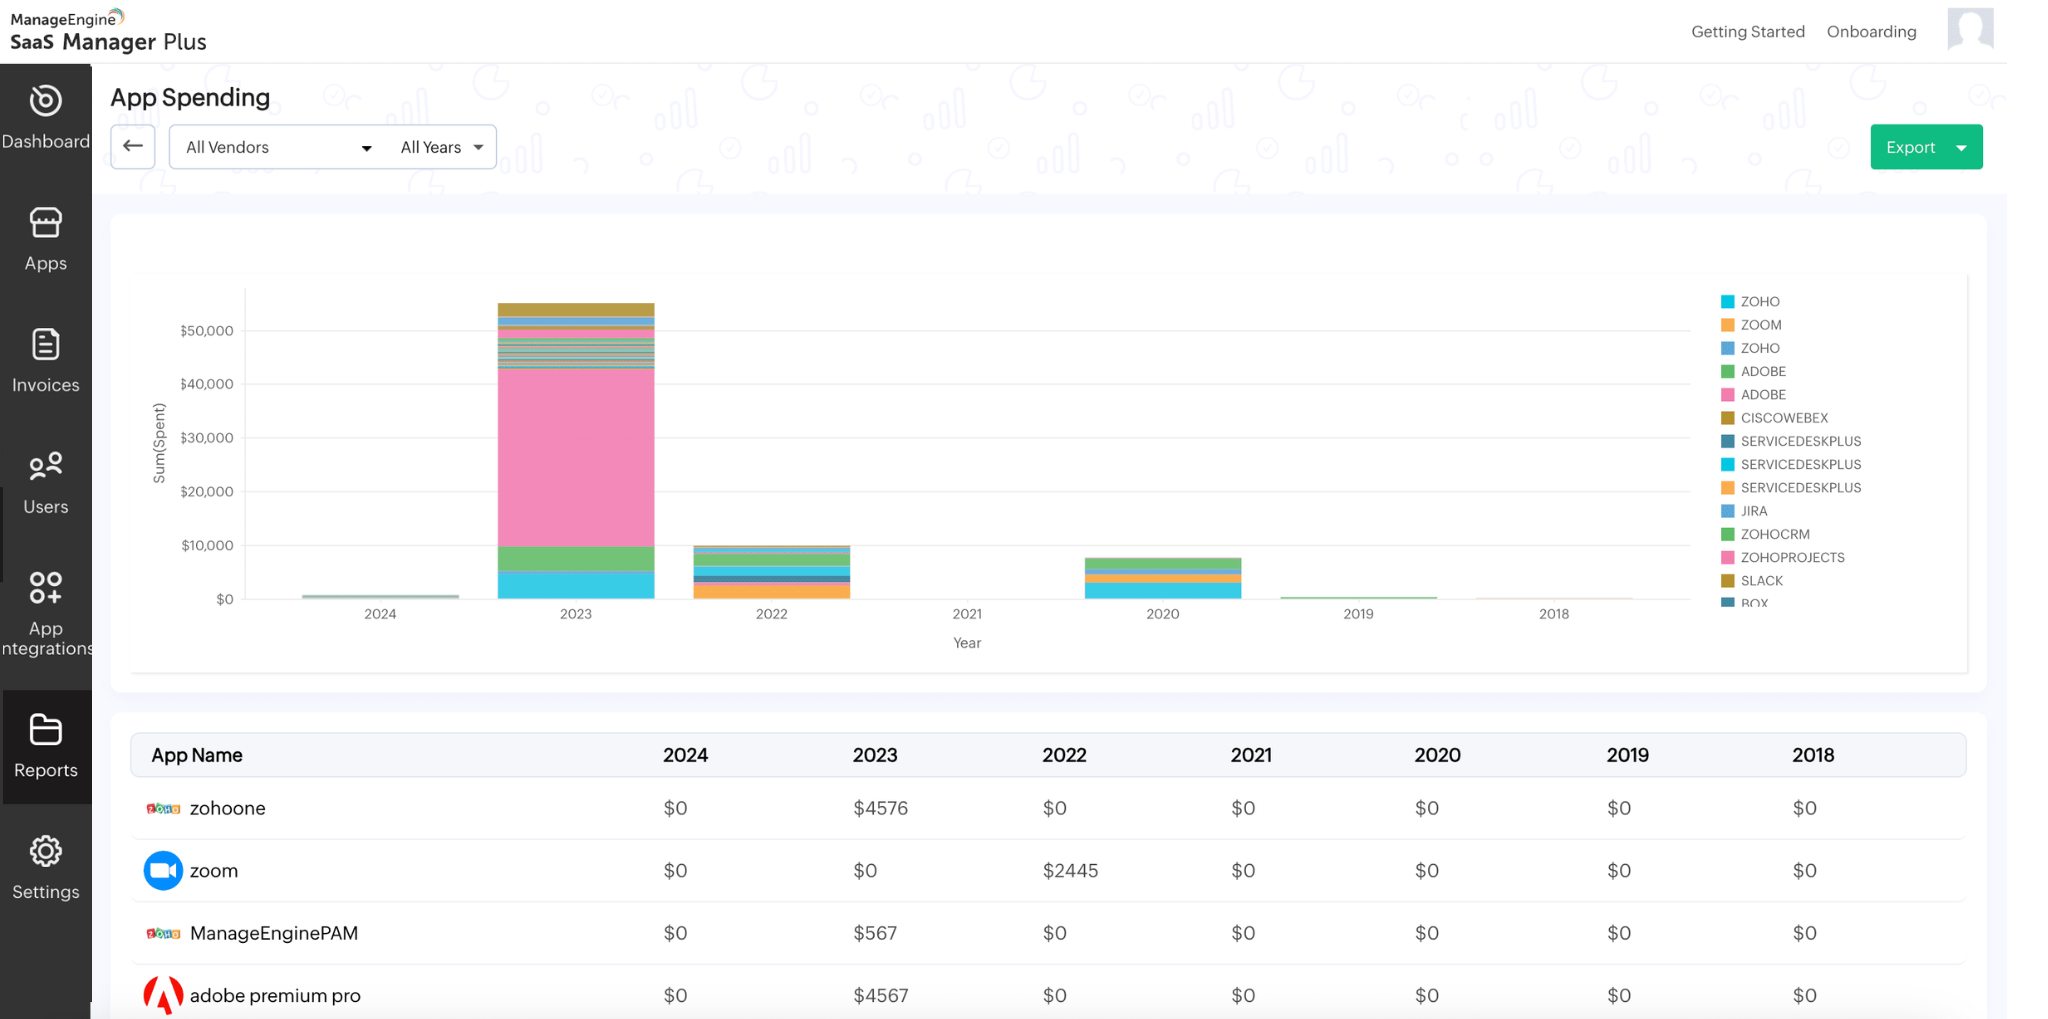
The App Spending offers a comprehensive overview of spending patterns associated with different apps. This report displays a breakdown of expenses each app incurred over a selected period. It includes the app name and spending data for each year. In the top-left corner, you will find two drop-down boxes: one for selecting vendors and another for choosing the desired year.
An Export button is also available in the top-right corner to export the data as a PDF or CSV file.
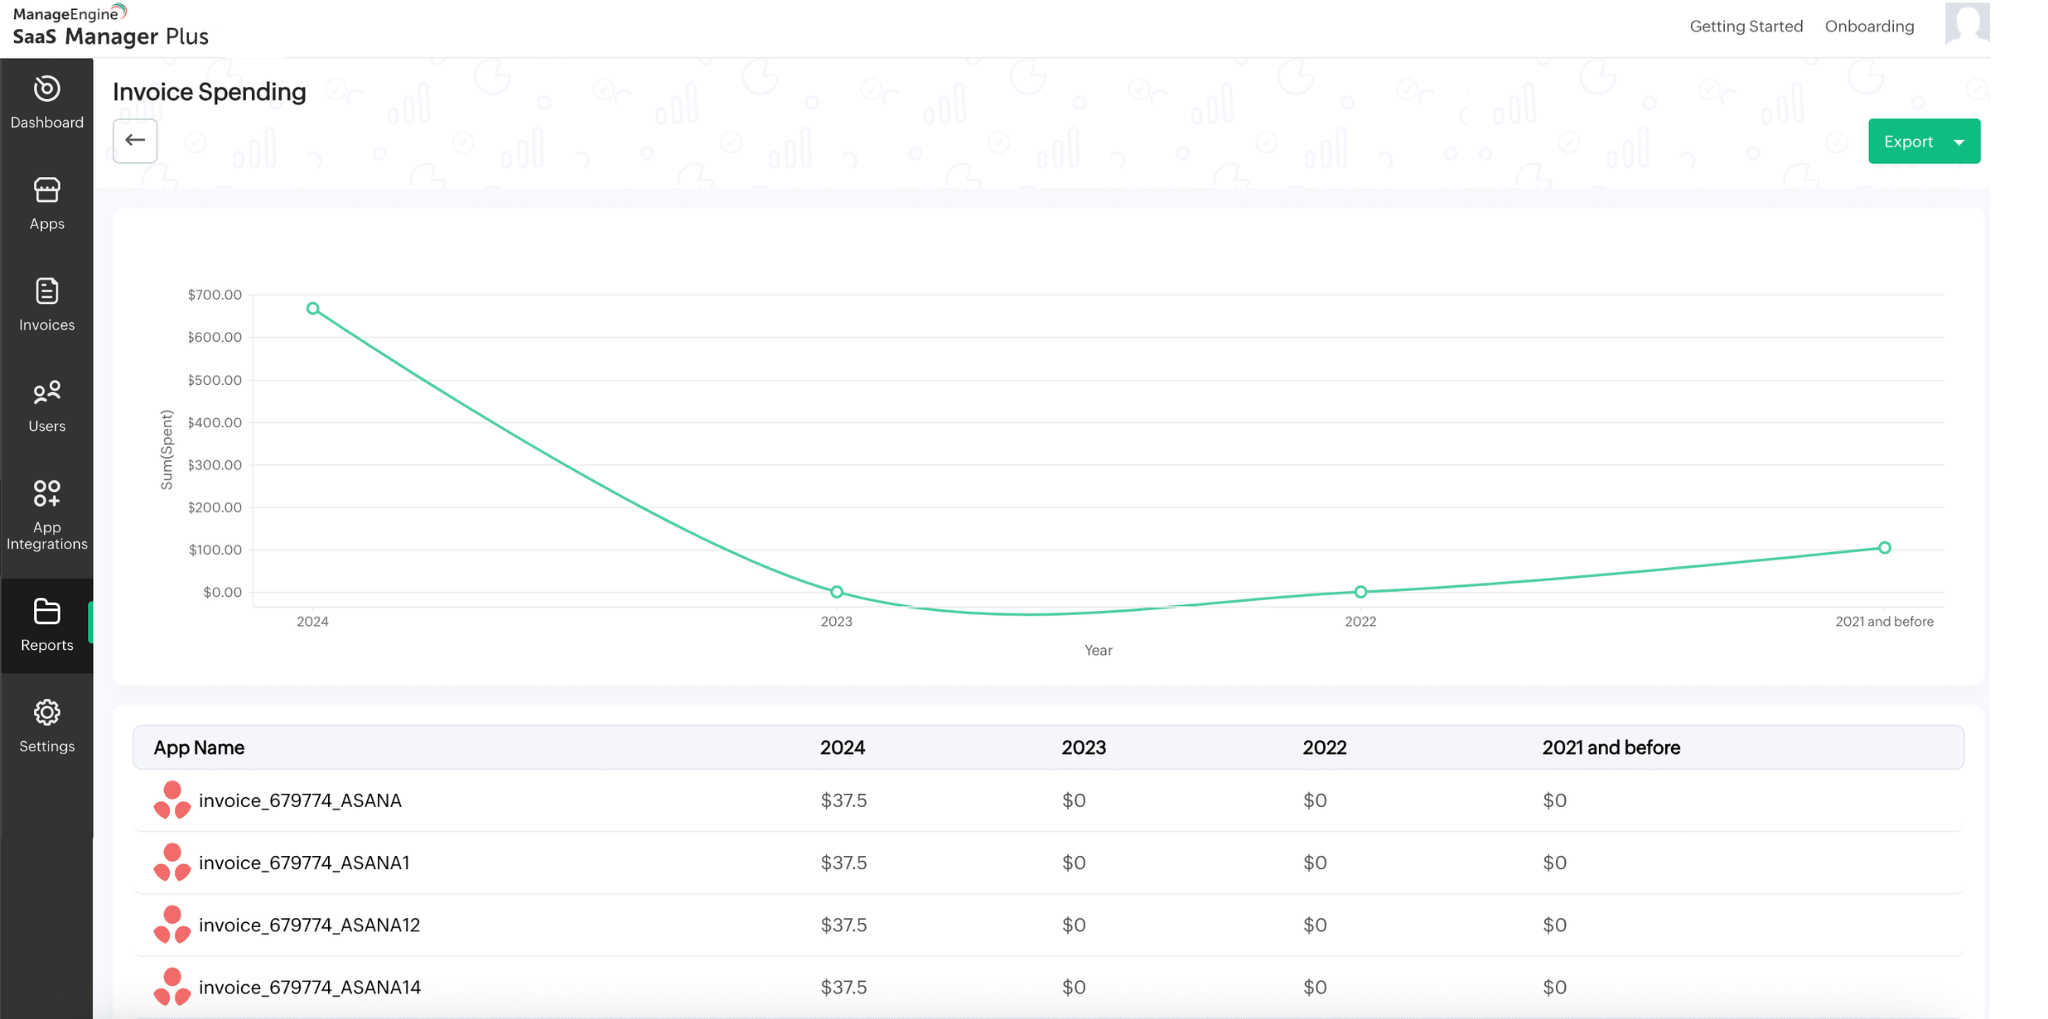
c. Invoice Spending
The Invoice Spending offers an overall spending pattern associated with all the invoices. This report displays a breakdown of total expenses incurred across years.
An Export button is also available in the top-right corner to export the data as a PDF or CSV file.
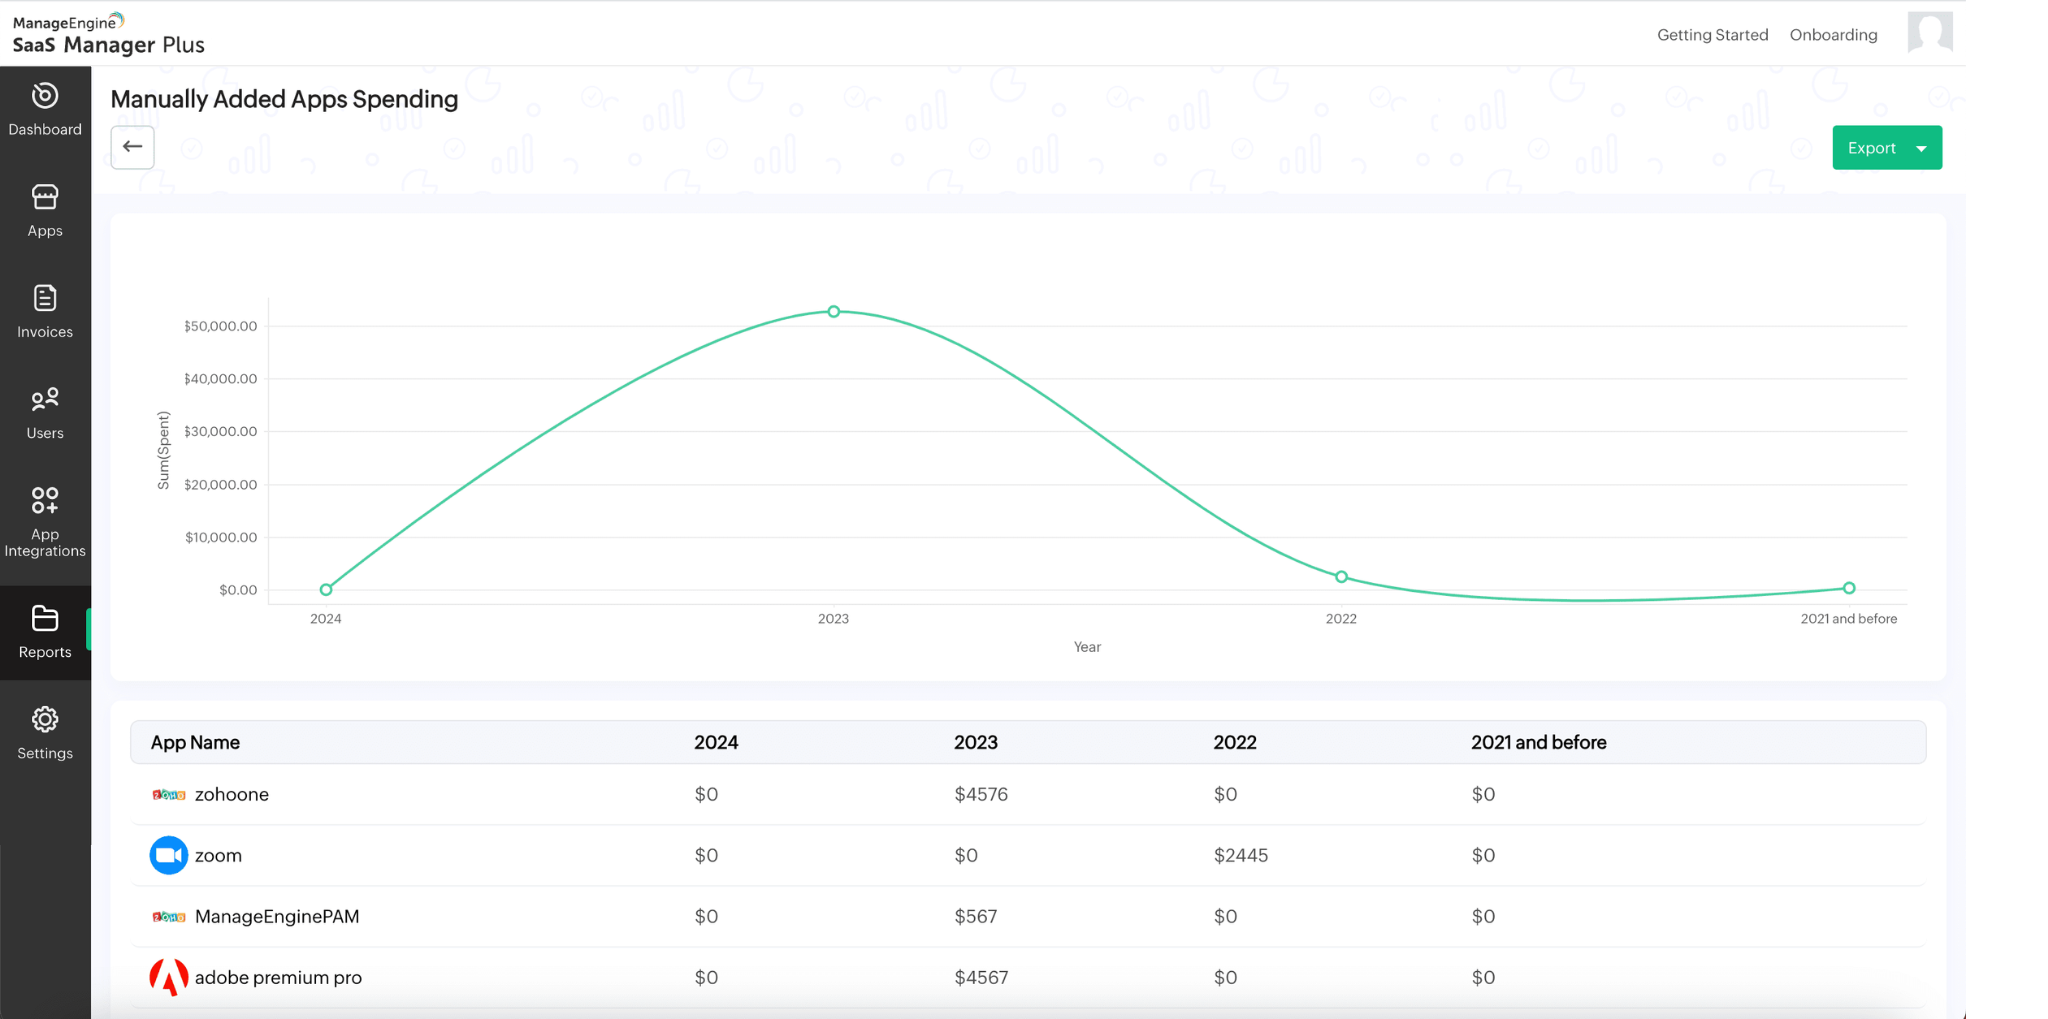
d. Manually Added Apps Spending
The Manually Added Apps Spending offers an overall spending pattern associated with all the manually added apps. This report displays a breakdown of total expenses of manually added apps incurred across years.
An Export button is also available in the top-right corner to export the data as a PDF or CSV file.
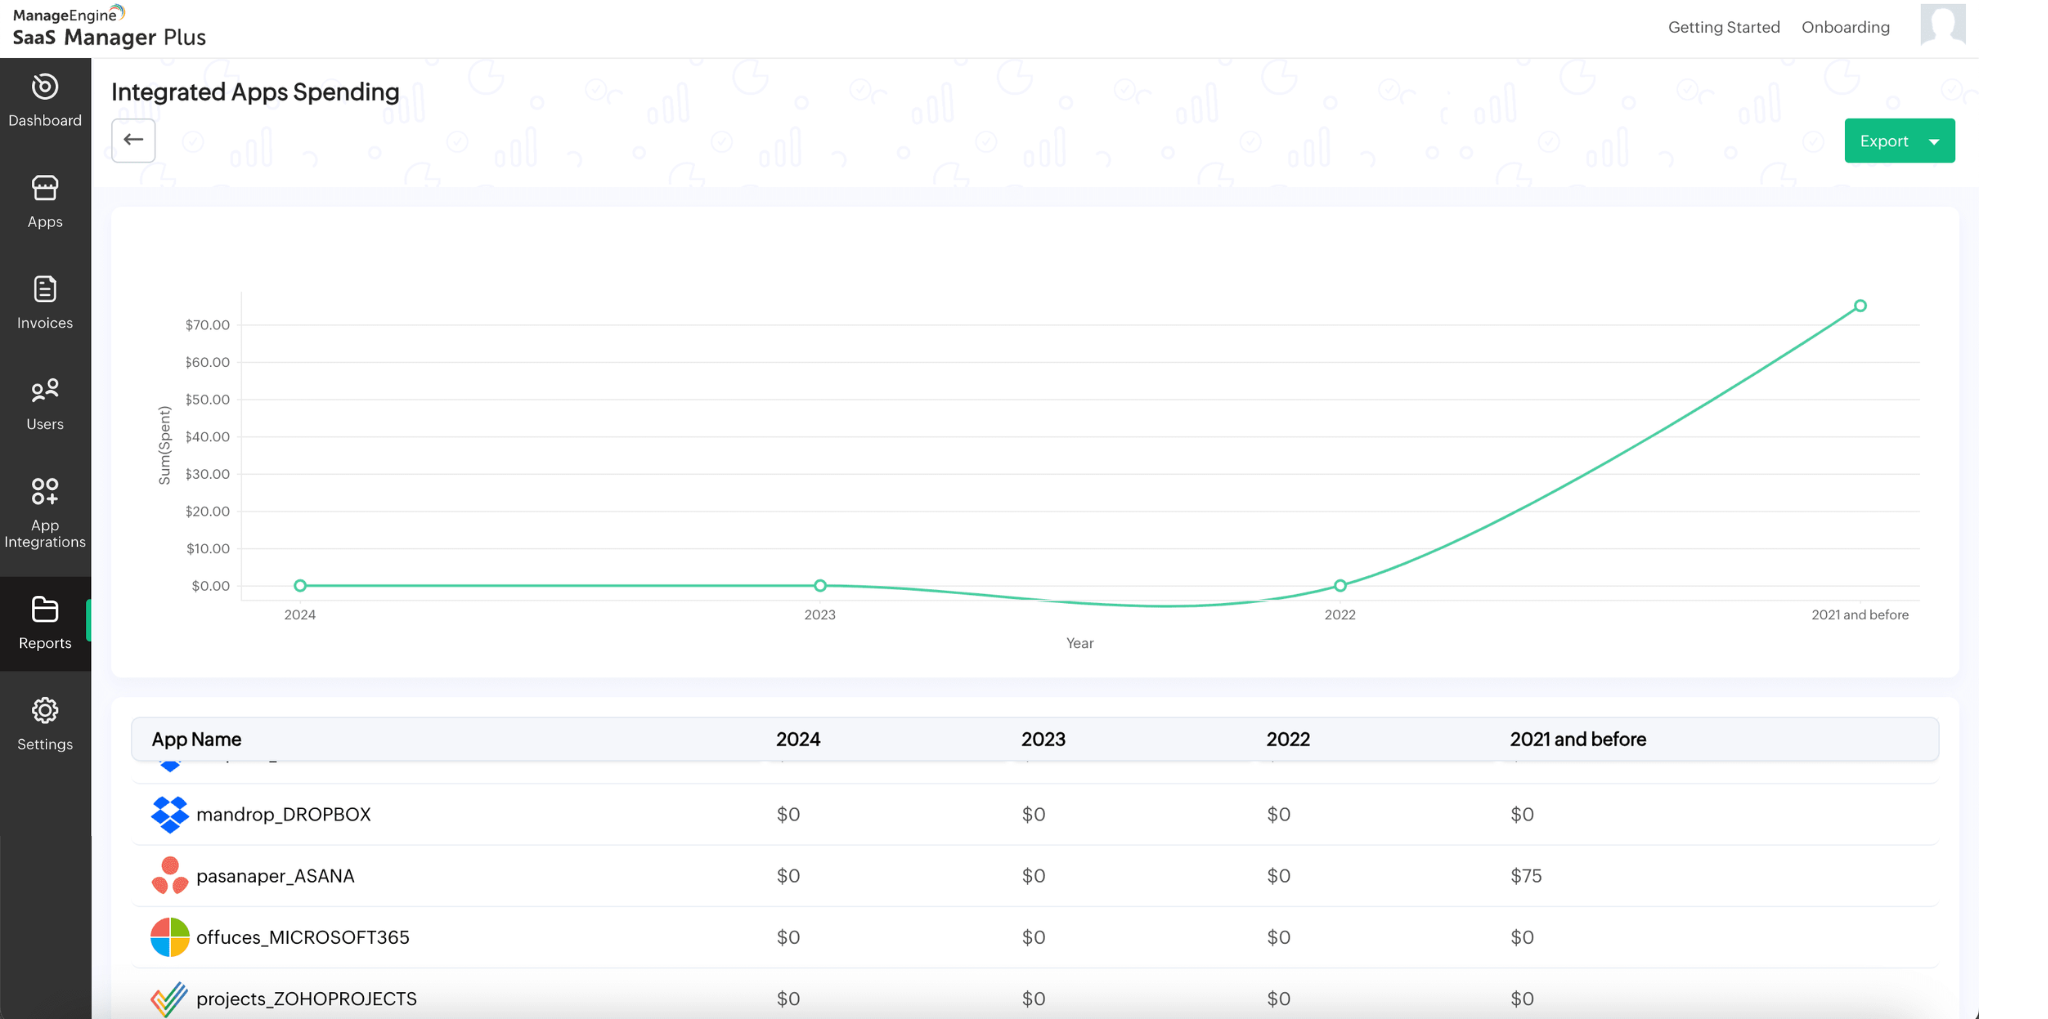
e. Integrated Apps Spending
The Integrated Apps Spending offers an overall spending pattern associated with all the integrated apps. This report displays a breakdown of total expenses of integrated apps incurred across years.
An Export button is also available in the top-right corner to export the data as a PDF or CSV file.
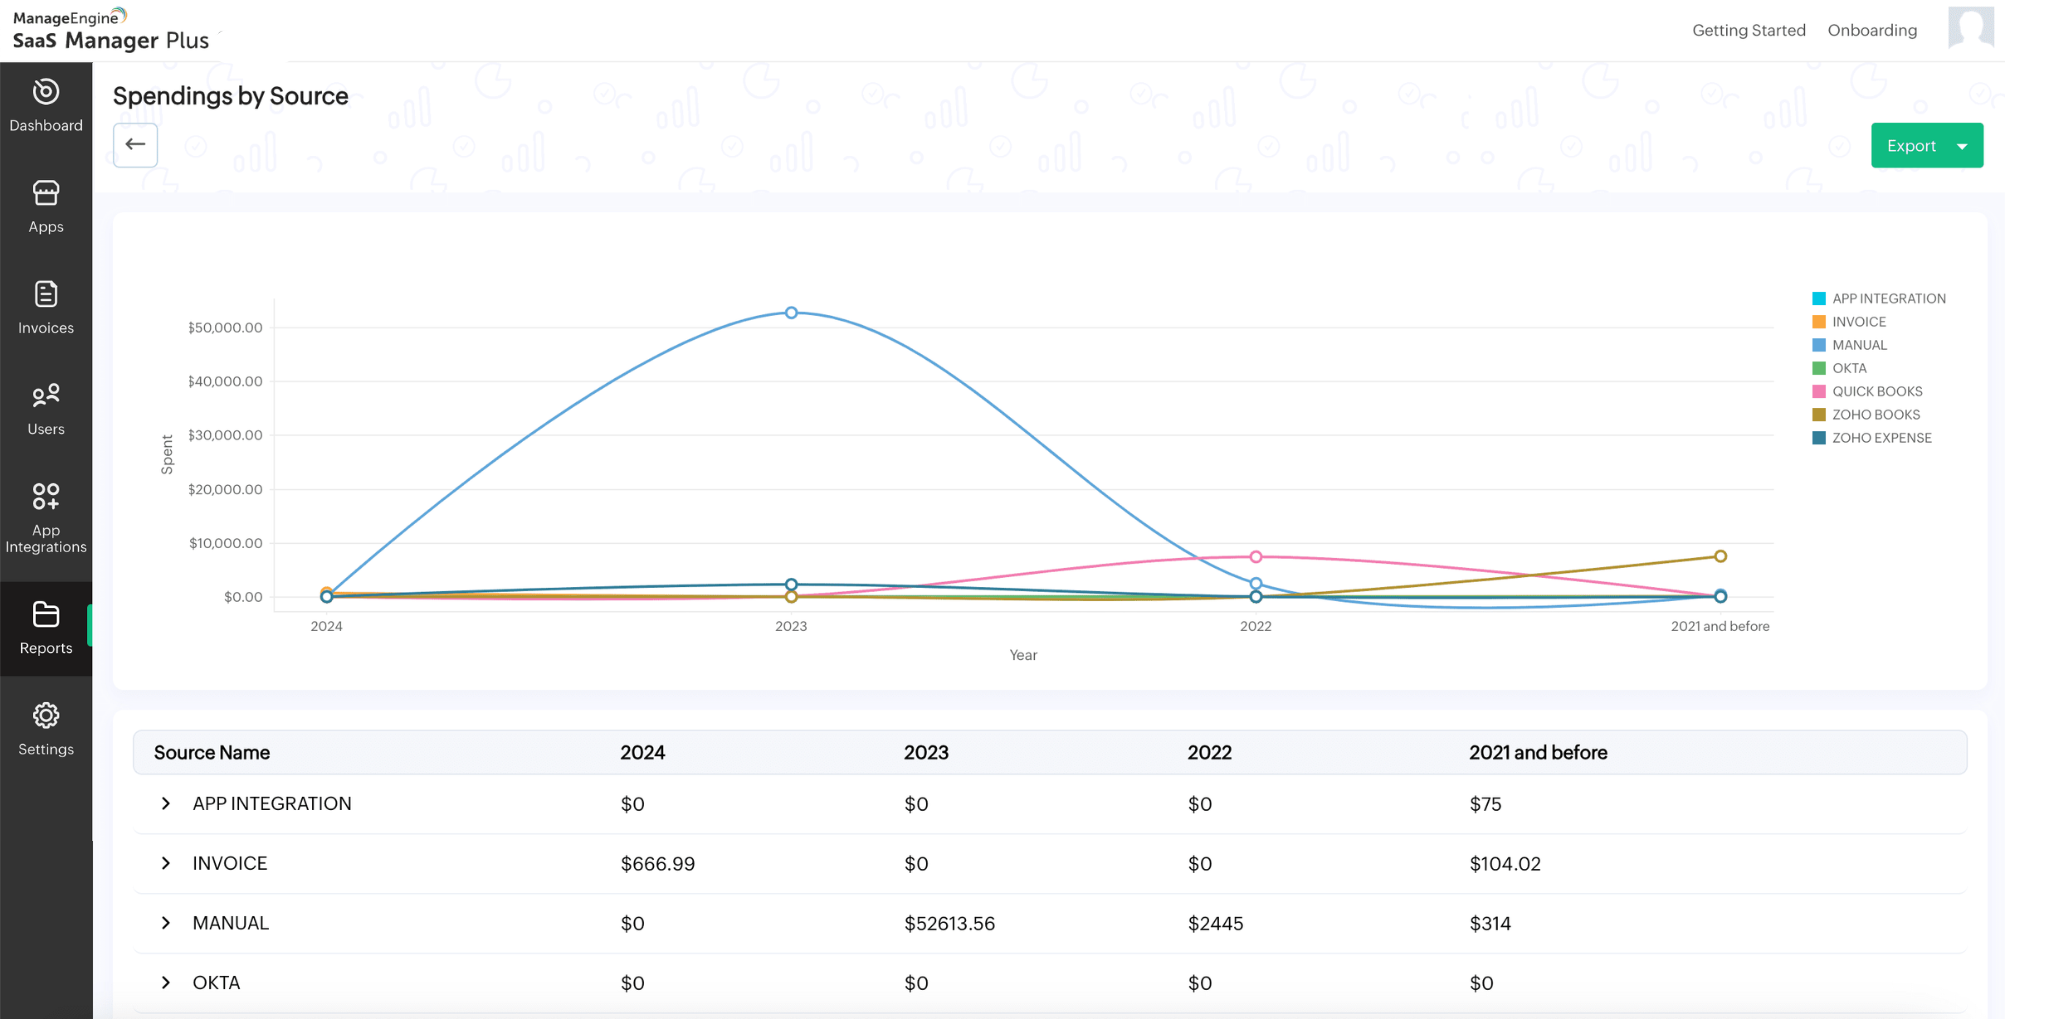
f. Spendings by Sources
The Spendings by Sources offers an overall spending pattern based on the source of the apps. This report displays a breakdown of total expenses of all the apps from different sources incurred across years.
An Export button is also available in the top-right corner to export the data as a PDF or CSV file.
Apps
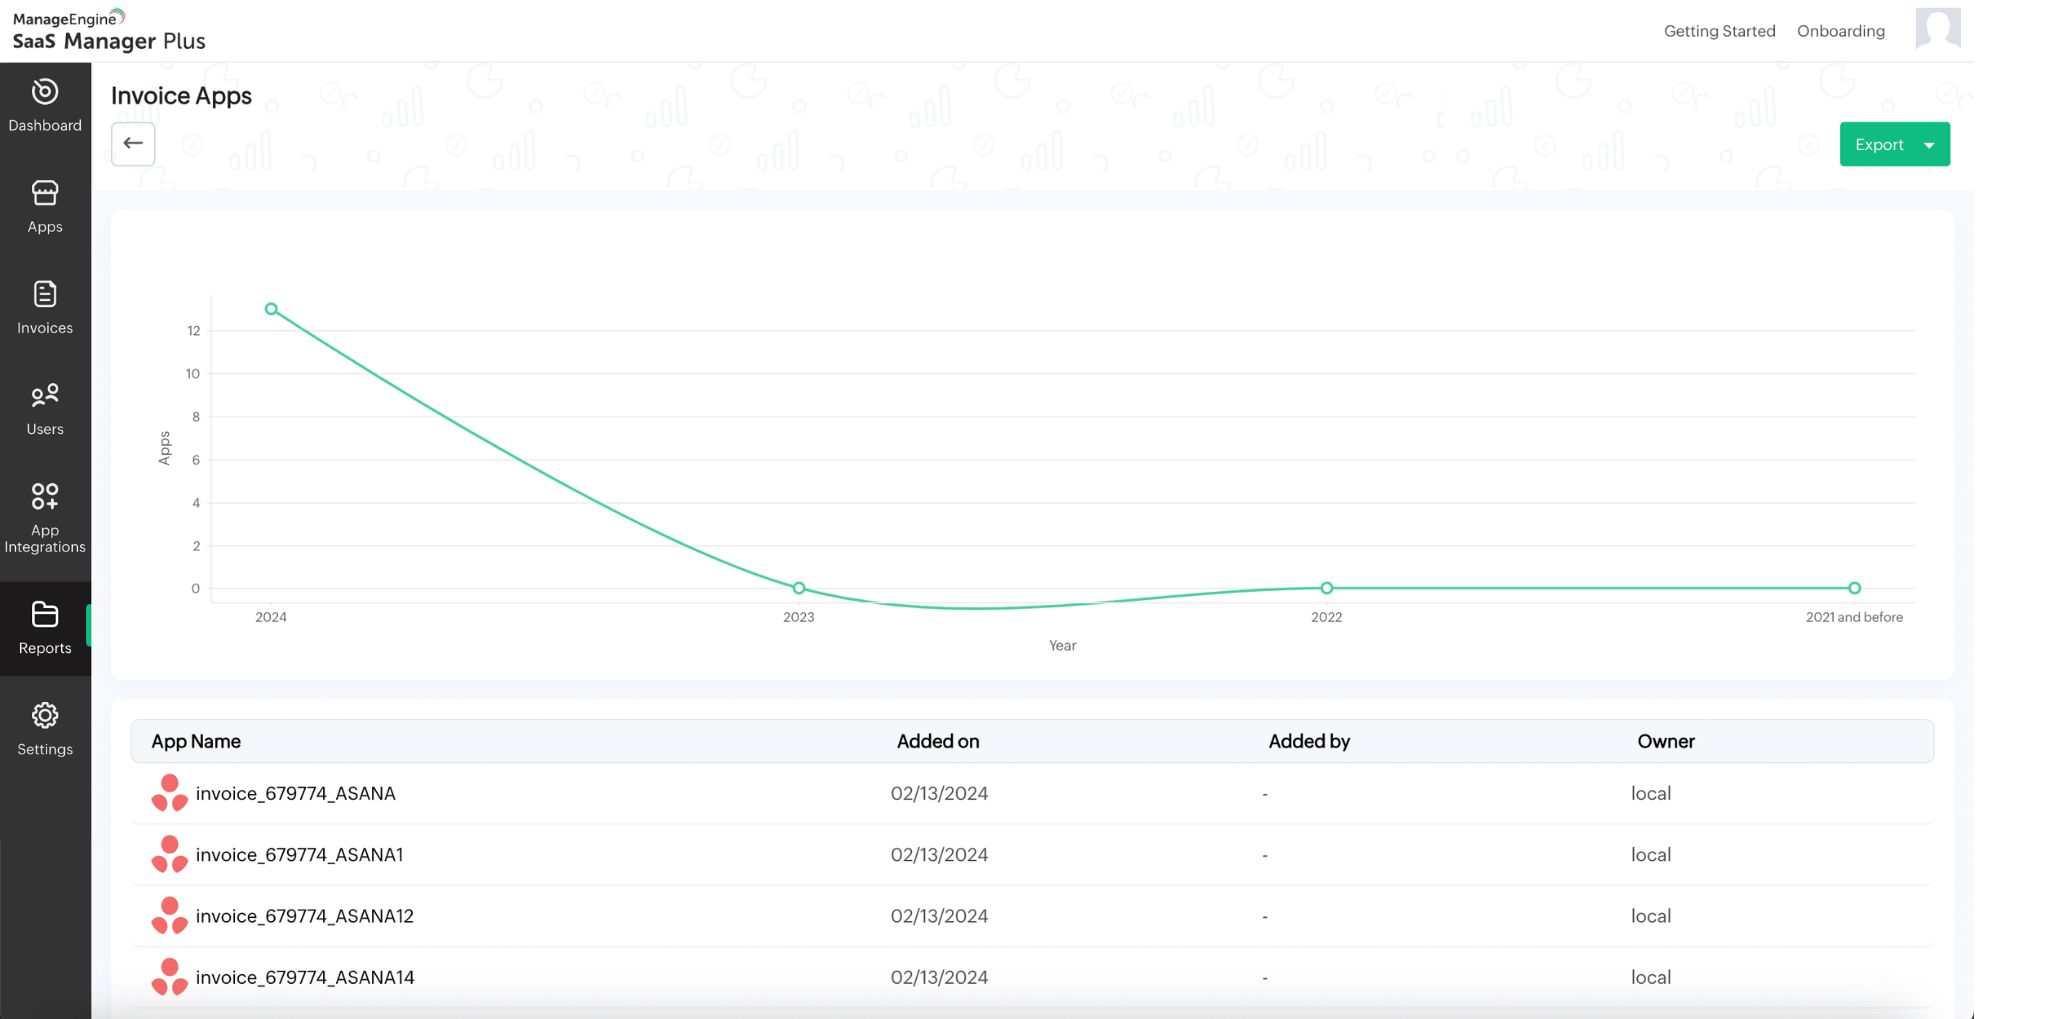
a. Invoice Apps
The Invoice Apps displays all the apps added through invoices across years.
An Export button is also available in the top-right corner to export the data as a PDF or CSV file.
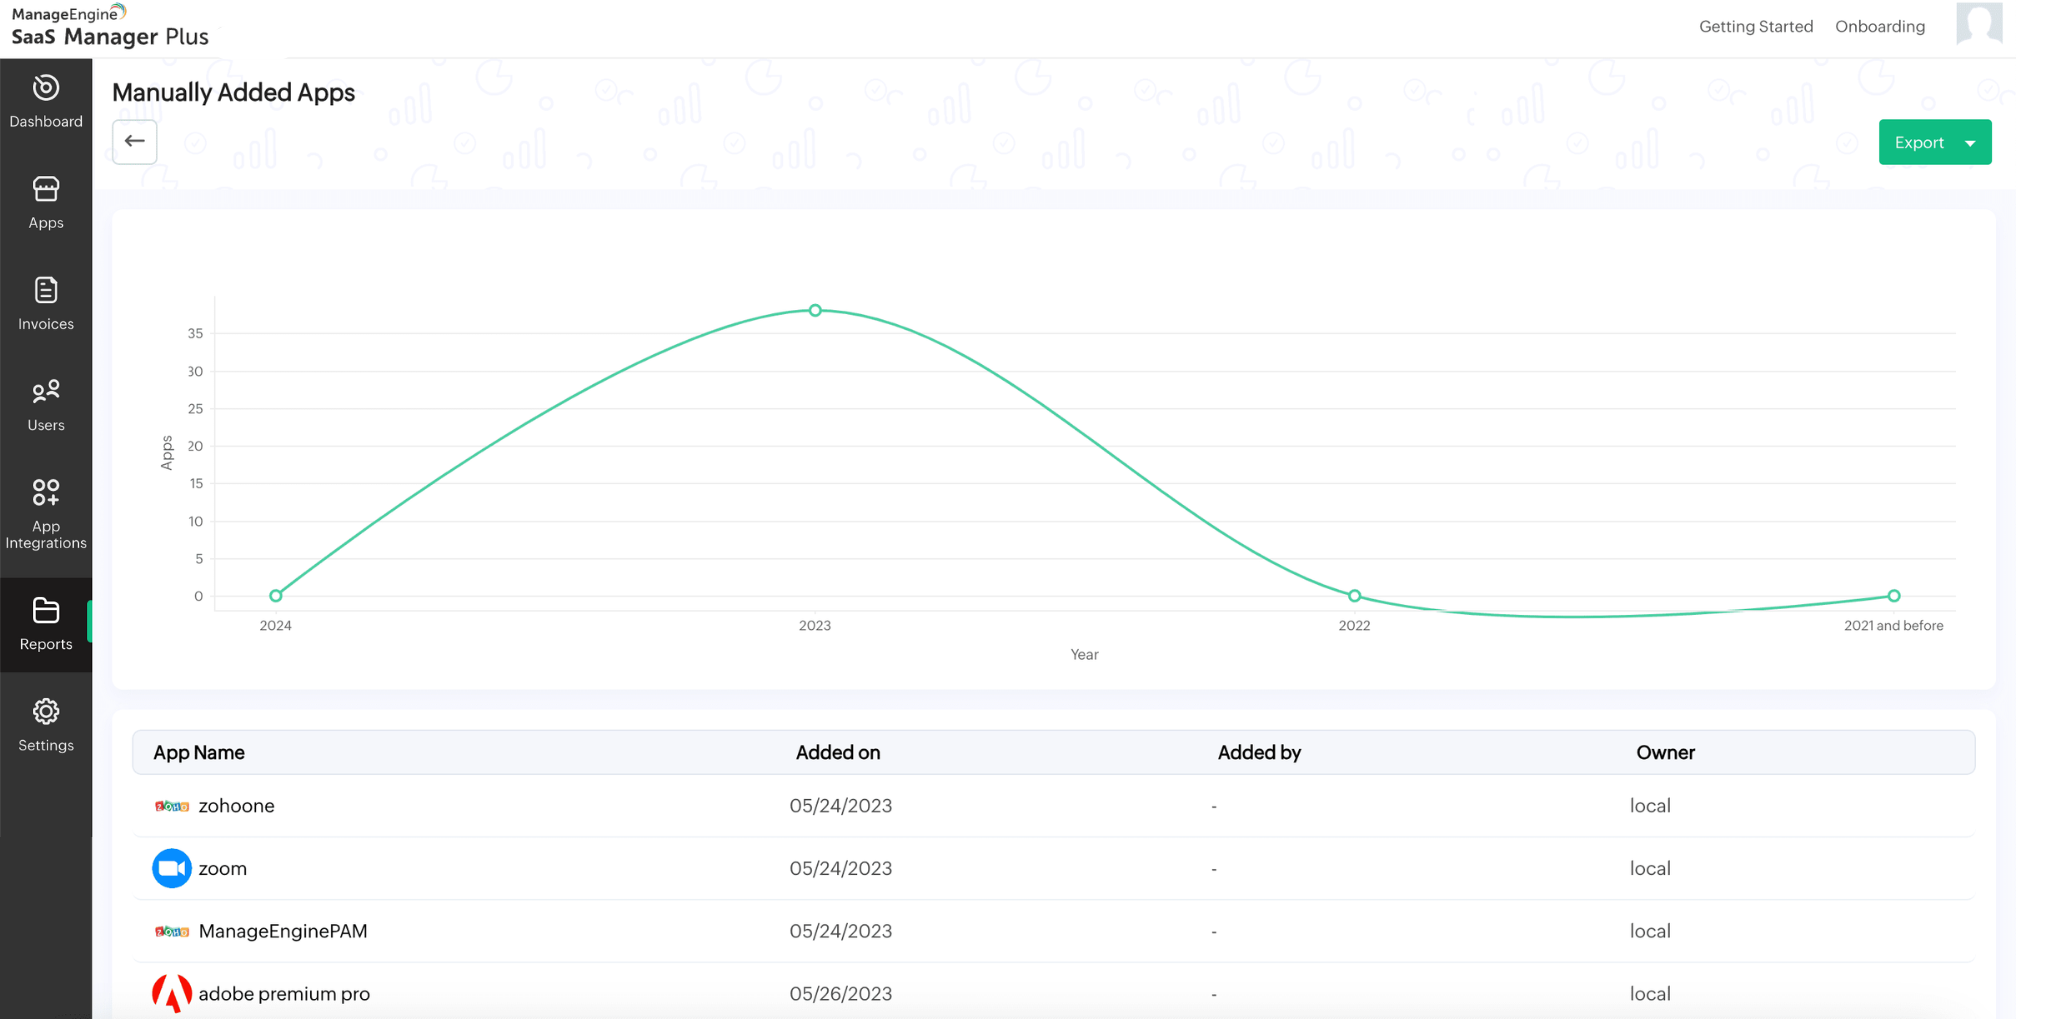
b. Manually Added Apps
The Manually Added Apps displays all the apps added manually across years.
An Export button is also available in the top-right corner to export the data as a PDF or CSV file.
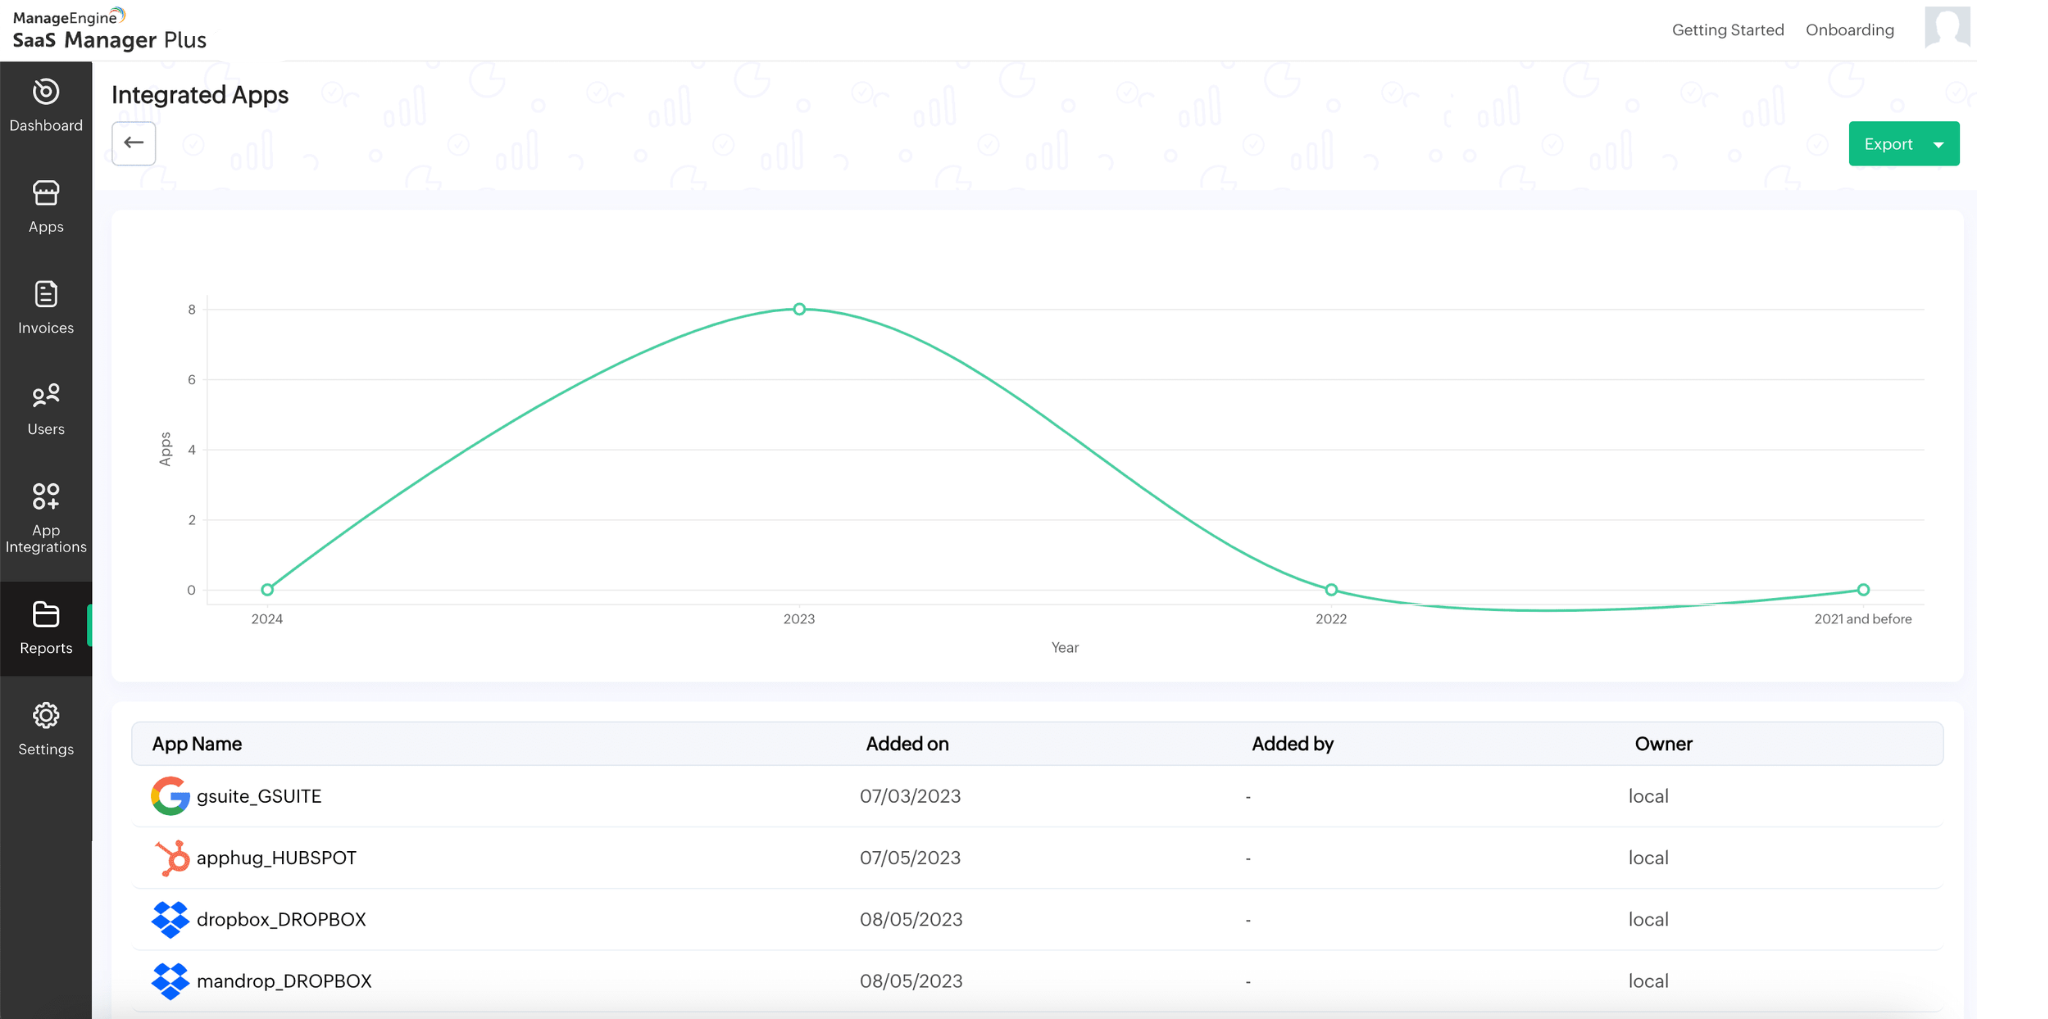
c. Integrated Apps
The Integrated Apps displays all the apps added through integrations across years.
An Export button is also available in the top-right corner to export the data as a PDF or CSV file.
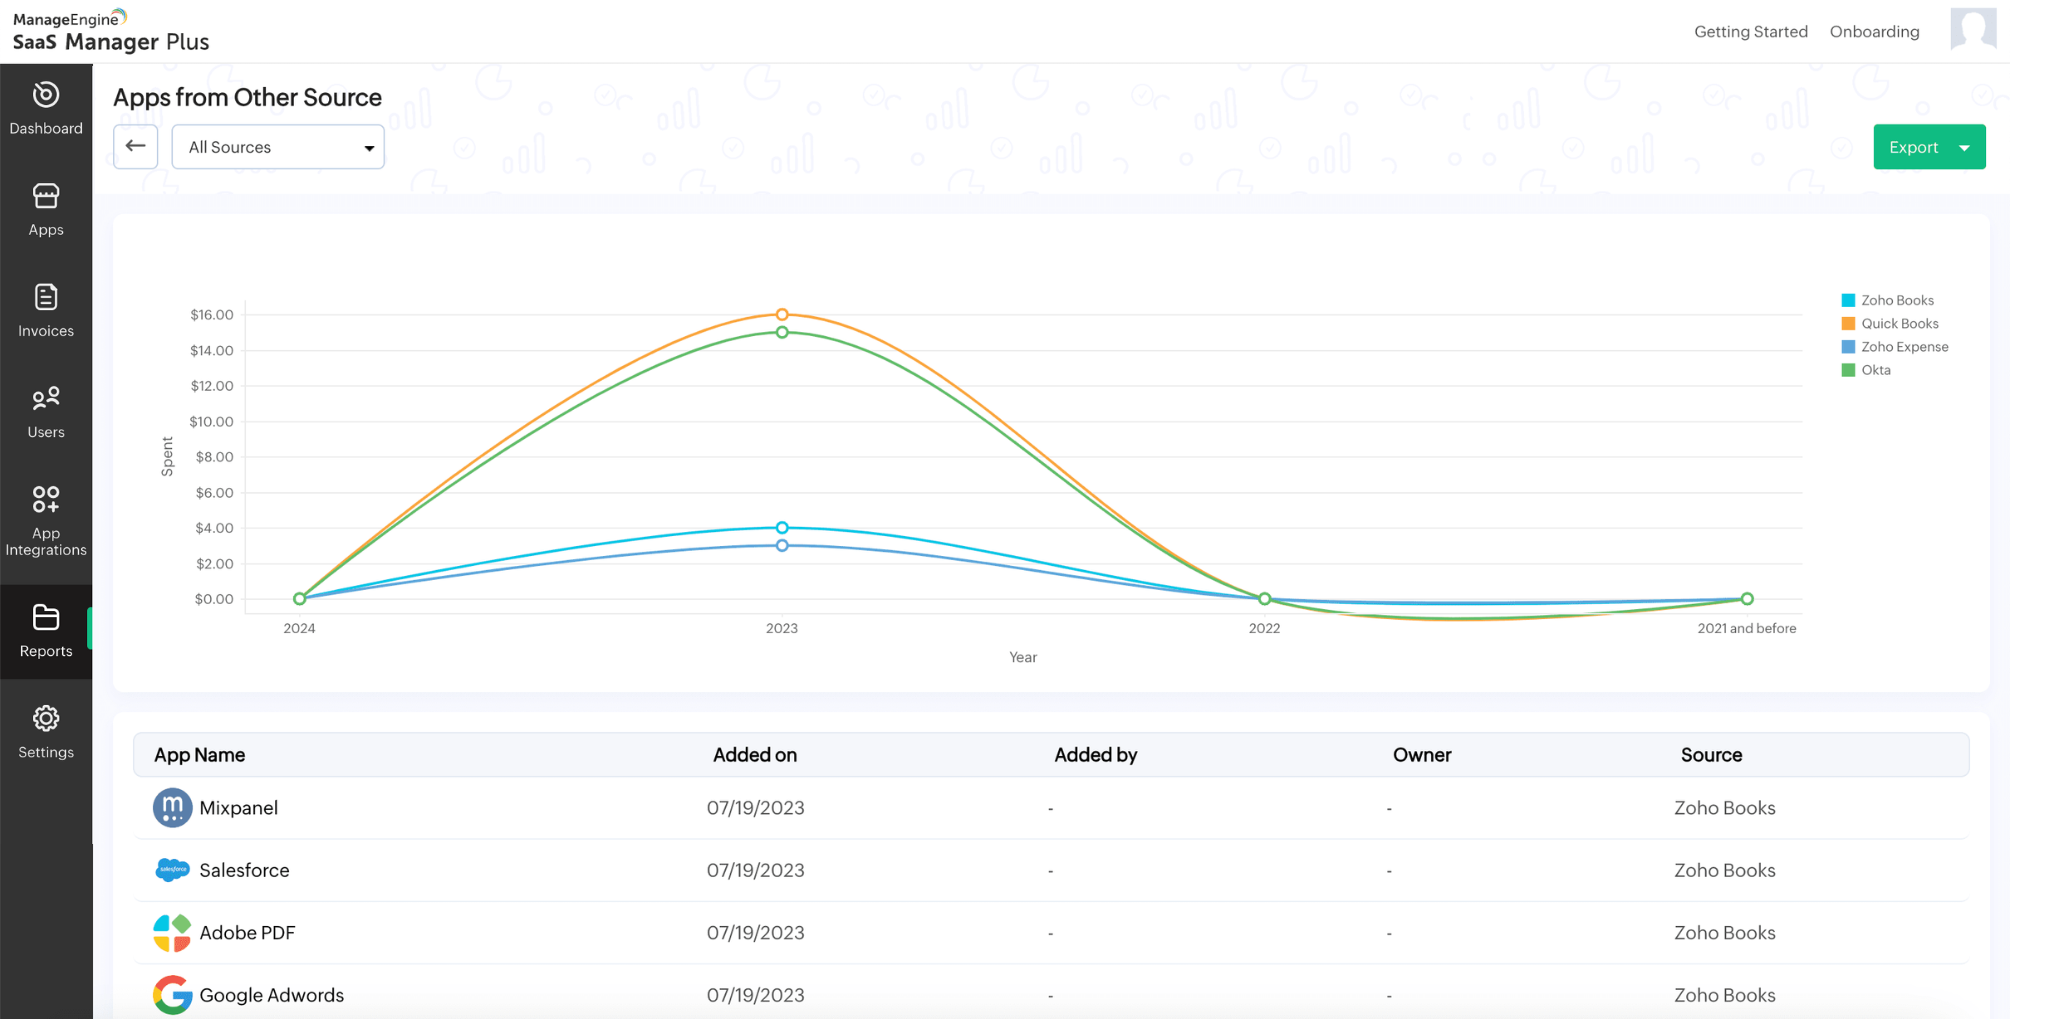
d. Apps from Other Sources
The Apps from Other Sources displays all the apps added from other sources across years.
All Sources drop-down is available in the top-left corner to choose the required source.
An Export button is also available in the top-right corner to export the data as a PDF or CSV file.
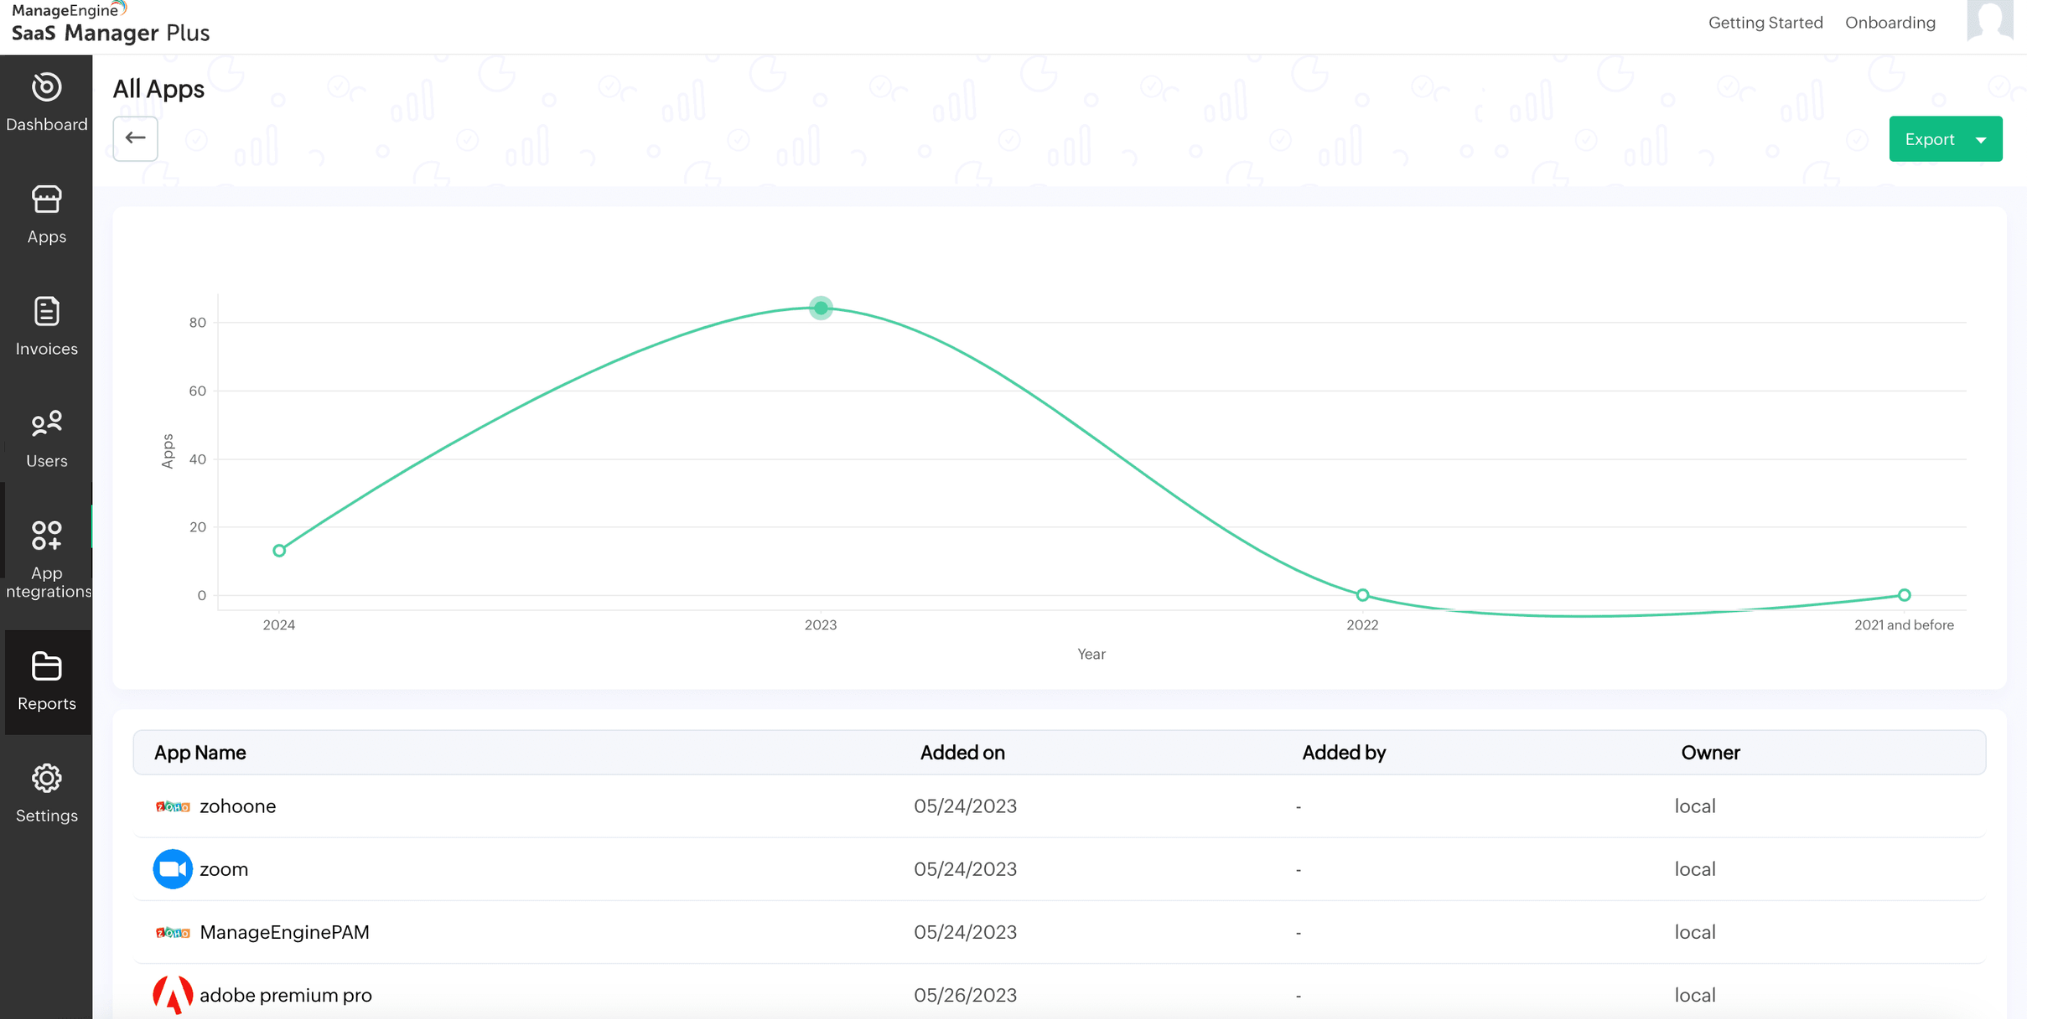
e. All Apps
The All Apps displays all the apps available in SaaS Manager Plus across years.
An Export button is also available in the top-right corner to export the data as a PDF or CSV file.
Licenses
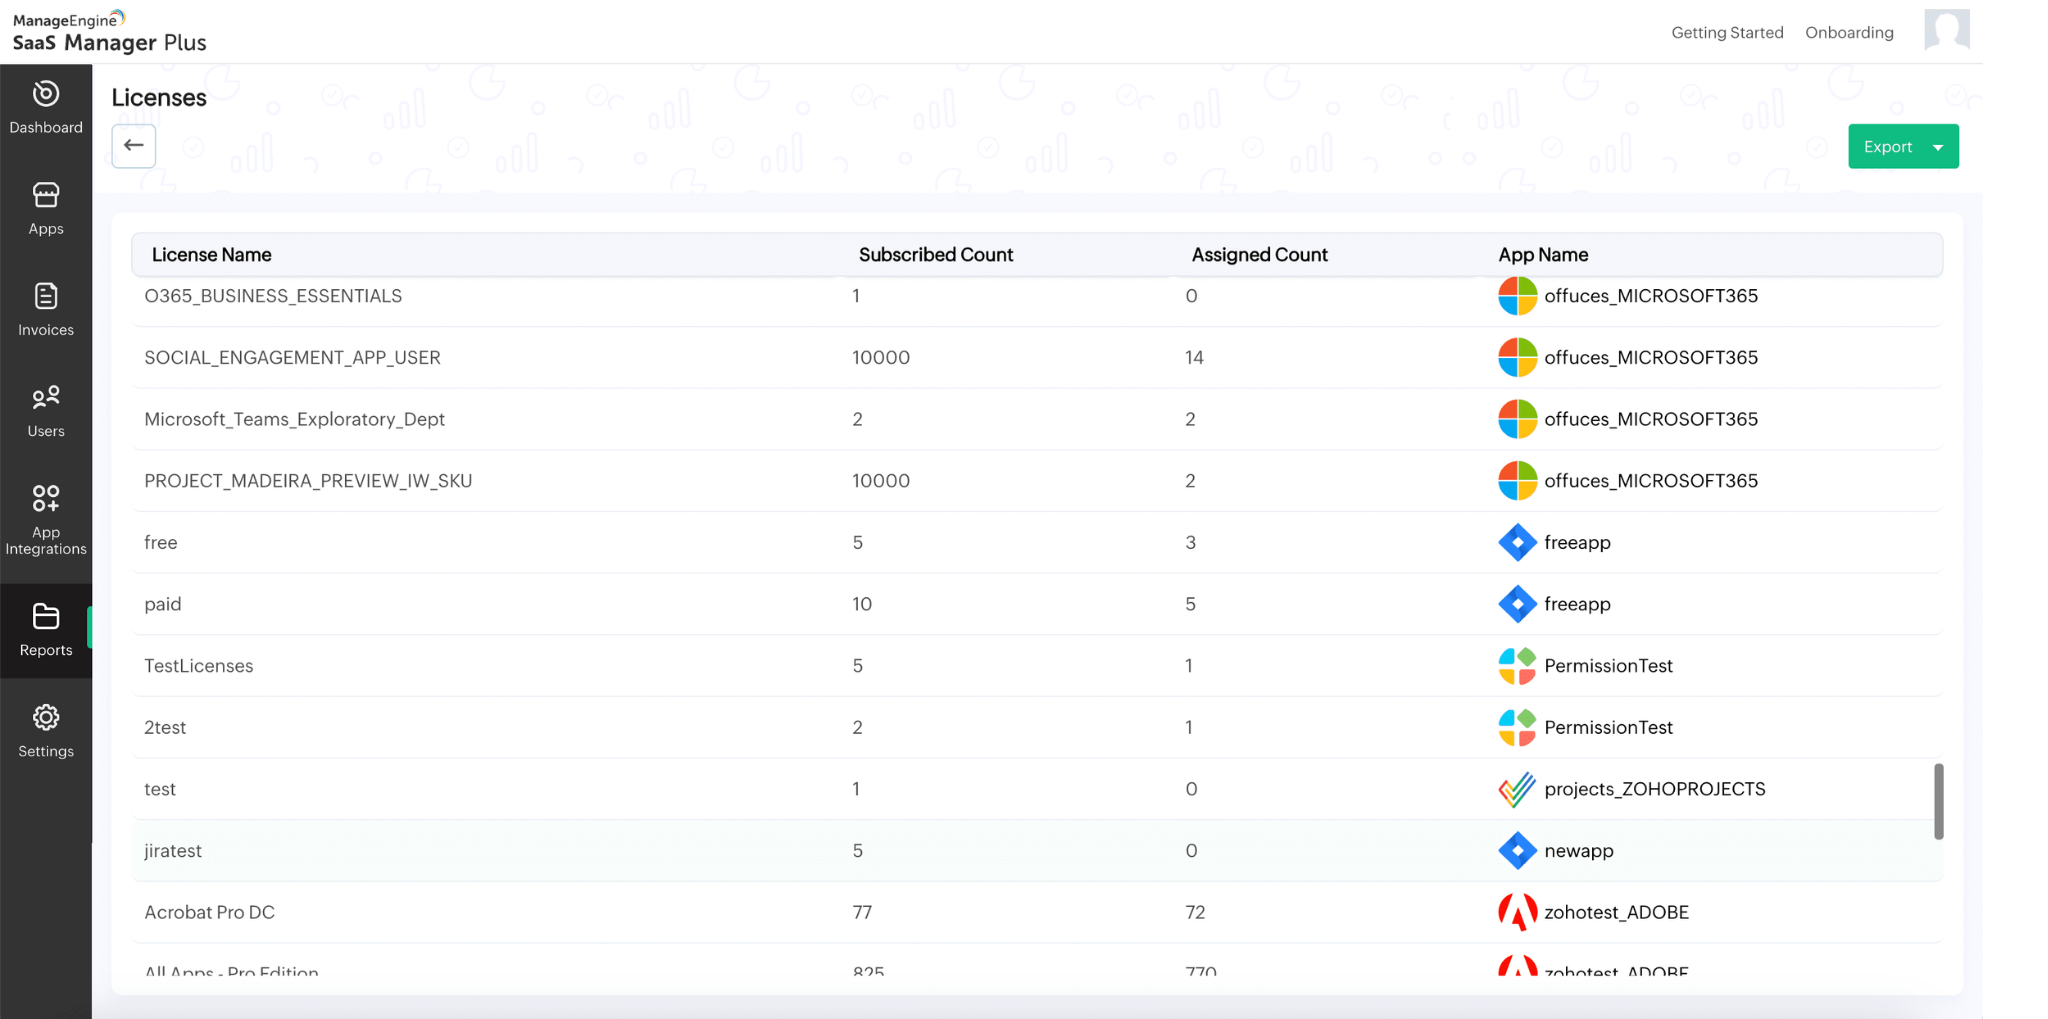
a. Licenses
The Licenses displays the details of all the licenses along with License Name, Subscribed Count, Assigned Count, and App Name.
An Export button is also available in the top-right corner to export the data as a PDF or CSV file.
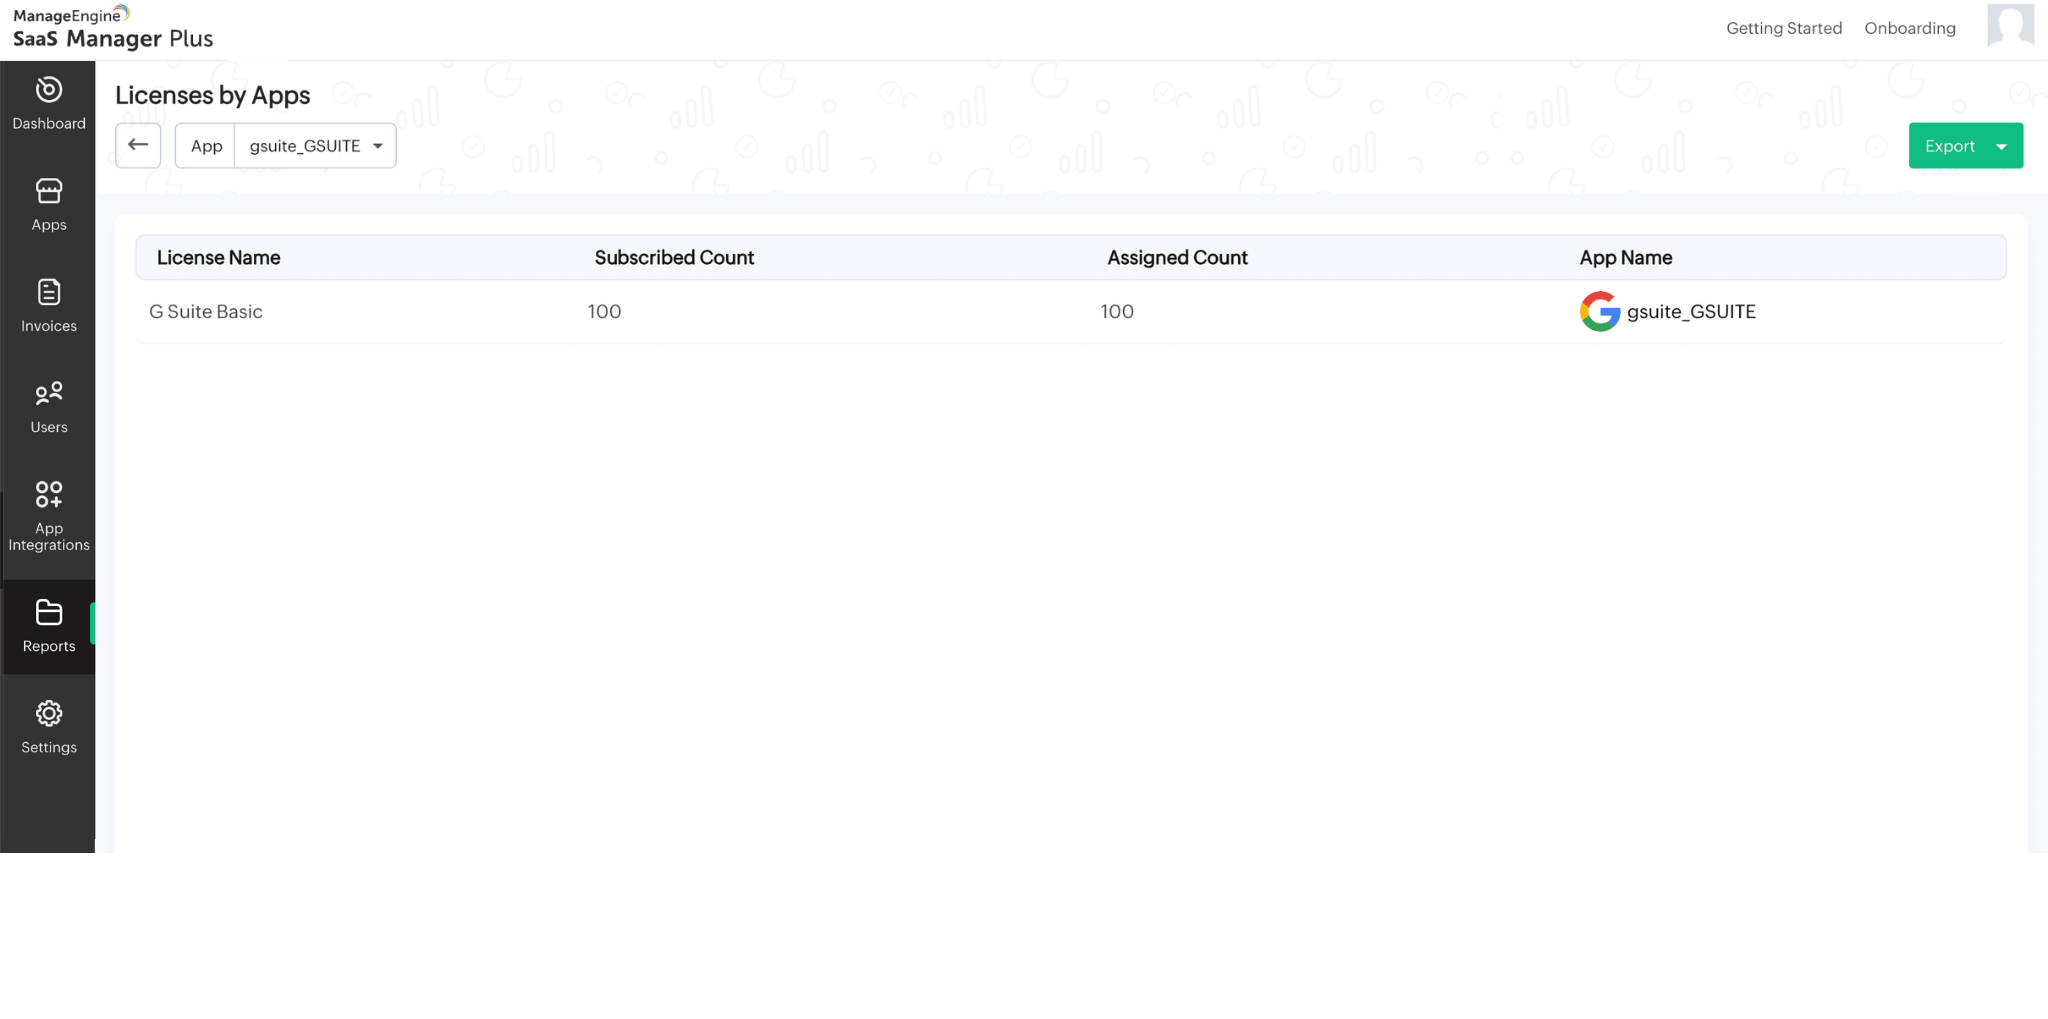
b. Licenses by Apps
The Licenses by Apps displays the license details of one particular application along with License Name, Subscribed Count, Assigned Count, and App Name.
App drop-down is available in the top-left corner to choose the required app. An Export button is also available in the top-right corner to export the data as a PDF or CSV file.
Users
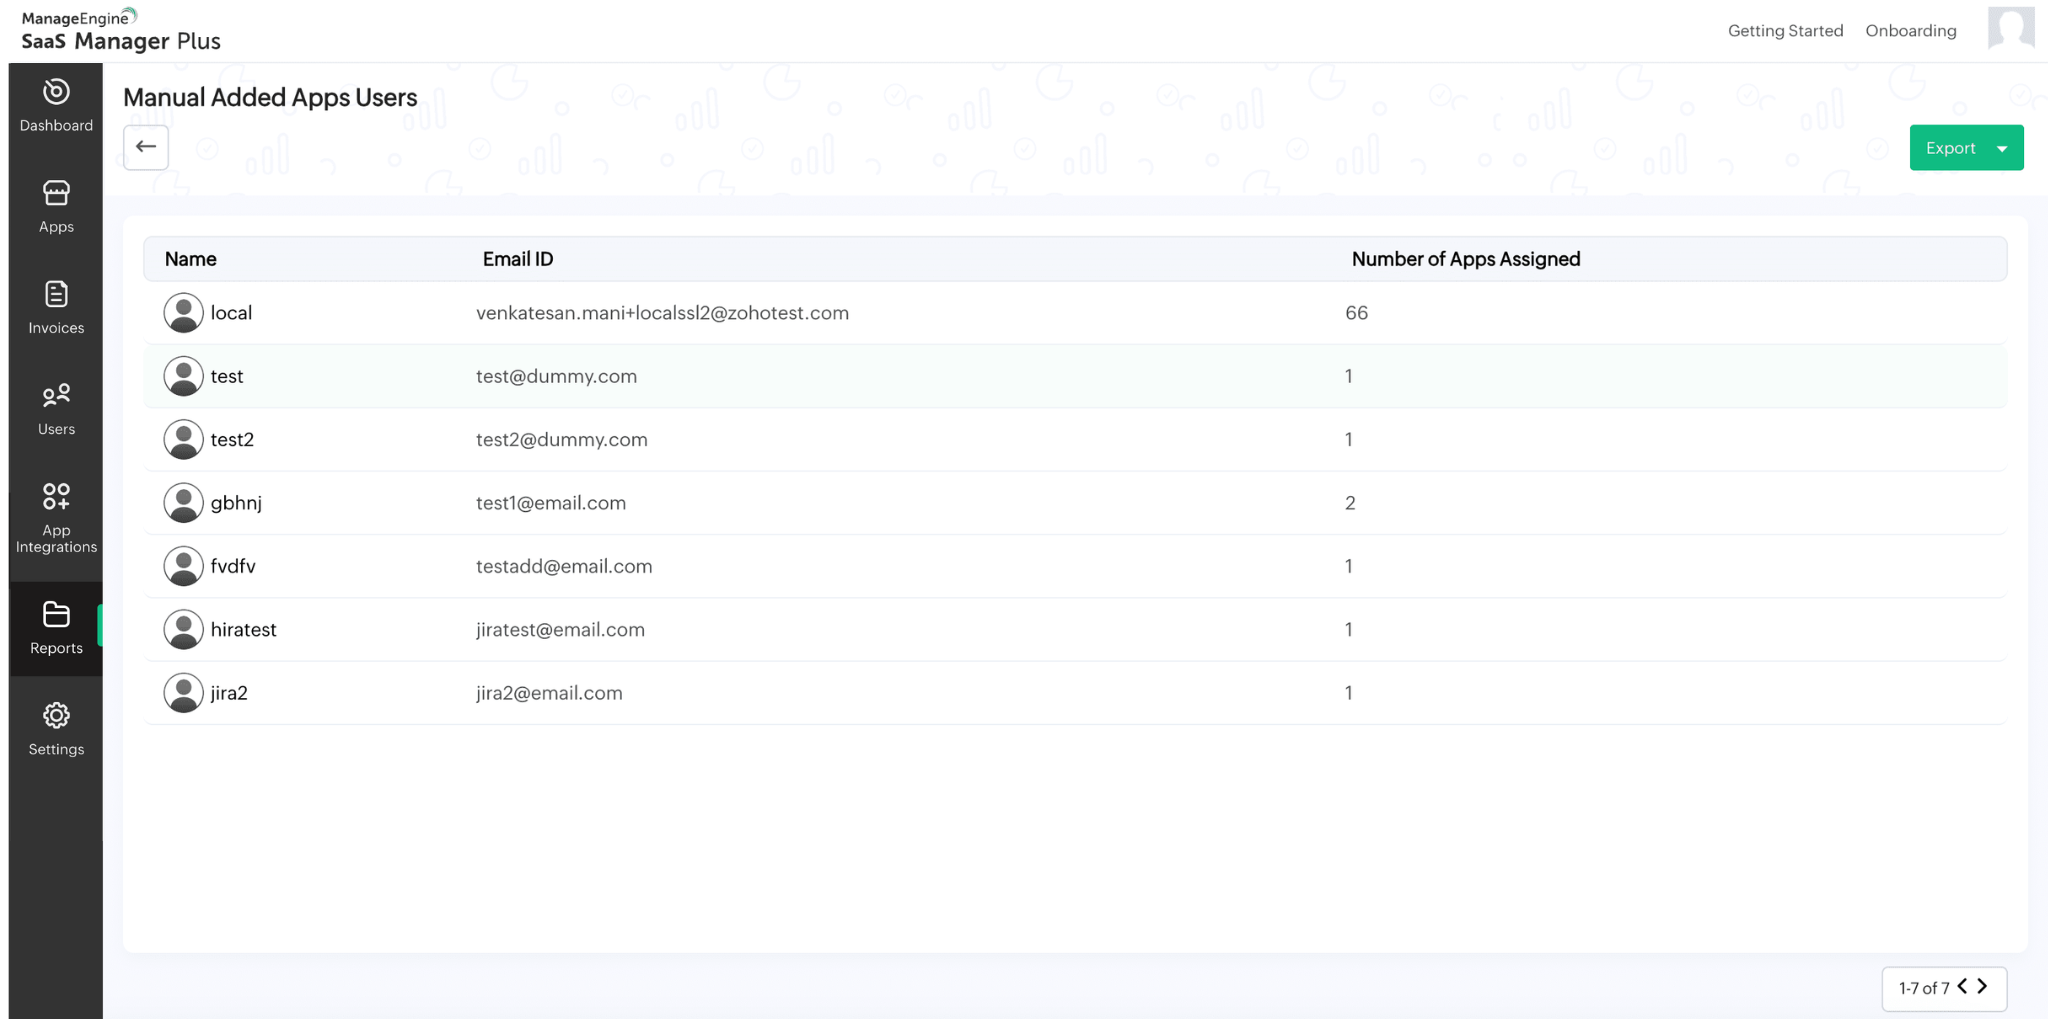
a. Manually Added Users
The Manually Added Users displays the details of all the users added manually along with Name, Email ID, and Number of Apps Assigned.
An Export button is also available in the top-right corner to export the data as a PDF or CSV file.
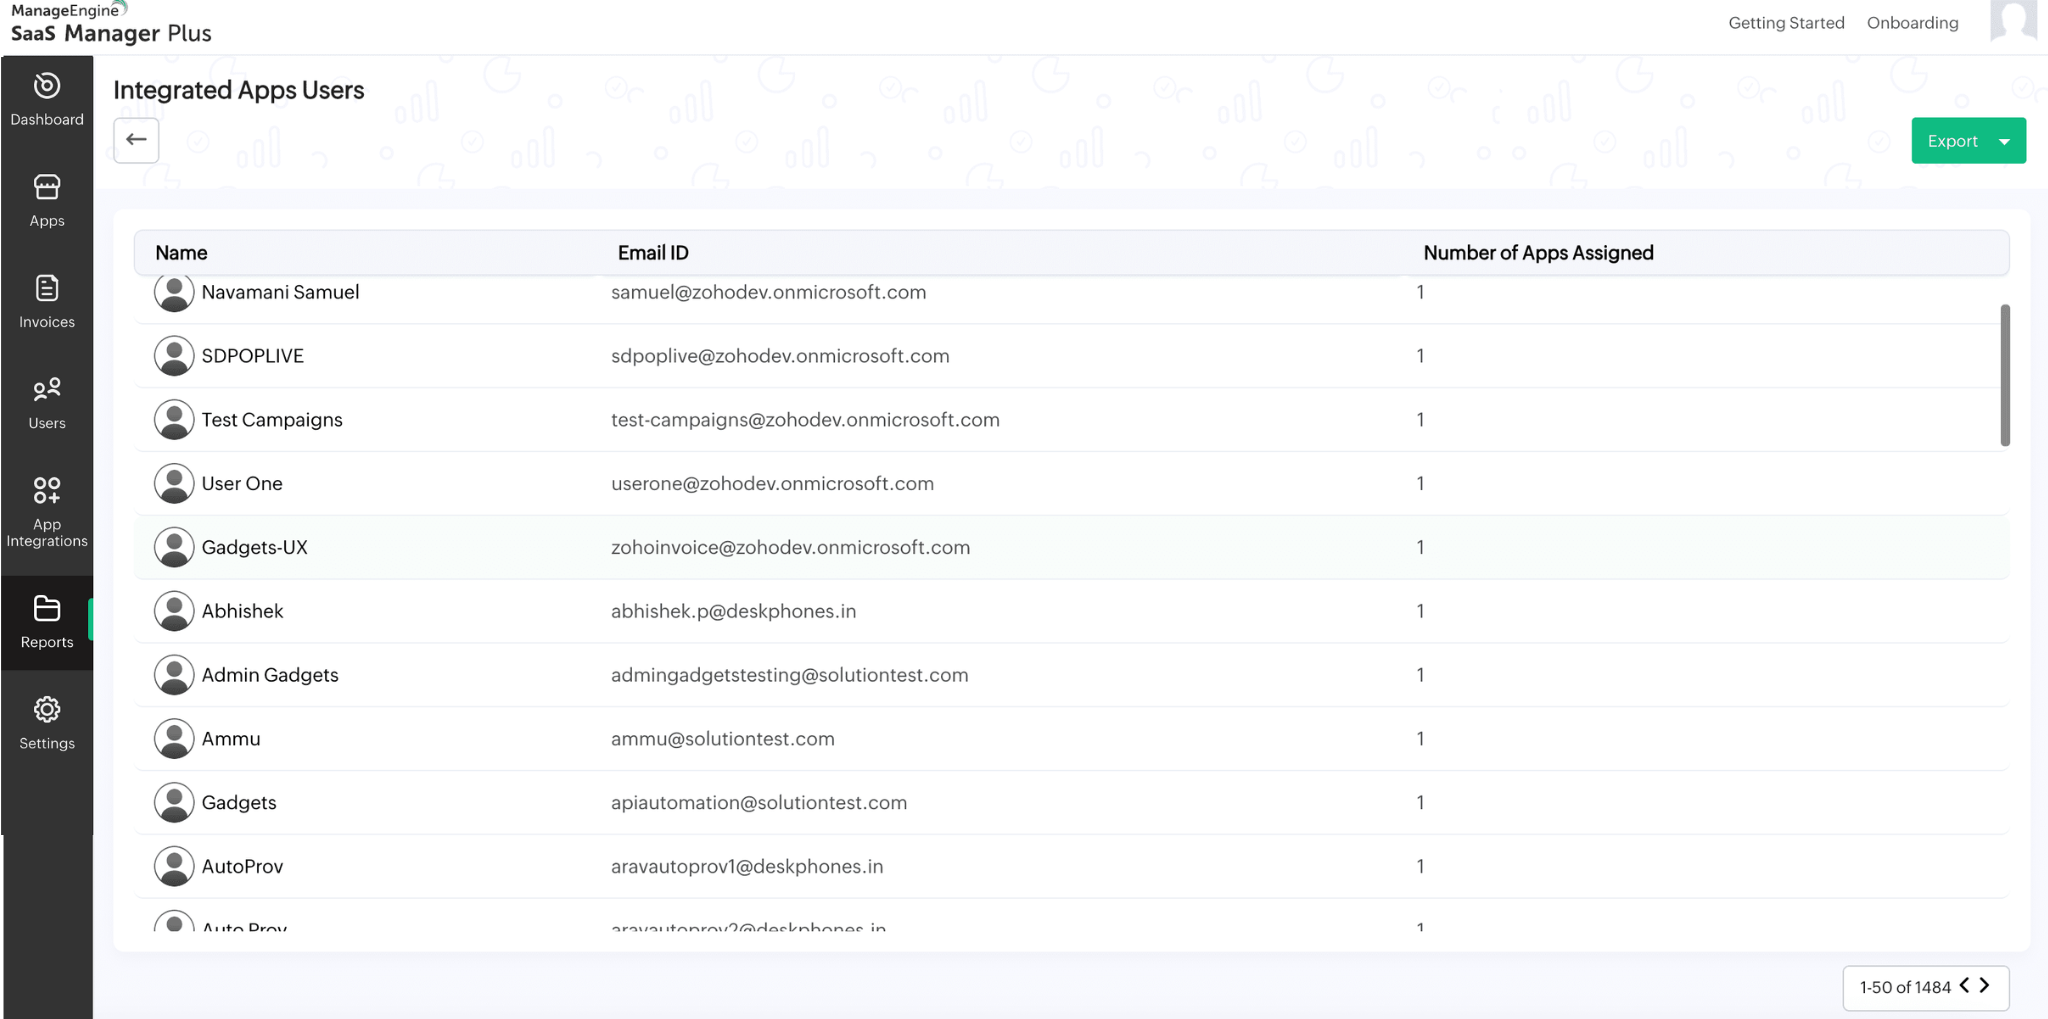
b. Integrated Apps Users
The Integrated Apps Users displays the details of all the users added through integrations along with Name, Email ID, and Number of Apps Assigned.
An Export button is also available in the top-right corner to export the data as a PDF or CSV file.
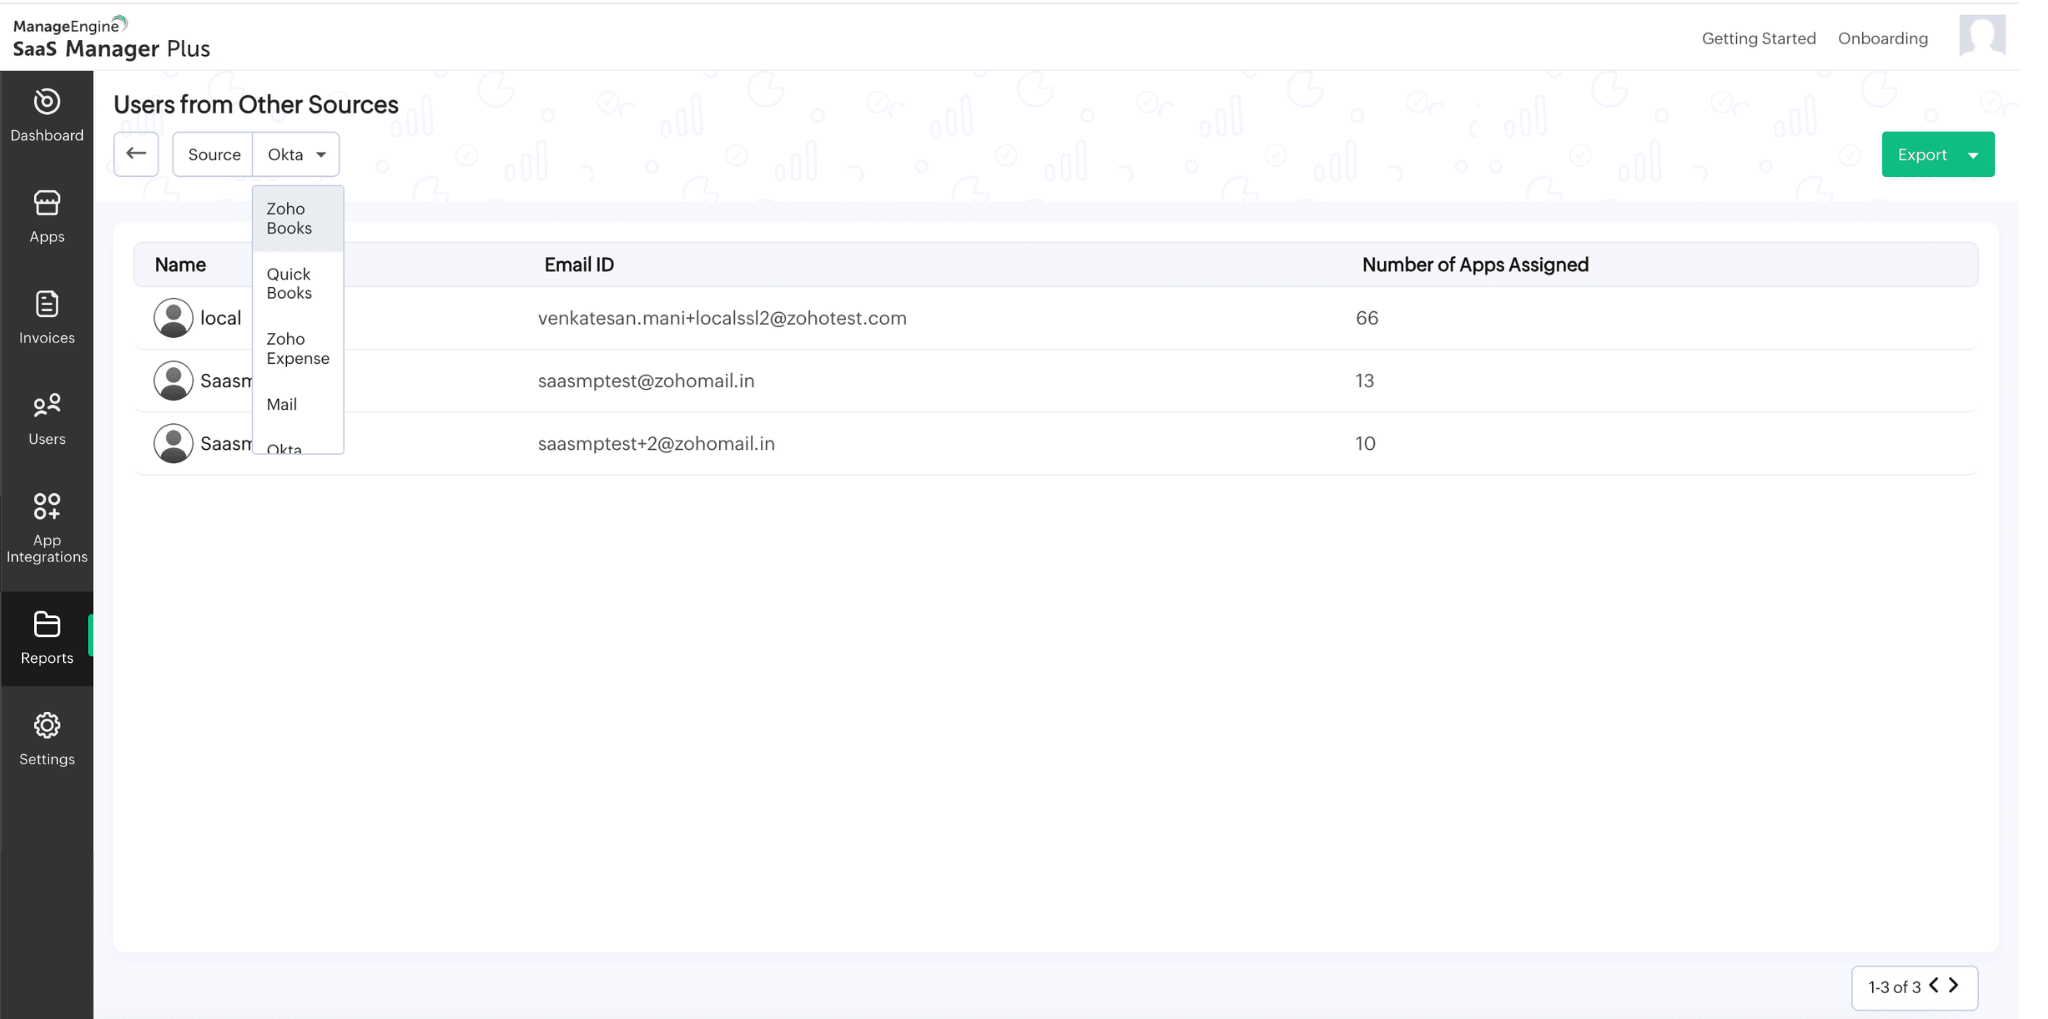
c. Users from Other Sources
The Users from Other Sources displays all the users added from other sources along with Name, Email ID, and Number of Apps Assigned.
Sources drop-down is available in the top-left corner to choose the required source.
An Export button is also available in the top-right corner to export the data as a PDF or CSV file.
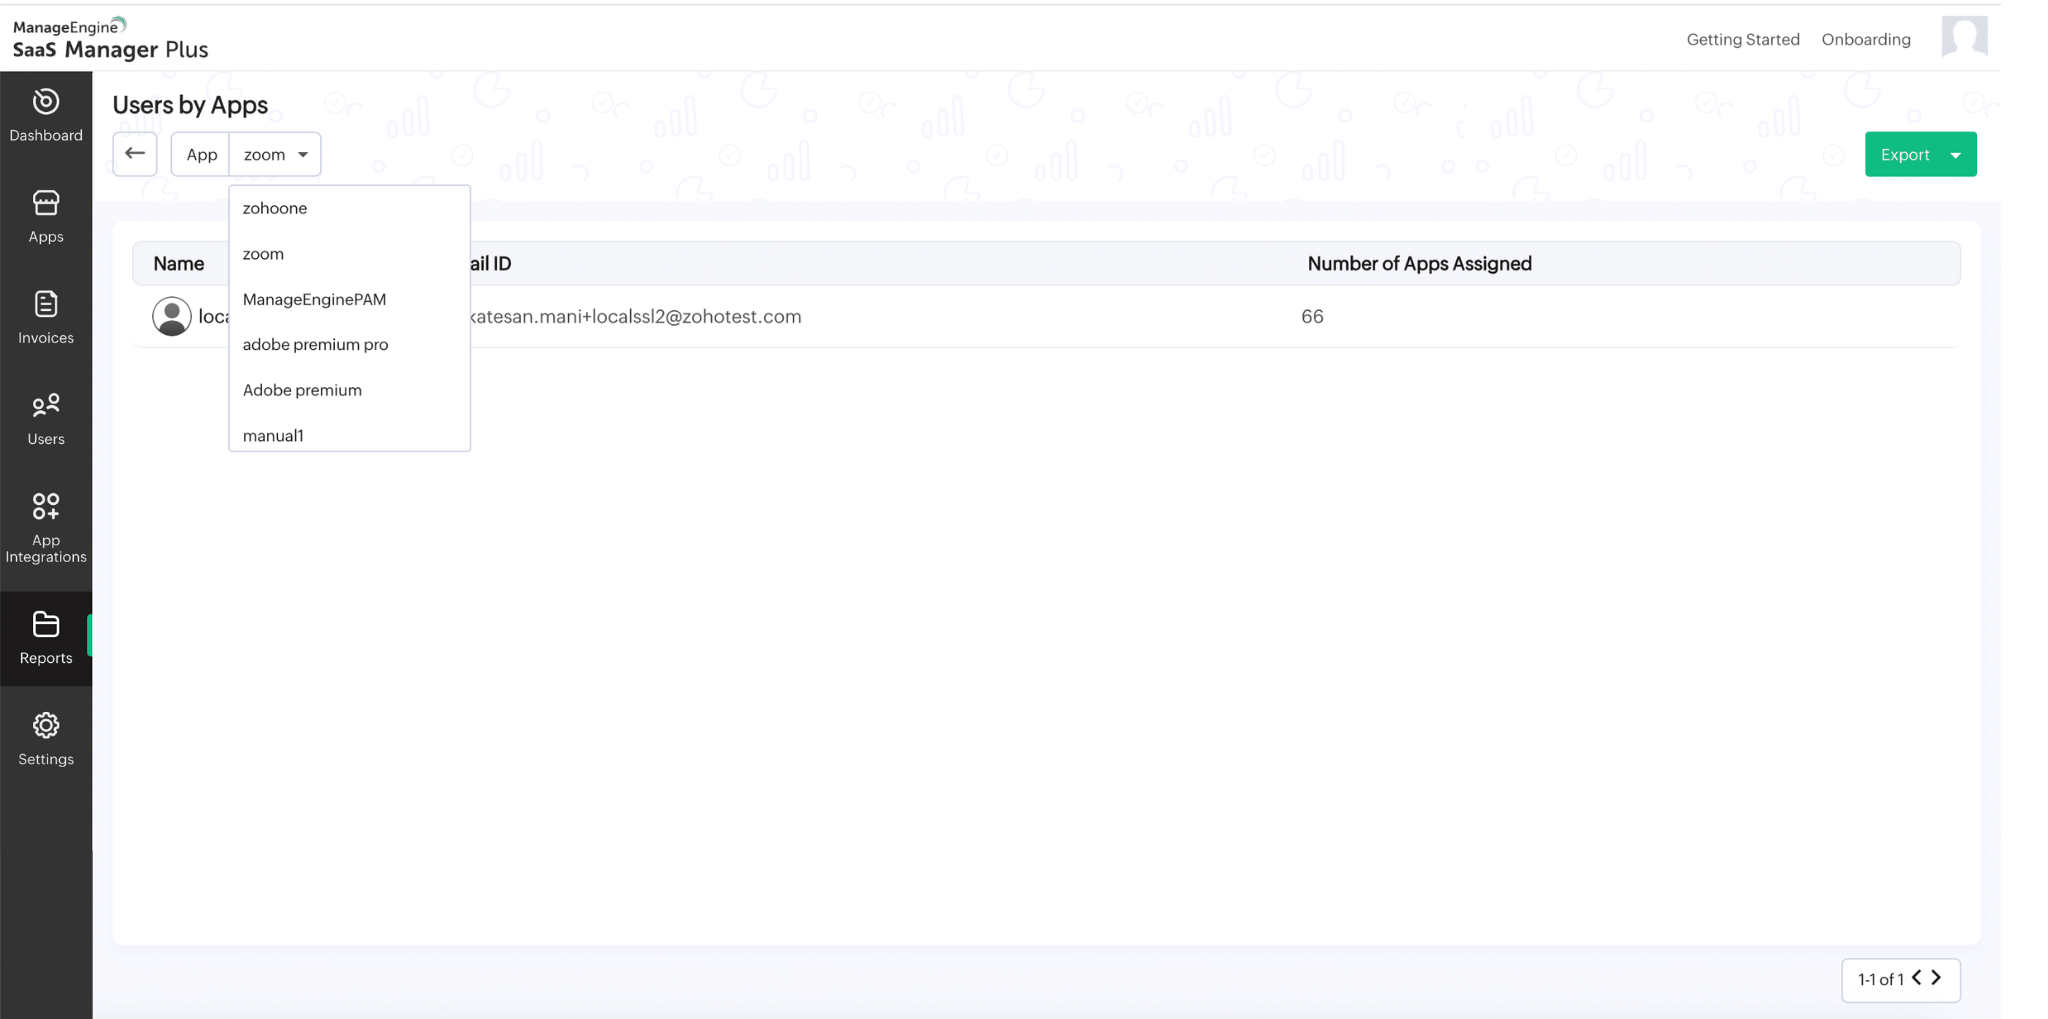
d. Users by Apps
The Users by Apps displays all the users added for a particular app along with Name, Email ID, and Number of Apps Assigned.
App drop-down is available in the top-left corner to choose the required app.
An Export button is also available in the top-right corner to export the data as a PDF or CSV file.
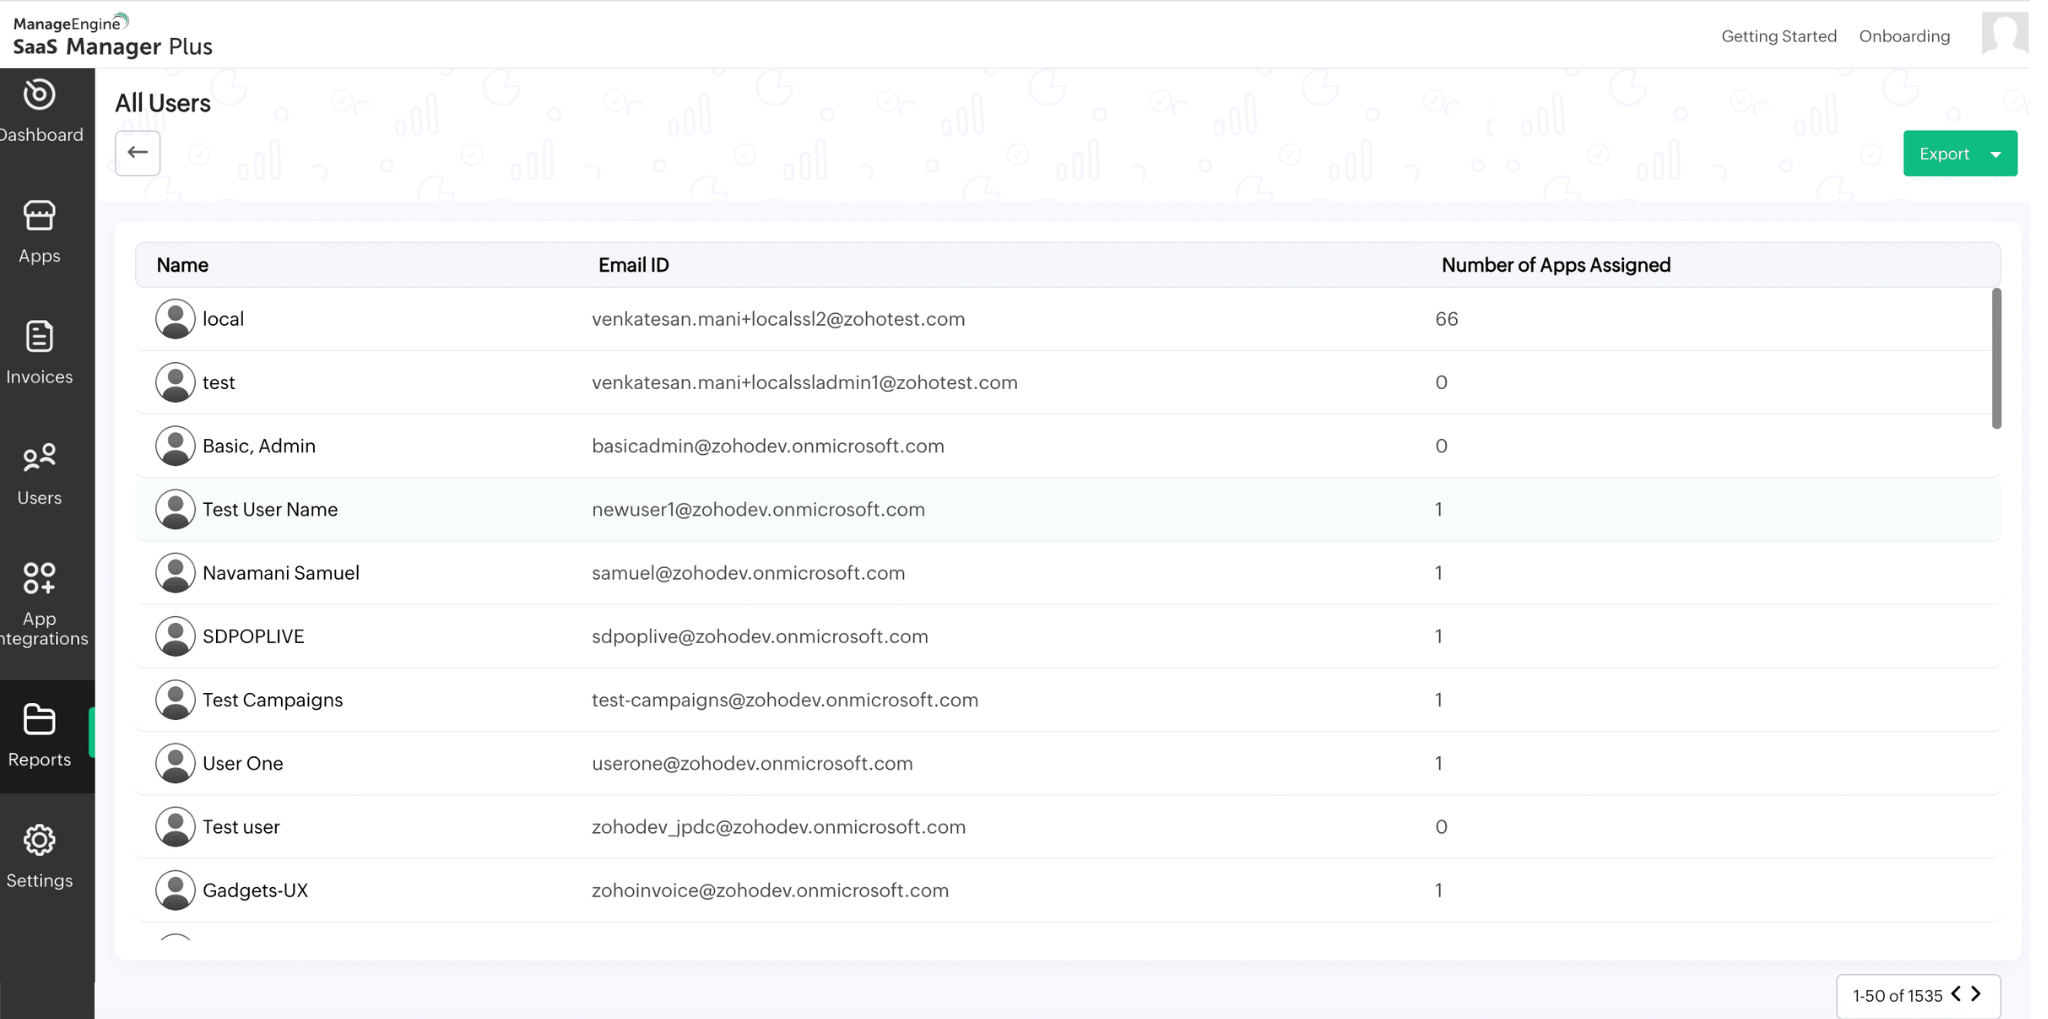
e. All Users
The All Users displays all the users along with Name, Email ID, and Number of Apps Assigned.
An Export button is also available in the top-right corner to export the data as a PDF or CSV file.
Owners
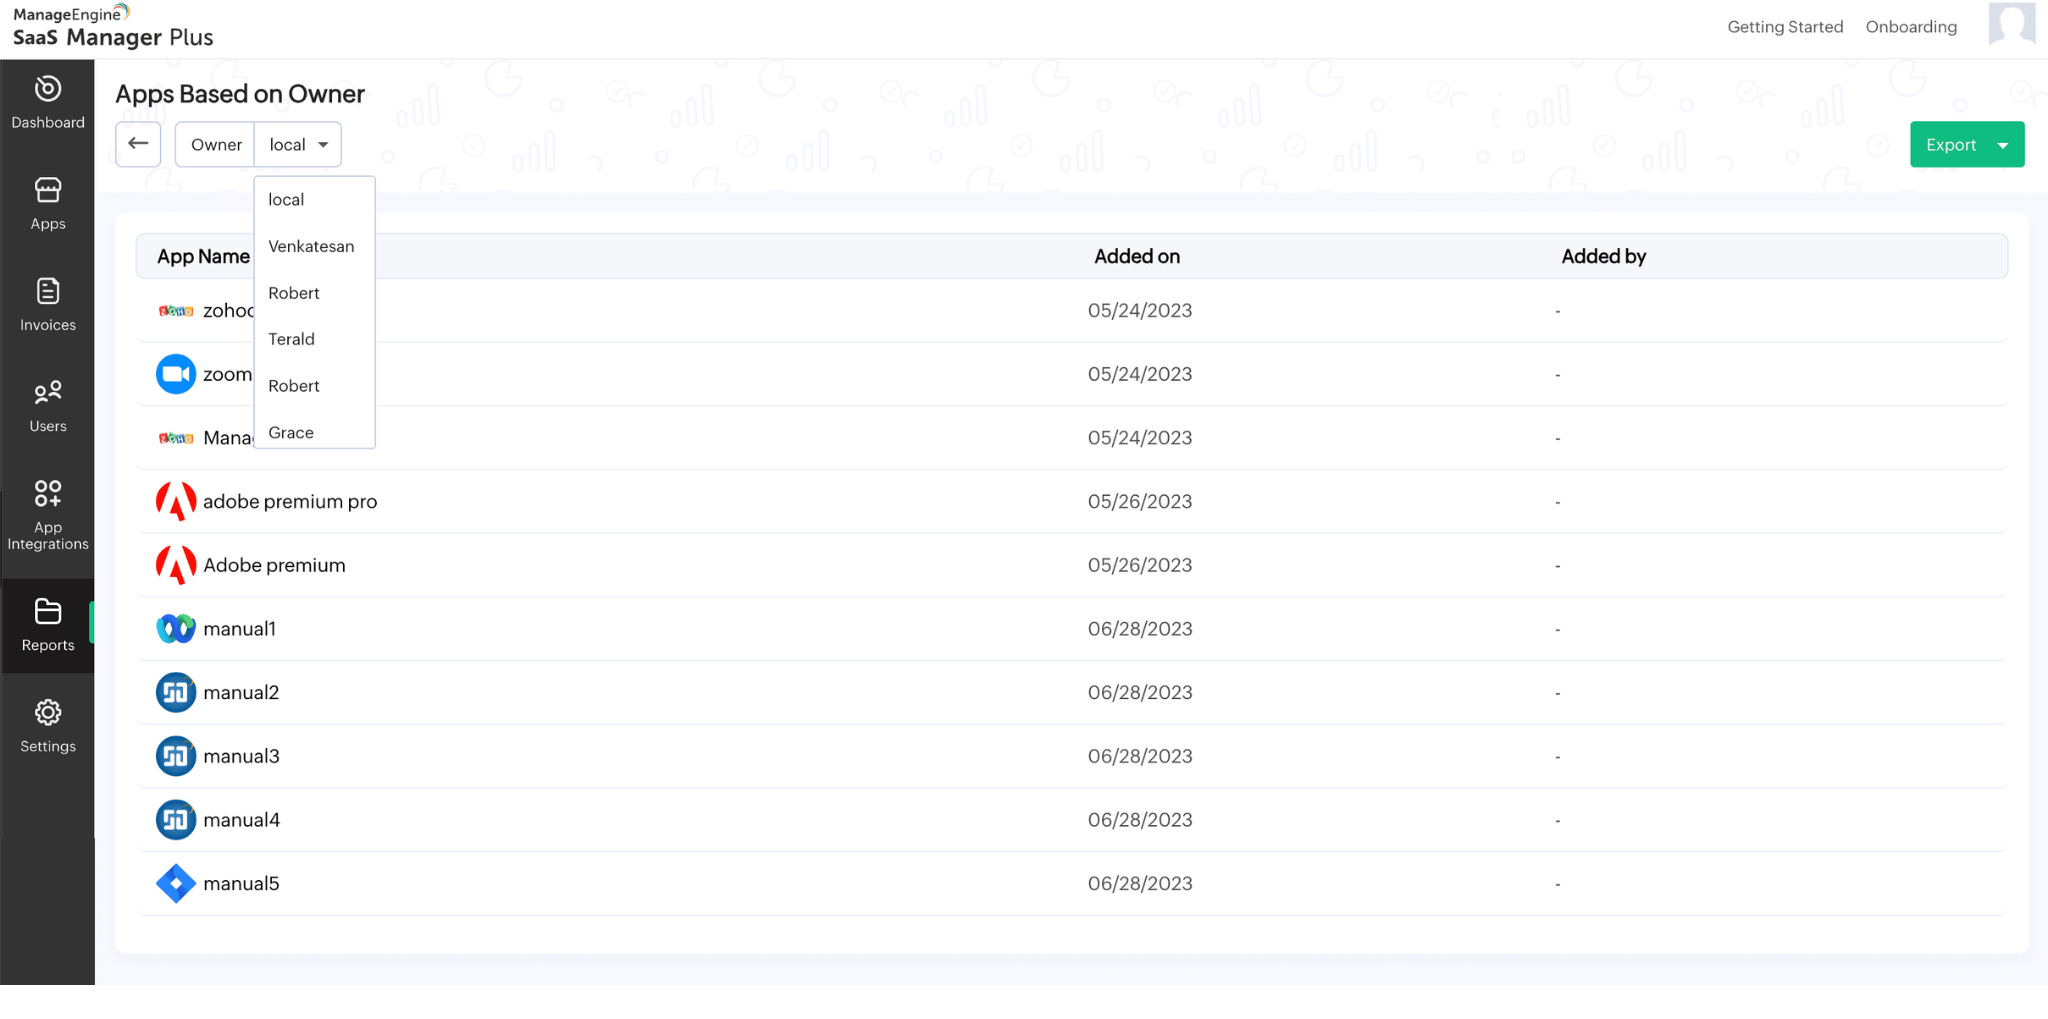
a. Apps Based on Owner
The Apps Based on Owner displays all the apps assigned to a particular owner along with App Name, Added on, and Added by.
Owner drop-down is available in the top-left corner to choose the required owner.
An Export button is also available in the top-right corner to export the data as a PDF or CSV file.
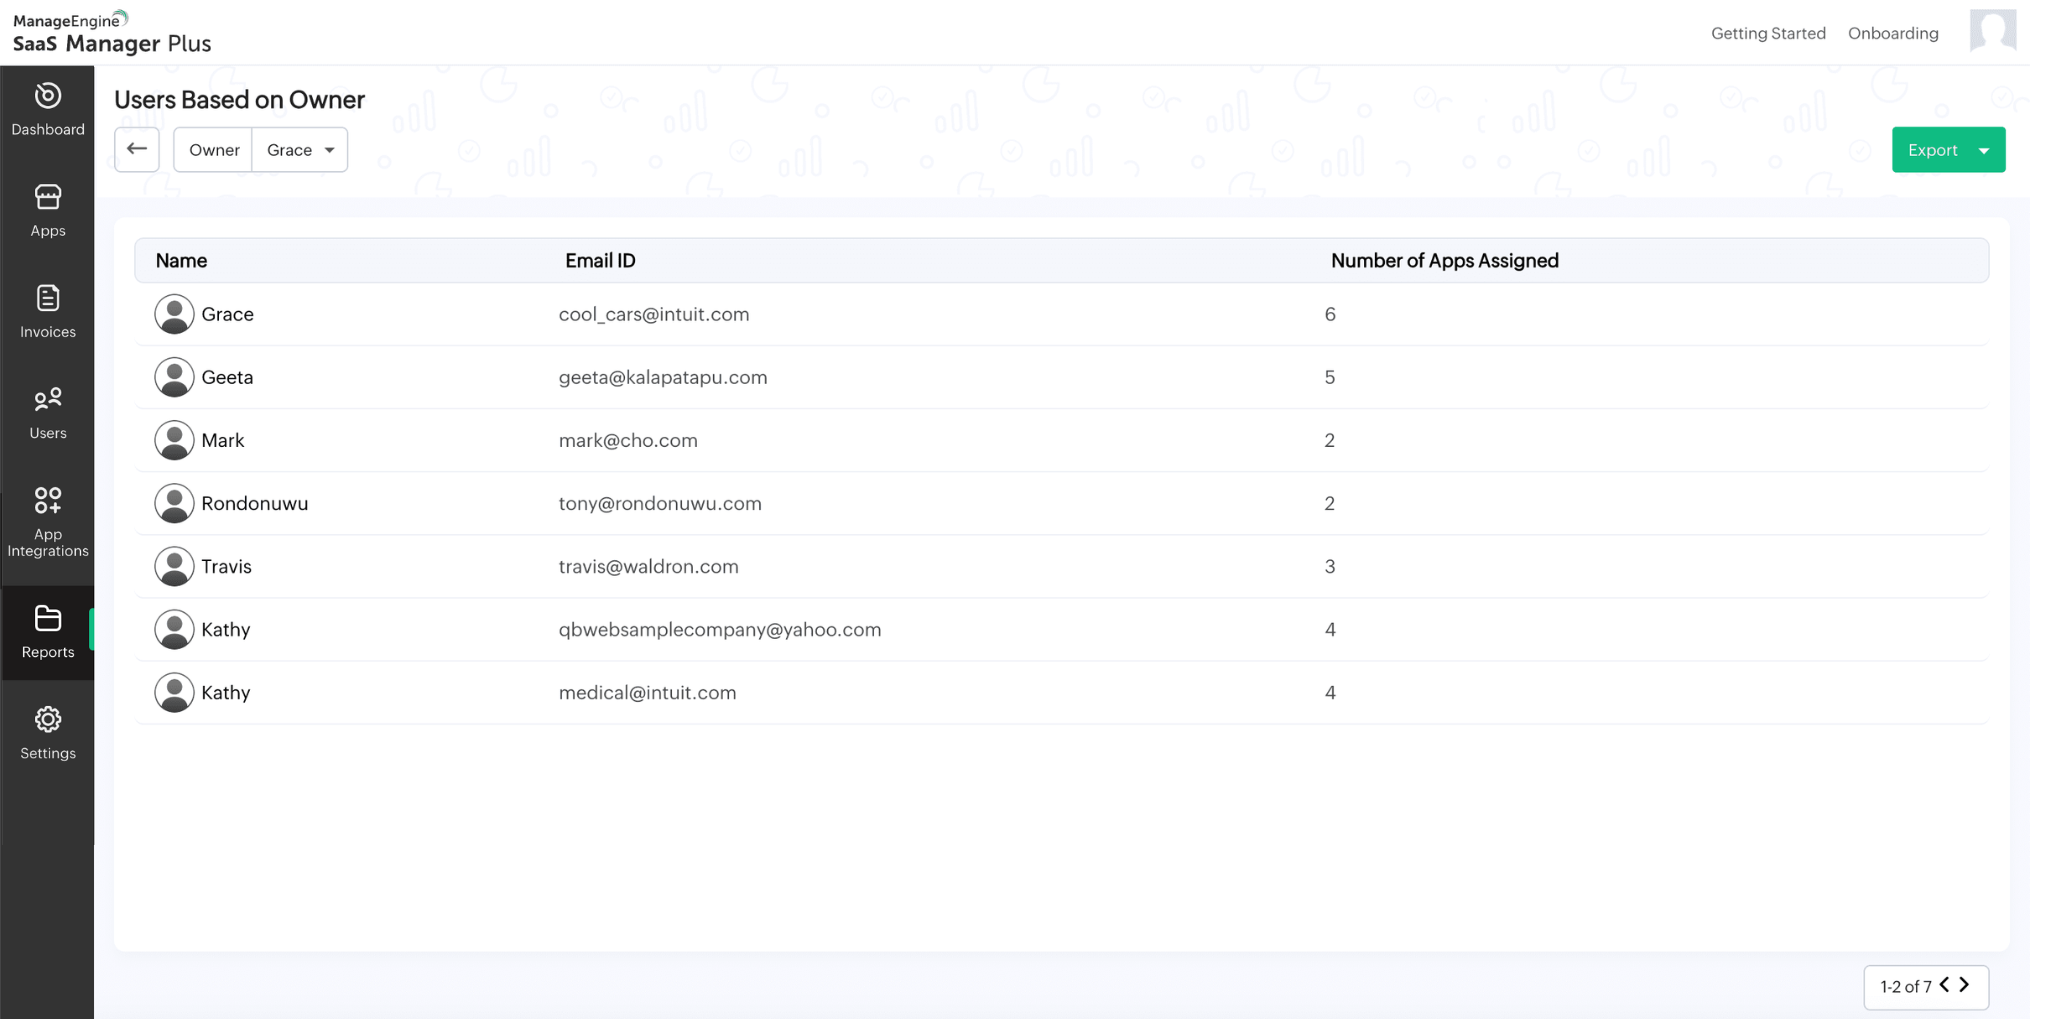
b. Users Based on Owner
The Users Based on Owner displays all the users assigned to a particular owner along with Name, Email ID, and Number of Apps Assigned.
Owner drop-down is available in the top-left corner to choose the required owner.
An Export button is also available in the top-right corner to export the data as a PDF or CSV file.
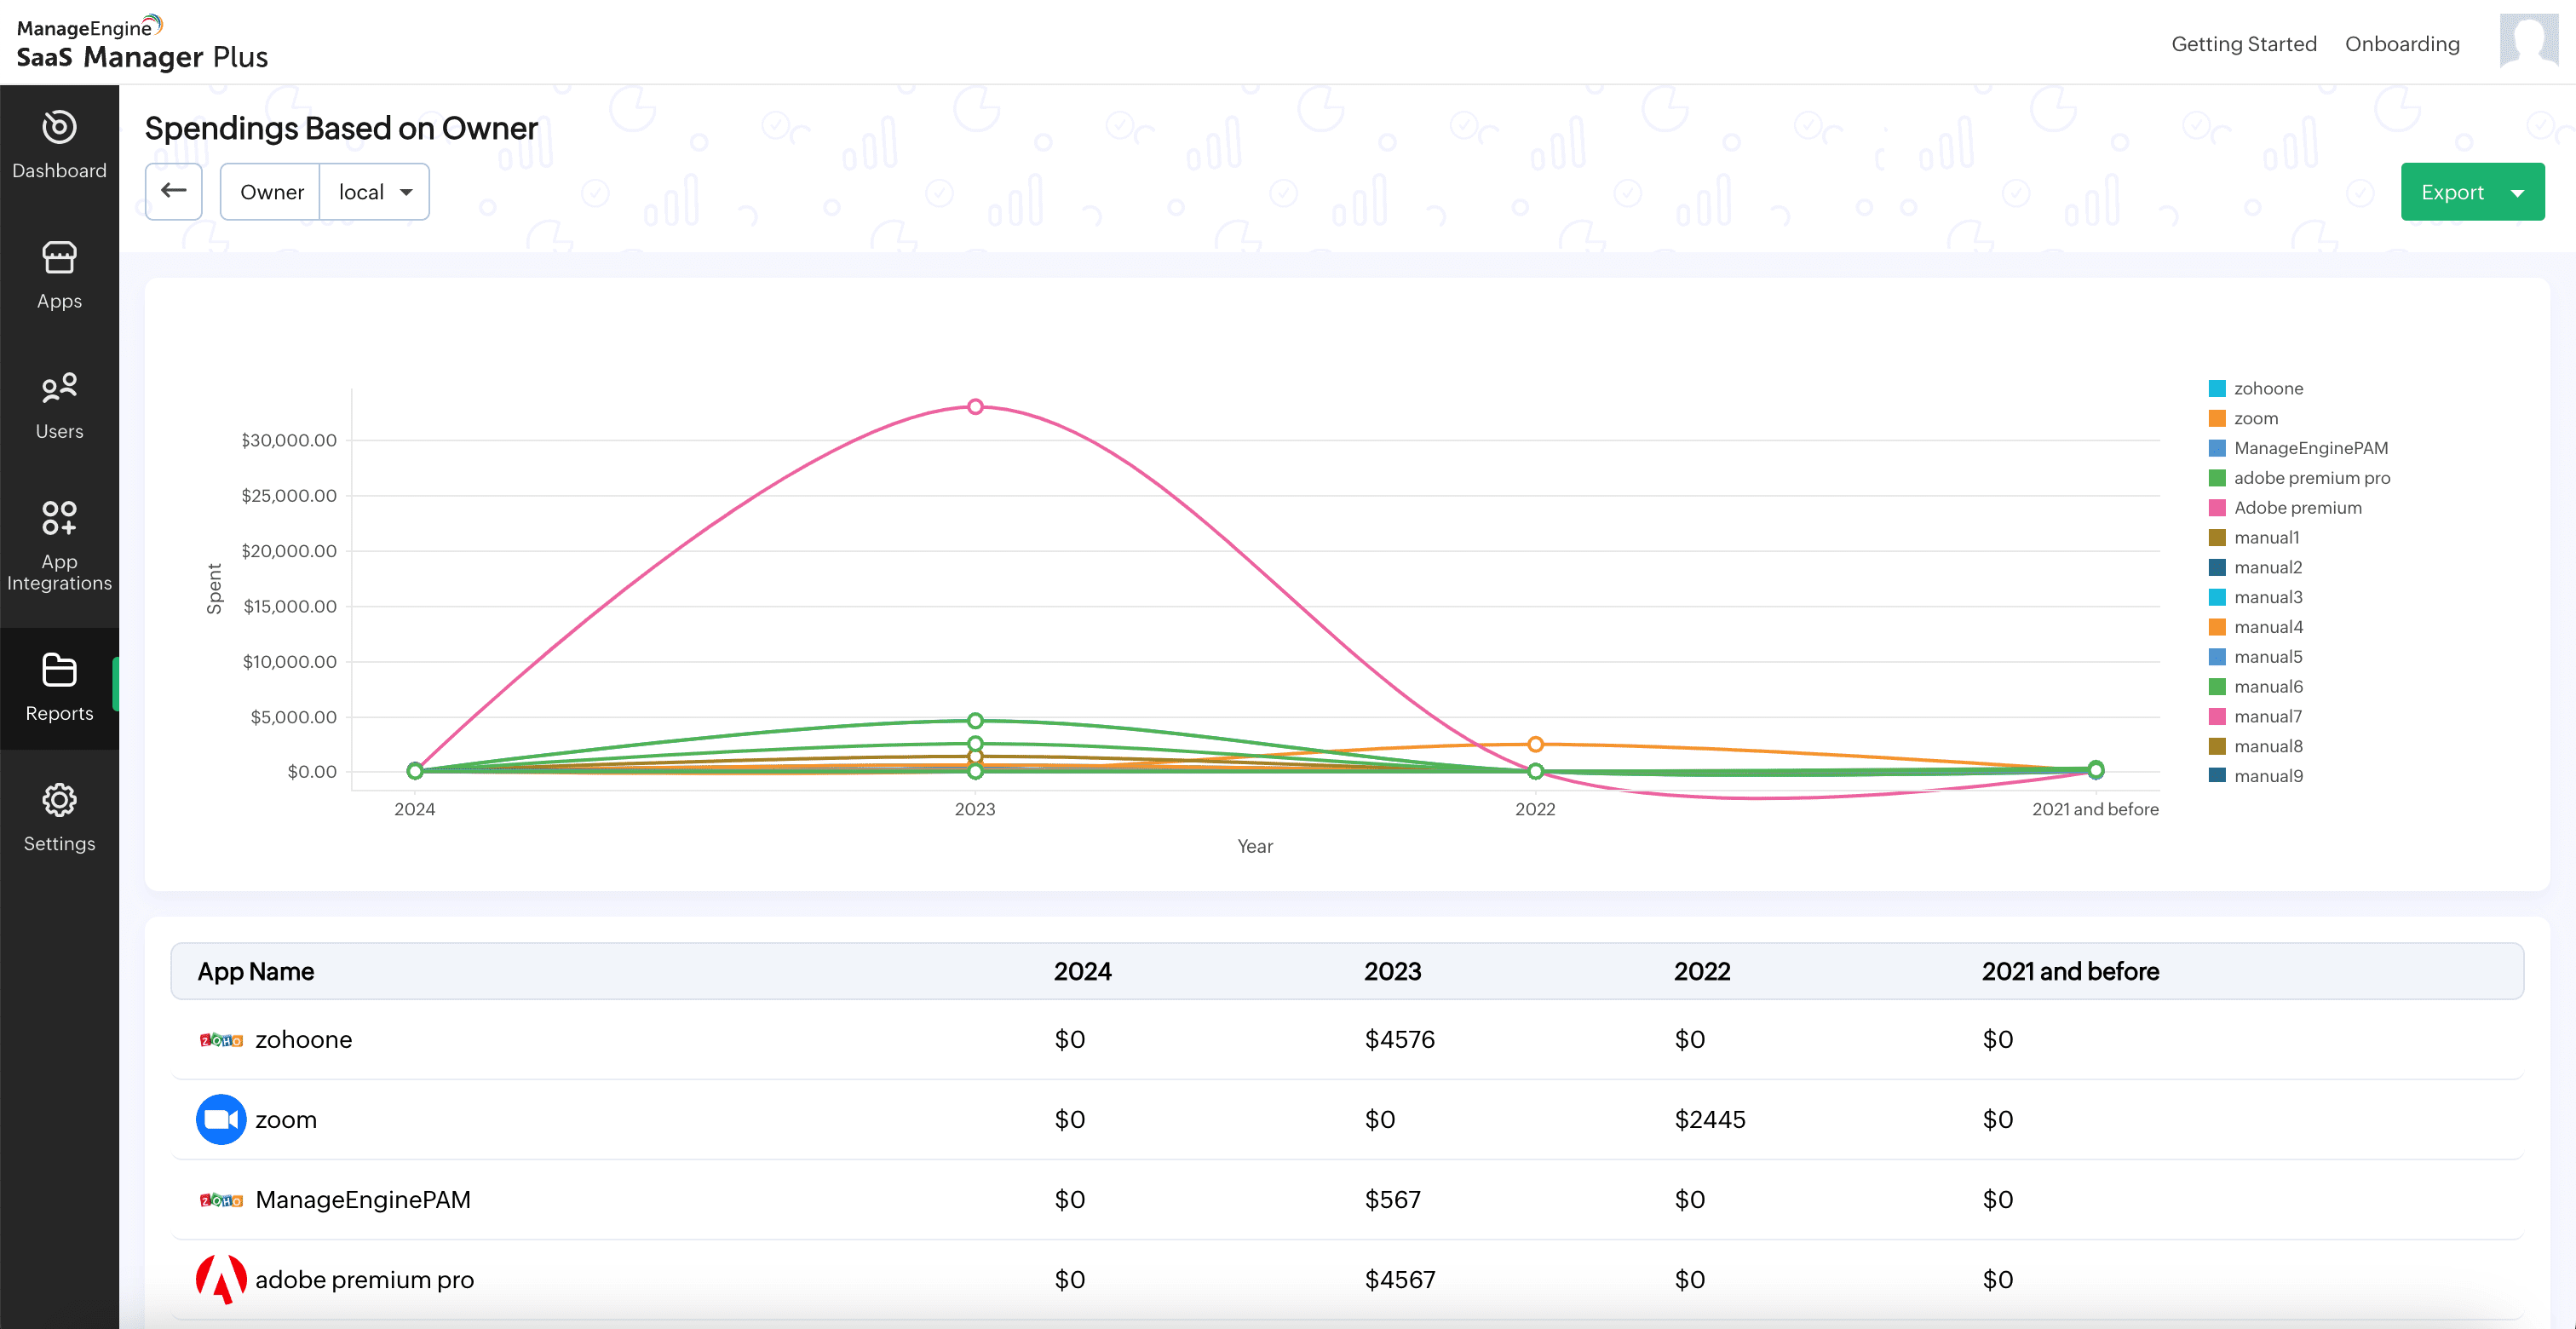
c. Spendings Based on Owner
The Spendings Based on Owner offers an overall spending pattern of a particular owner. This report displays a breakdown of total expenses of all the apps assigned to the particular owner incurred across years.
An Export button is also available in the top-right corner to export the data as a PDF or CSV file.
Activities
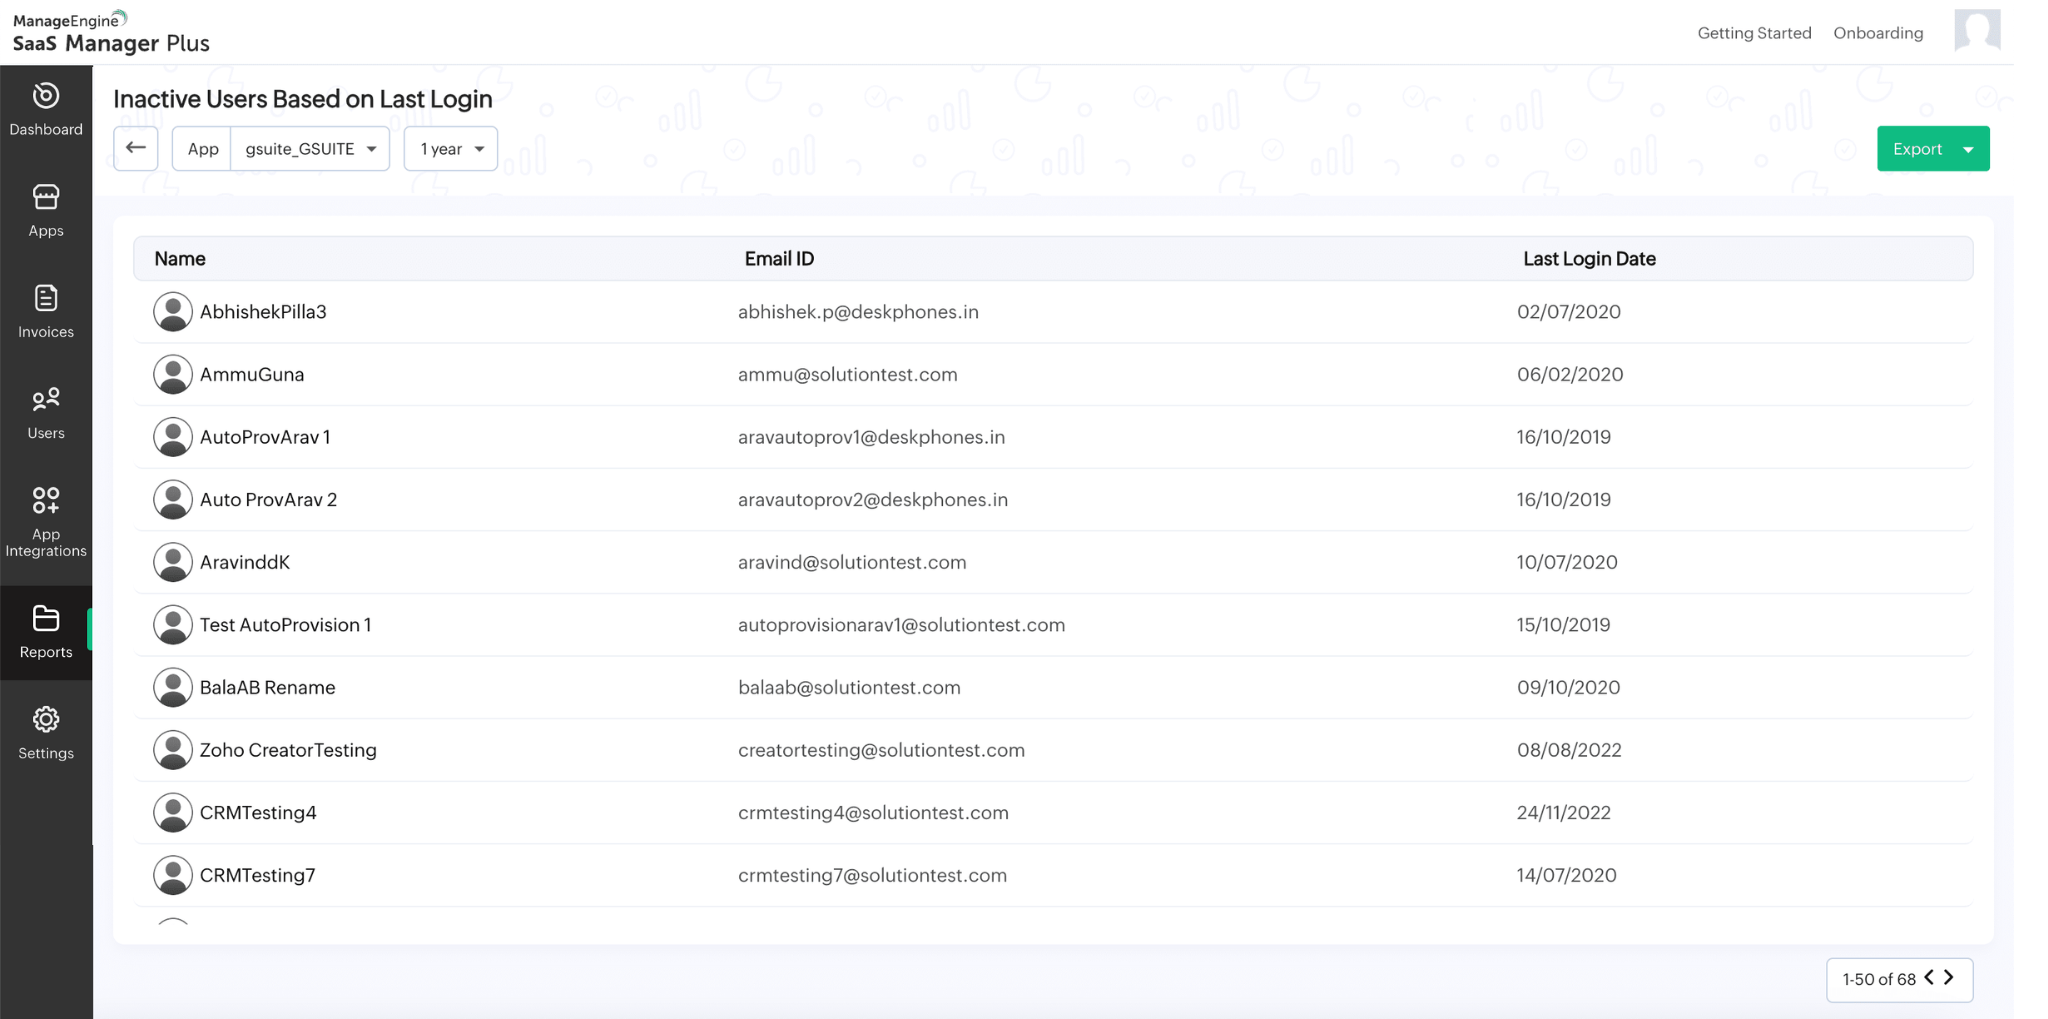
a. Inactive Users Based on Last Login
The Inactive Users Based on Last Login displays the details of all the inactive users along with Name, Email ID, and Last Login Date for the selected app over the selected time period.
App drop-down is available in the top-left corner to choose the required app along with Duration drop-down to choose the required time period.
An Export button is also available in the top-right corner to export the data as a PDF or CSV file.
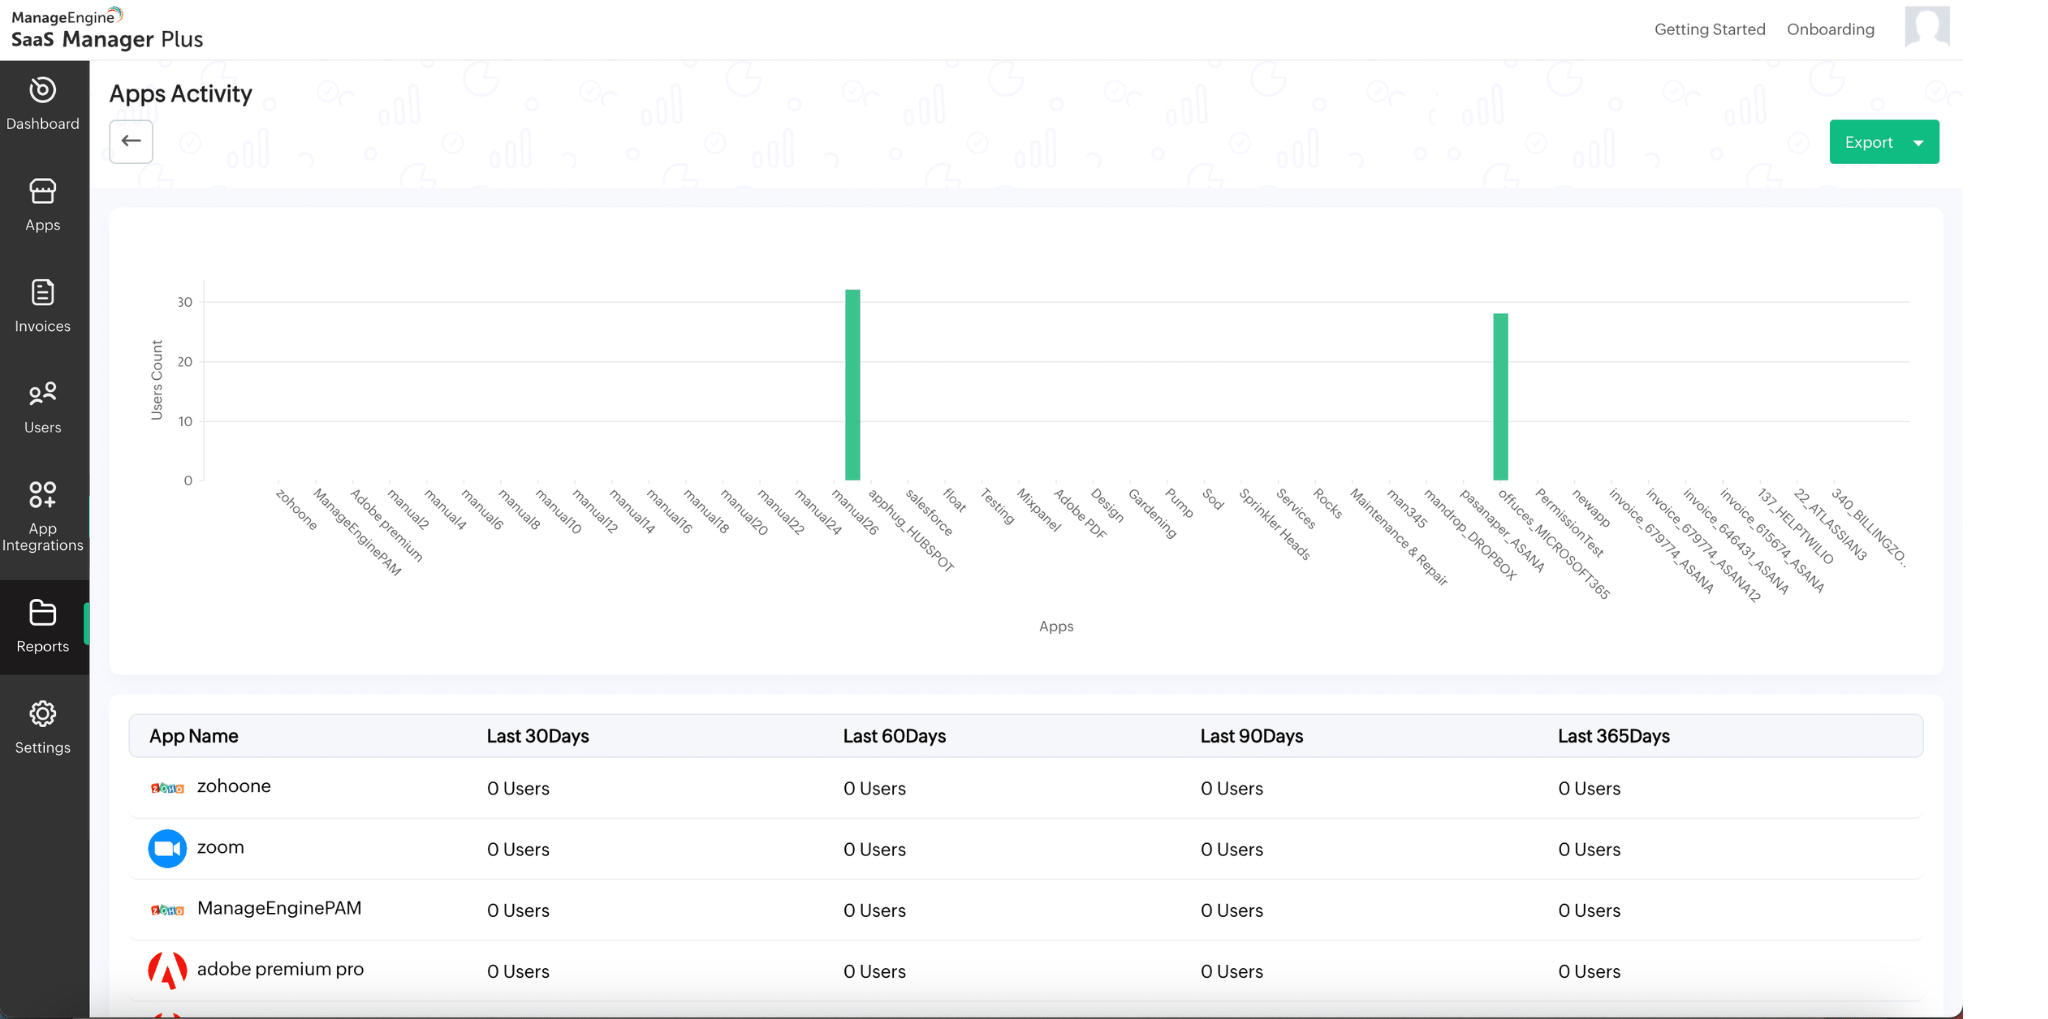
b. Apps Activity
The Apps Activity displays all the inactive users count across different time periods.
An Export button is also available in the top-right corner to export the data as a PDF or CSV file.
Vendors
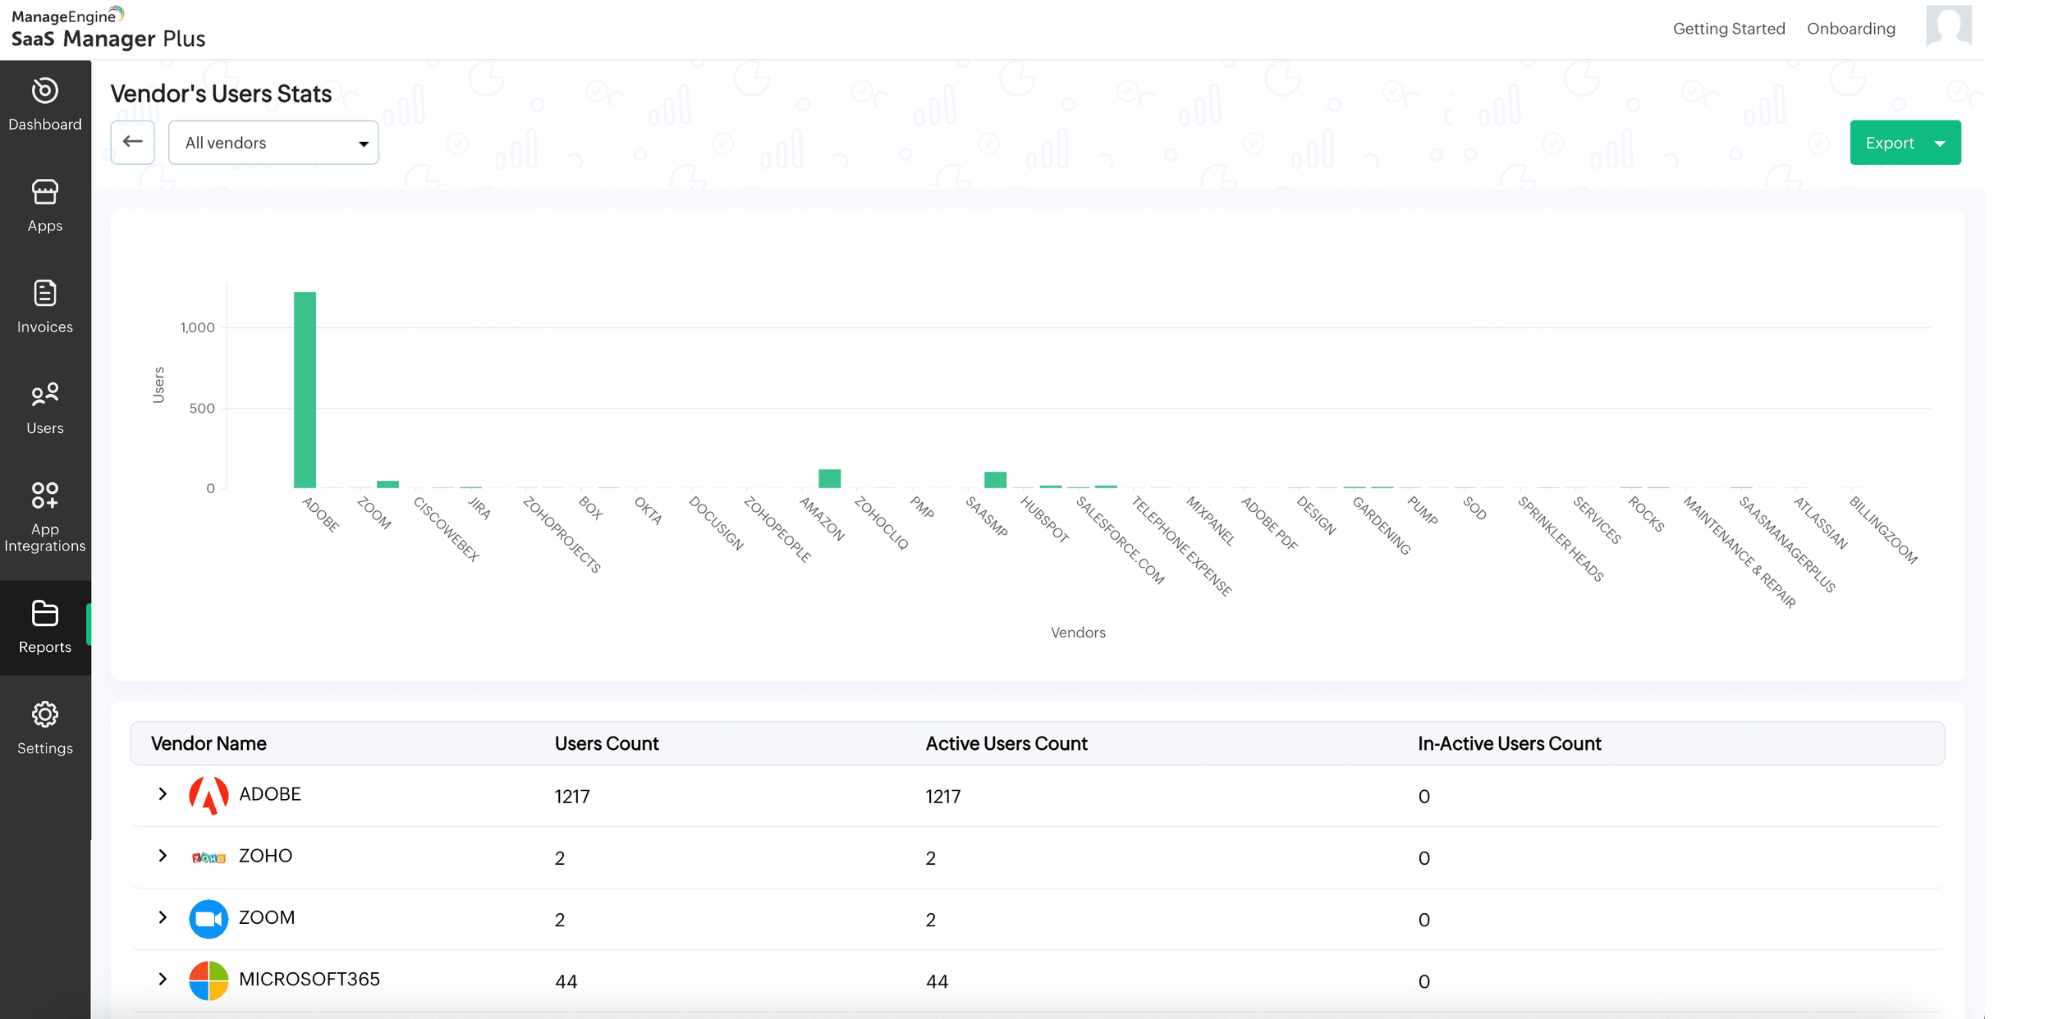
a. Vendor's Users Stats
The Vendor's Users Stats focuses on user-level statistics related to vendors. It provides valuable information about the users who interact with specific vendors. This report helps you identify each vendor's active and inactive user counts. You can select the desired vendor for generating the report using the All Vendors drop-down box in the top-left corner.
An Export button is also available in the top-right corner to export the data as a PDF or CSV file.
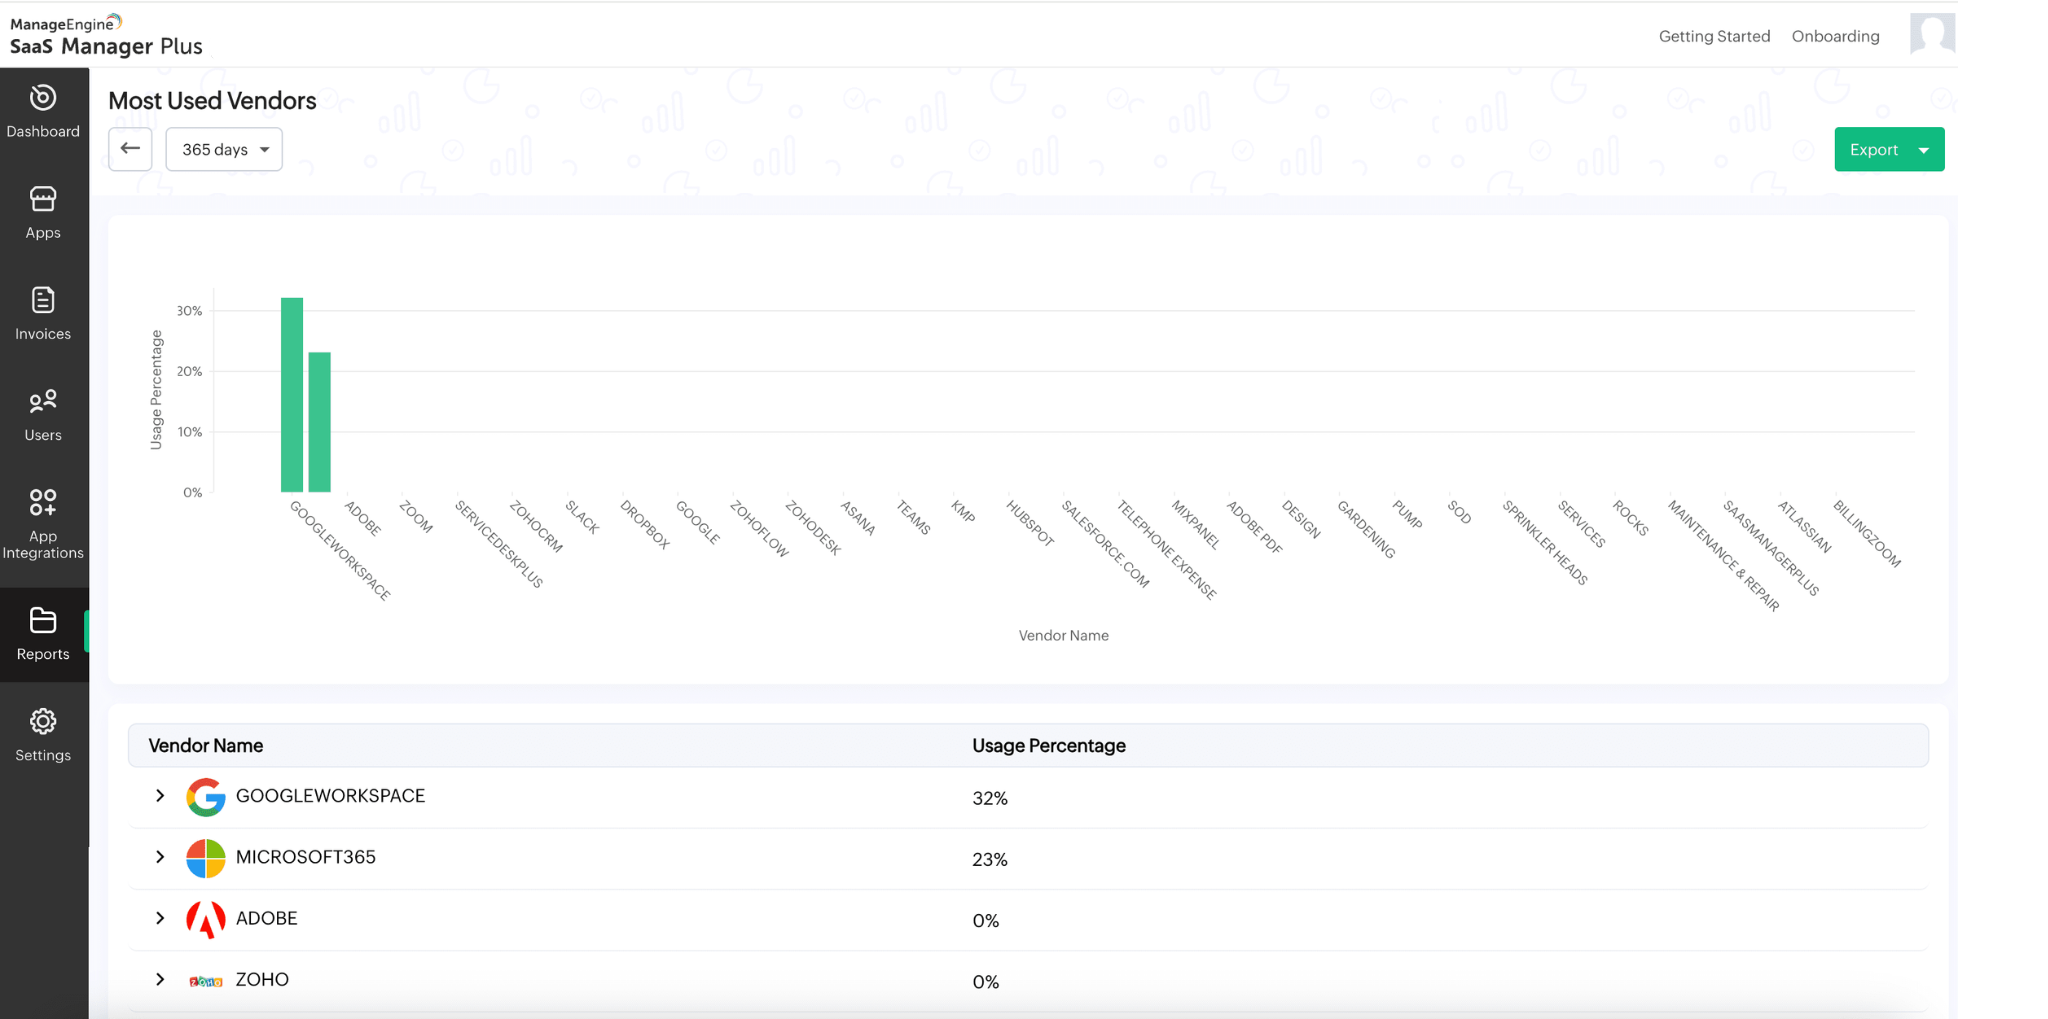
b. Most Used Vendors
The Most Used Vendors identifies the most frequently utilized vendors within your organization. This report presents an overview of vendors and their respective usage percentages. You can choose the desired timeframe, such as 30 days, 60 days, 90 days, or 365 days, using the drop-down box in the top-left corner.
An Export button is also available in the top-right corner to export the data as a PDF or CSV file.
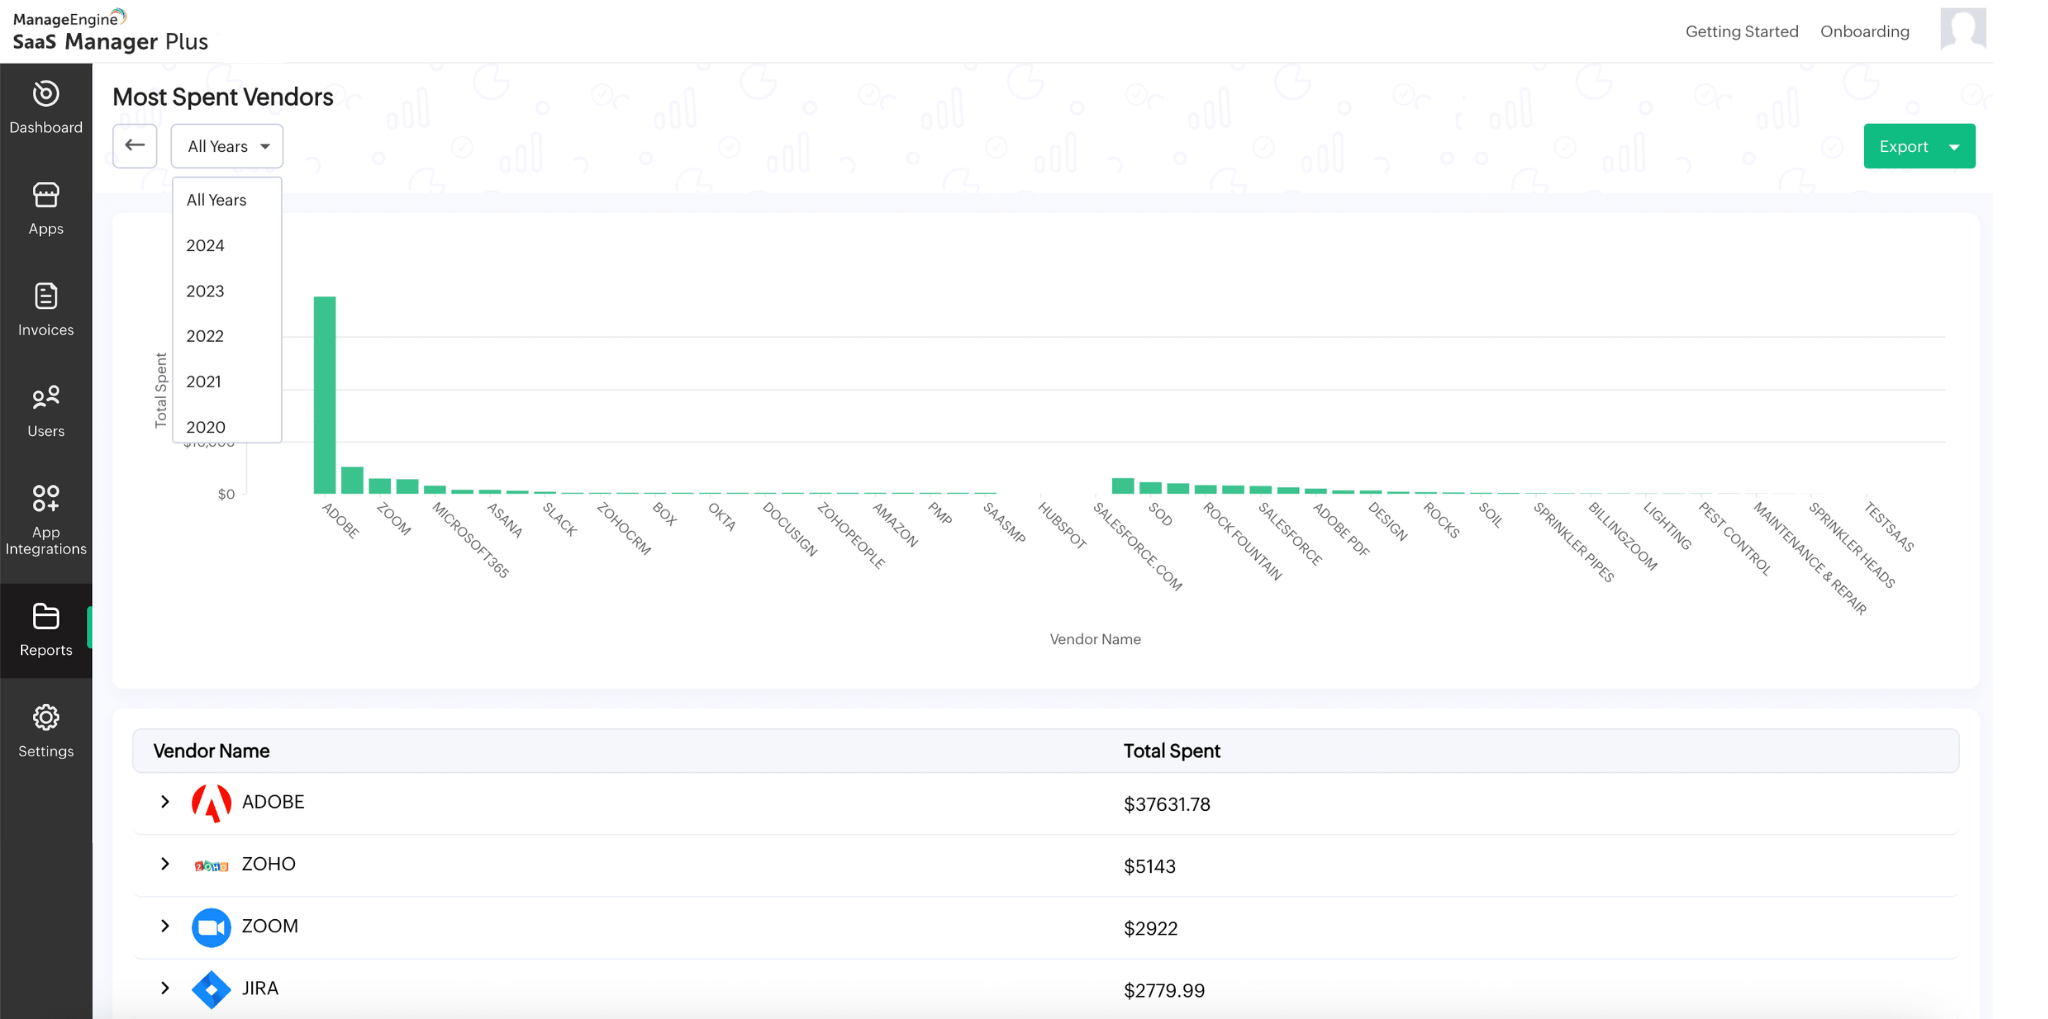
c. Most Spent Vendors
The Most Spent Vendors displays a table listing the vendor names and their total spent. You can select the desired year for generating the report using the drop-down box in the top-left corner.
An Export button is also available in the top-right corner to export the data as a PDF or CSV file.