Understanding DPI in OpManager Plus
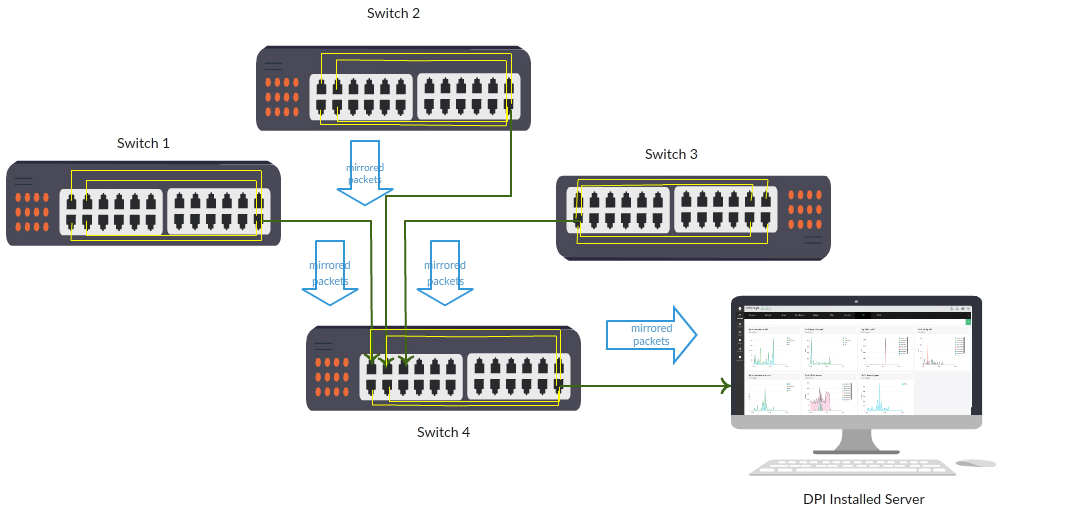
Traffic packets passing through the network device, can be mirrored to a port of the same device for inspection. Also multiple ( WAN/LAN /Uplink) ports traffic can be mirrored and set for inspection. In case if you wish to inspect packets from multiple devices, all the mirrored ports can be connected to a L2 switch On which Opmanager Plus is connected to.

In the above diagram, consider 4 uplink ports are mirrored for monitoring to the last port of individual switches 1,2,3 & 4. Here all the mirrored network packets reaches the Opmanager Plus installed server through mirroring on Switch 4. Port mirroring commands vary from vendor to vendor, you can check with the respective device vendor for commands.
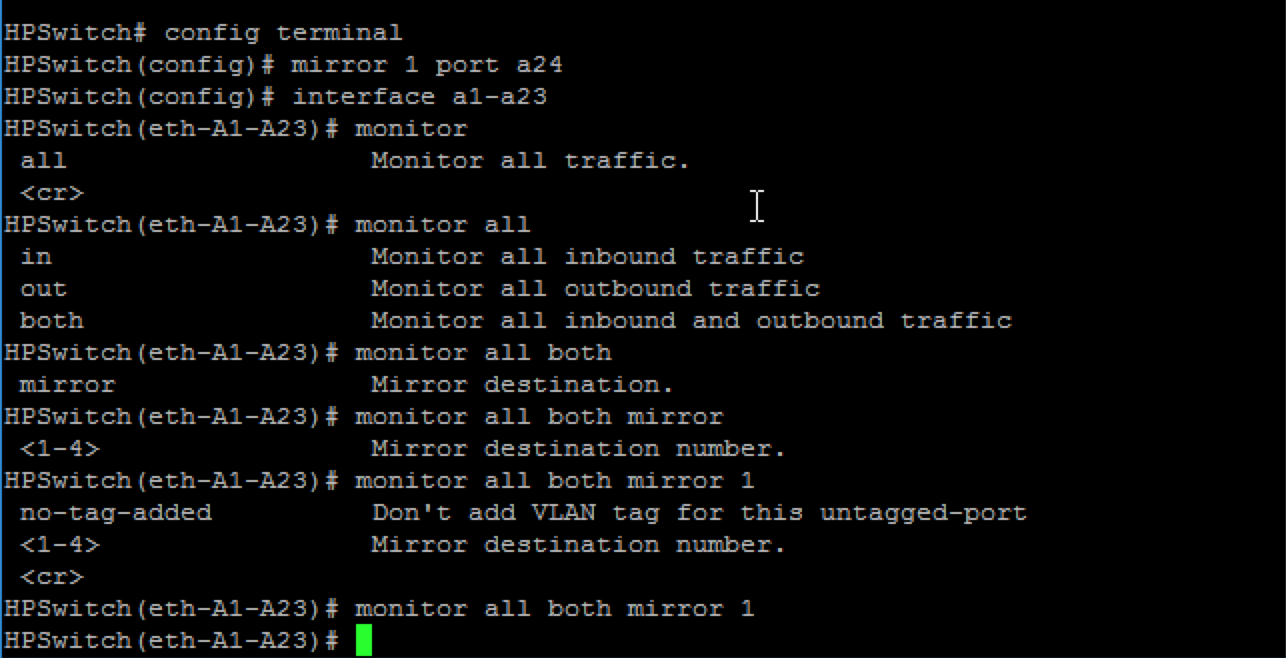
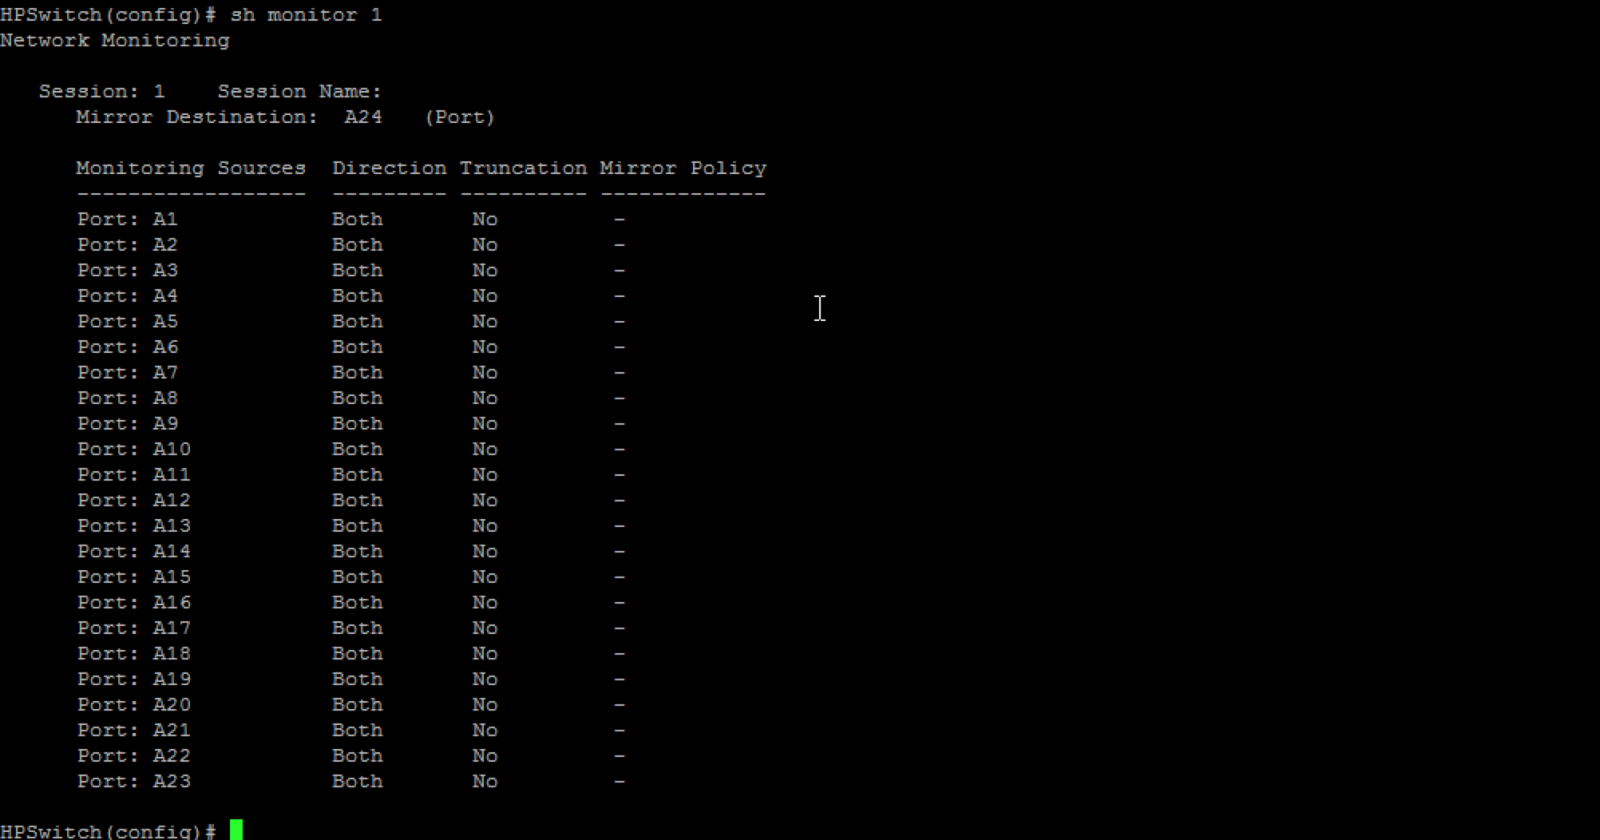
Below is an example for port mirroring on a HP Switch


With these recieved network packets Manageengine will analyze the captured packets and generate reports.
TCP analysis.
As Initial phase Manageengine has Introduced analysis for TCP packets even though it captures all packets. Rest will be supported in future. Using the DPI feature, we can calculate application response time (ART) , network response time (NRT) , url's used and traffic utilization (productive\non-productive).
With these reports a network administrator can have a clear picture of what is consuming the bandwidth at what time and so, he can regulate it cost efficiently.
In DPI we get information about ART,NRT and URL's
NRT : NetWork Response Time. It is the time difference between TCP_SYN packet and its ACK (acknowledgement)
ART : Application Response Time is the time difference between TCP_DATA packet and its ACK (acknowledgement flag)
URL : URL details contained in data packets.
