OpManager-Grafana integration
In modern enterprises—particularly in sectors like large financial institutions—maintaining the seamless operation of critical services, such as online banking, transaction processing, and data warehousing is paramount. Any disruption in these services poses significant risks, from financial losses to reputational damage.
To ensure uninterrupted performance, IT teams often deploy multiple network management systems (NMS) to monitor the health and performance of applications, servers, and network devices across various branches and data centers. However, managing these systems independently can lead to fragmented oversight, making it challenging to identify and resolve issues efficiently.
For NOC administrators, the ability to gain a unified, consolidated view of their entire infrastructure is essential. This centralized perspective enables them to pinpoint bottlenecks quickly and troubleshoot problems in an interconnected and complex web of systems, ensuring smooth operations and minimizing downtime.
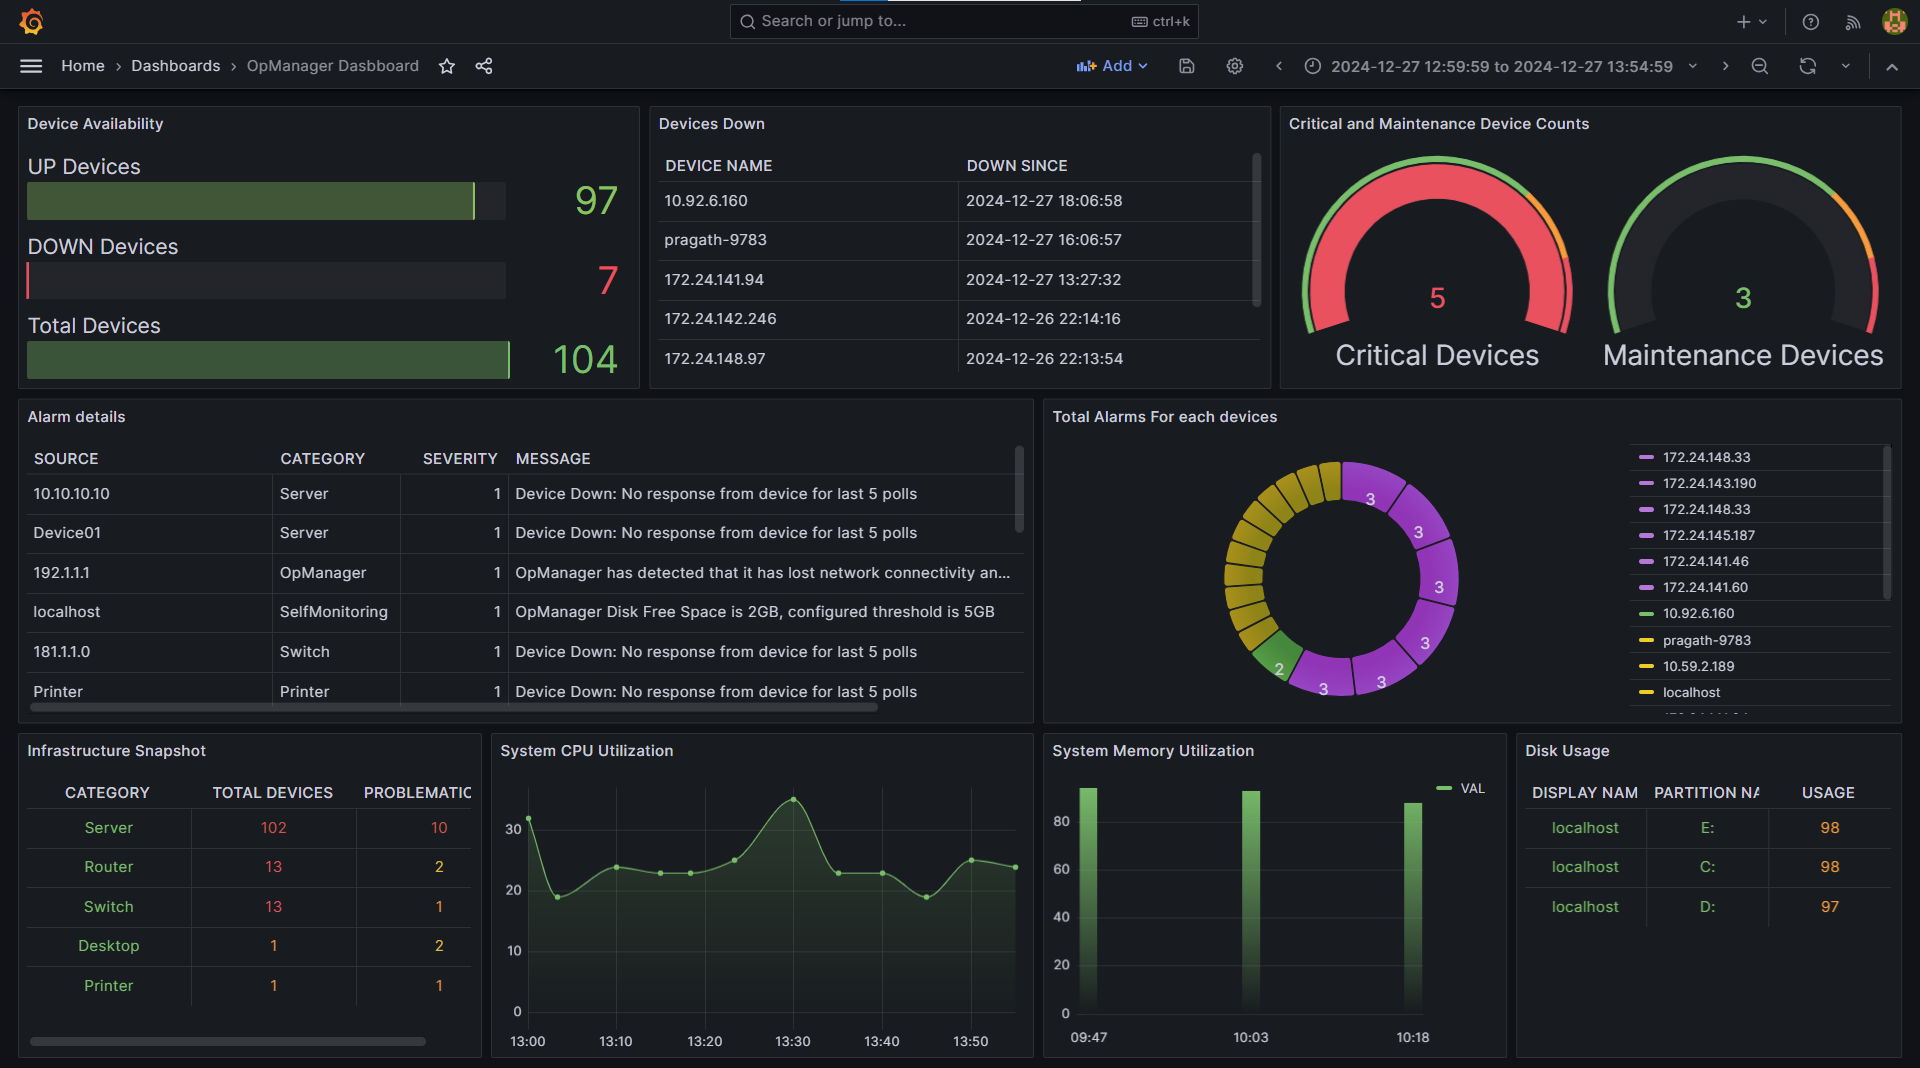
OpManager’s integration with Grafana, an open-source platform for monitoring and observability, effectively addresses these challenges. Grafana offers powerful tools to create interactive, visually rich dashboards that provide a clear overview of system performance. By seamlessly integrating with a wide variety of data sources, it enables IT teams to:
- Visualize real-time network metrics.
- Analyze historical trends for informed decision-making.
- Set up actionable alerts—all within Grafana's intuitive interface.
Understanding the OpManager-Grafana integration
Data collection and storage
OpManager continuously monitors your IT infrastructure, gathering detailed performance metrics across multiple layers:
- Servers: Metrics like CPU utilization, memory usage, disk I/O, and more.
- Network devices: Bandwidth usage, latency, packet loss, and other network health indicators.
- Applications: Response times, availability, error rates, and related metrics.
- Virtual environments: Resource consumption, VM performance metrics, and virtualization insights.
All this data is stored in OpManager’s internal database, where it is readily available for querying and visualization.
Data access and retrieval
To bring this data into Grafana:
- Database connection: Establish a direct connection between Grafana and the OpManager database.
- Data source configuration: Configure a data source in Grafana by specifying the database type (e.g., MSSQL), server address, credentials, and connection settings. Kindly note that only MSSQL database is supported now.
- SQL queries: Write custom SQL queries directly in Grafana to fetch the specific metrics you need. Grafana executes these queries to extract relevant data for visualization and analysis.
Dashboard creation and visualization
With Grafana’s intuitive interface, IT teams can design interactive dashboards tailored to their monitoring needs:
- Drag-and-drop design: Quickly add panels and arrange them for an optimal view of your data.
- Diverse visualization options: Choose from graphs, charts, tables, maps, heat maps, and more to represent your data effectively.
- Custom data queries: Refine your data visualizations by writing specific queries for precise insights.
Key advantages of integrating OpManager with Grafana
Integration with Grafana empowers IT teams to gain actionable insights, proactively address issues, and optimize their network infrastructure. Key benefits include:
1. Advanced visualization
- Highlight critical KPIs, such as CPU and memory utilization or device status.
- Group related metrics into cohesive views for easy monitoring of multiple sites or devices.
- Use heat maps to track geographical network performance and pinpoint congestion.
- Cross-reference network and application data for deeper context.
2. Historical data analysis
- Identify trends and recurring issues for data-driven decision-making.
- Forecast future network demands and plan infrastructure scaling proactively.
3. Enhanced troubleshooting and decision-making
- Pinpoint root causes quickly, reducing downtime, and improving network stability.
- Visual dashboards help identify issues like server overload or API delays, enabling quicker fixes.
- Proactive monitoring reduces downtime, ensuring seamless customer interactions.
- Insights guide infrastructure upgrades and network optimizations aligned with business growth.
Learn more about how to integrate OpManager with Grafana here. Download OpManager to get a free, hands-on experience. Or, schedule a personalized demo with our product experts.