In OpManager, performance data from monitors are archived periodically and stored in the database. To display this data in various graphs in the Device & Interface Snapshot pages (navigate to the Inventory → Devices/Interfaces and click on the device/interface name), and to control the granularity of data used in these graphs, users have to configure suitable values in the Graph Display Settings page.
Users can adjust the appearance and functionality of the graphs to meet their specific needs. To do so, navigate to Settings->General Settings->Graph Display settings. Below is a summary of the key features available for configuration:
The "Detailed", "Hourly" and "Daily " fields can be used to configure the limits while using each level of data. These values can and must be configured only in increasing order, in the same sequence as mentioned above. The values configured here will work in combination with the data retention periods configured in the Database Maintenance page to display the graph data for the users.
The minimum, maximum and default values for different fields in this page are as below:
| Statistic type | Minimum no. of days | Maximum no. of days | Default value in Graph Display settings |
|---|---|---|---|
| Detailed | 2 | 31 | 7 |
| Hourly | "Detailed" value + 1 | 60 | 31 |
| Daily | "Hourly" value + 1 | 365 | 180 |
Example: If the data retention period for Detailed Statistics is set to 10 days in the Database Maintenance page, and if the equivalent value in Graph Display Statistics is set to 7 days, then the user can view graphs based on Detailed Statistics for any 7-day window in the last 10 days.
The Forecast section allows you to configure the number of past days’ hourly archived data used to analyze historical trends and predict future performance. The default is 28 days.
No. of days of hourly archive data used for forecast: The number of past days’ hourly archived data used to predict forecasts.
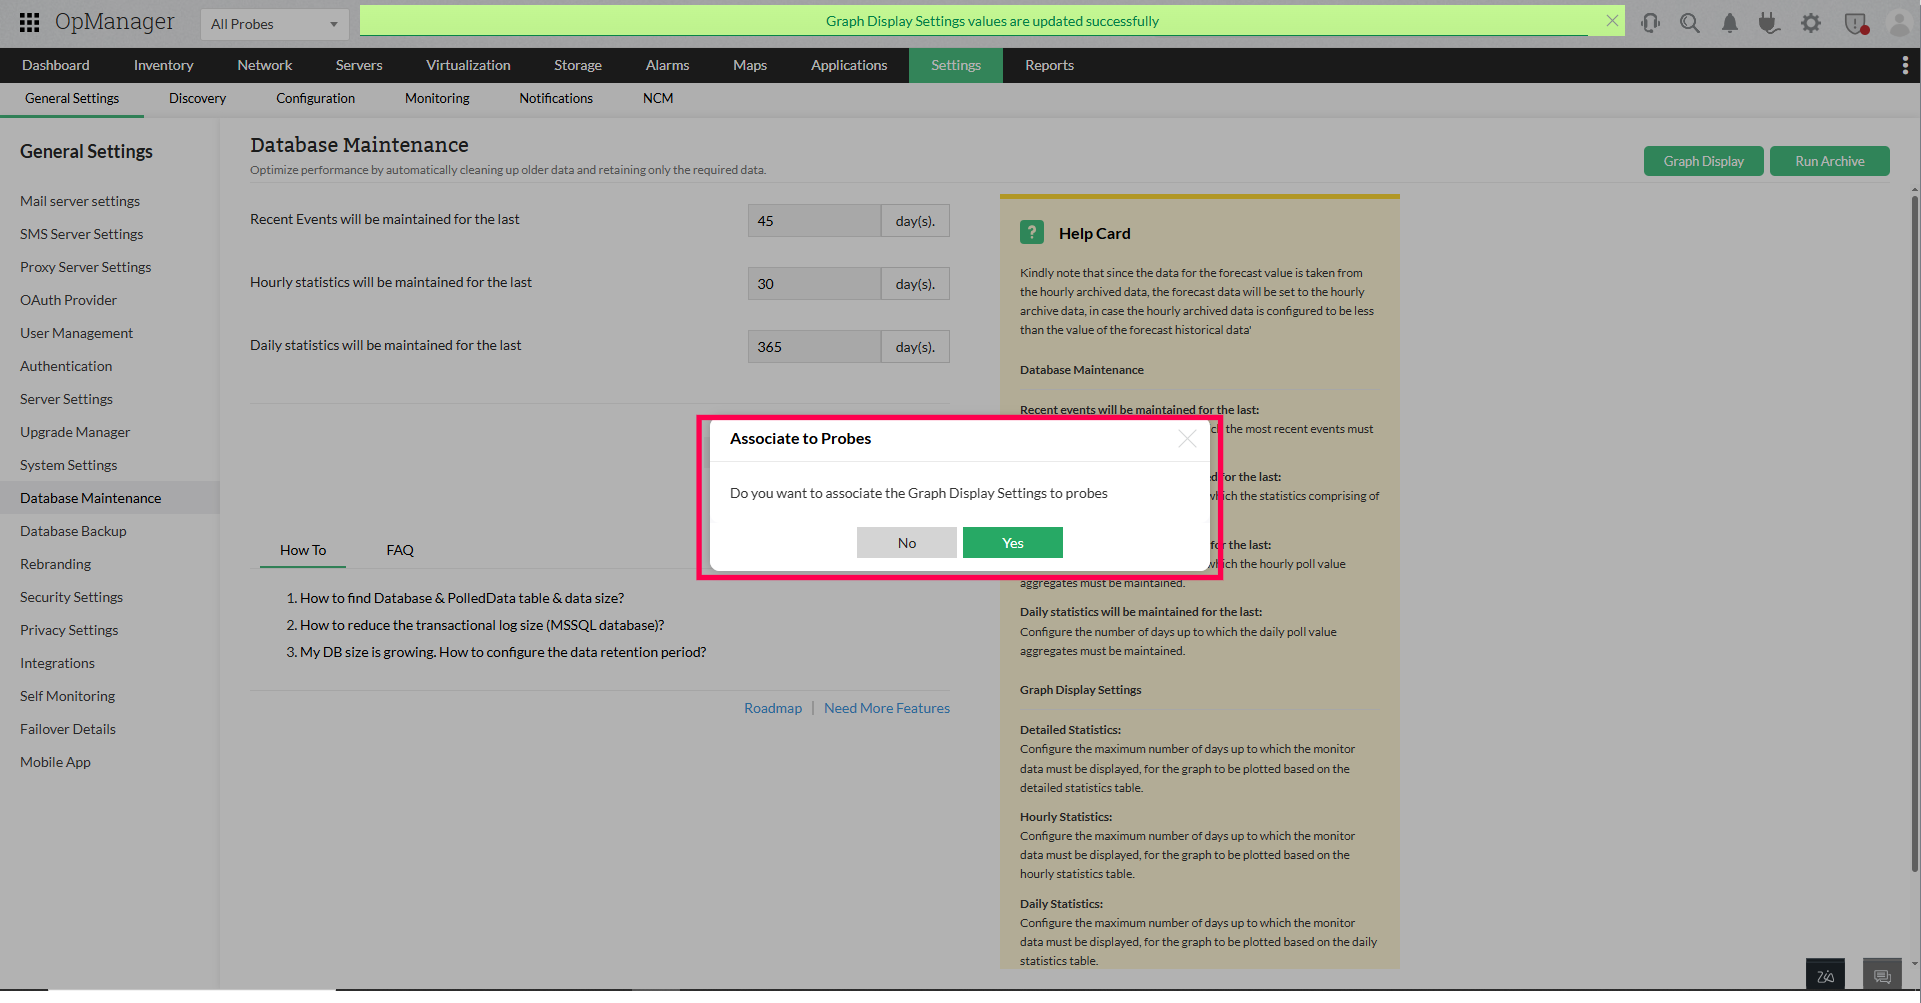
In OpManager Enterprise Editions, graph display preferences—such as chart styles, time ranges, and data intervals—can now be uniformly applied across all Probes.

Thank you for your feedback!