Reports
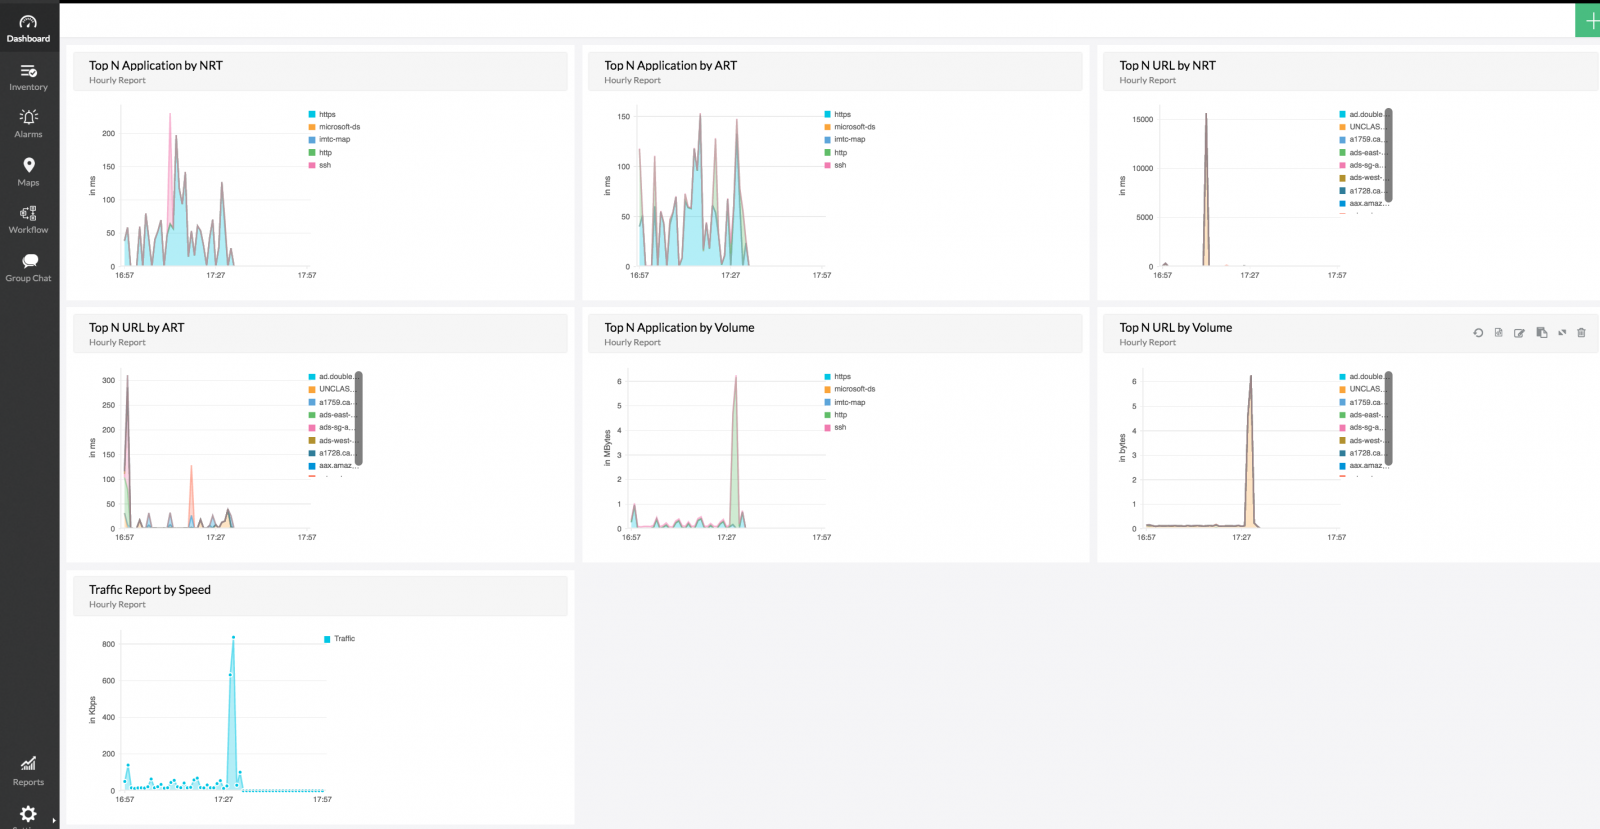
DPI widgets can be accessed from default dashboard under DPI tab. Custom dashboard can also be created using DPI related widgets.
To access reports from UI, navigate to Reports > DPI. Here we have 2 types, Online/Offline reports. Online reports are generated from embedded in-built database. You can also have the packets captured in PCAP format and generate reports for the same.
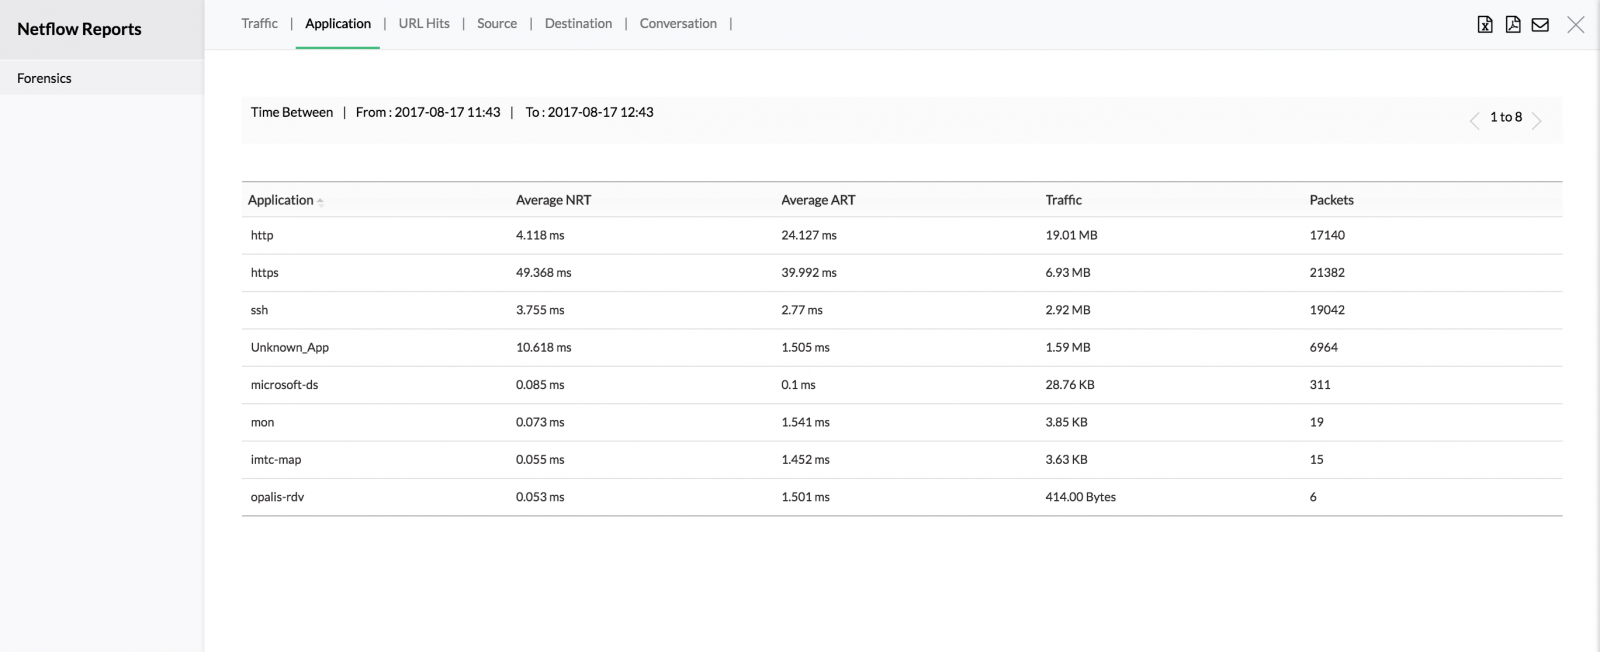
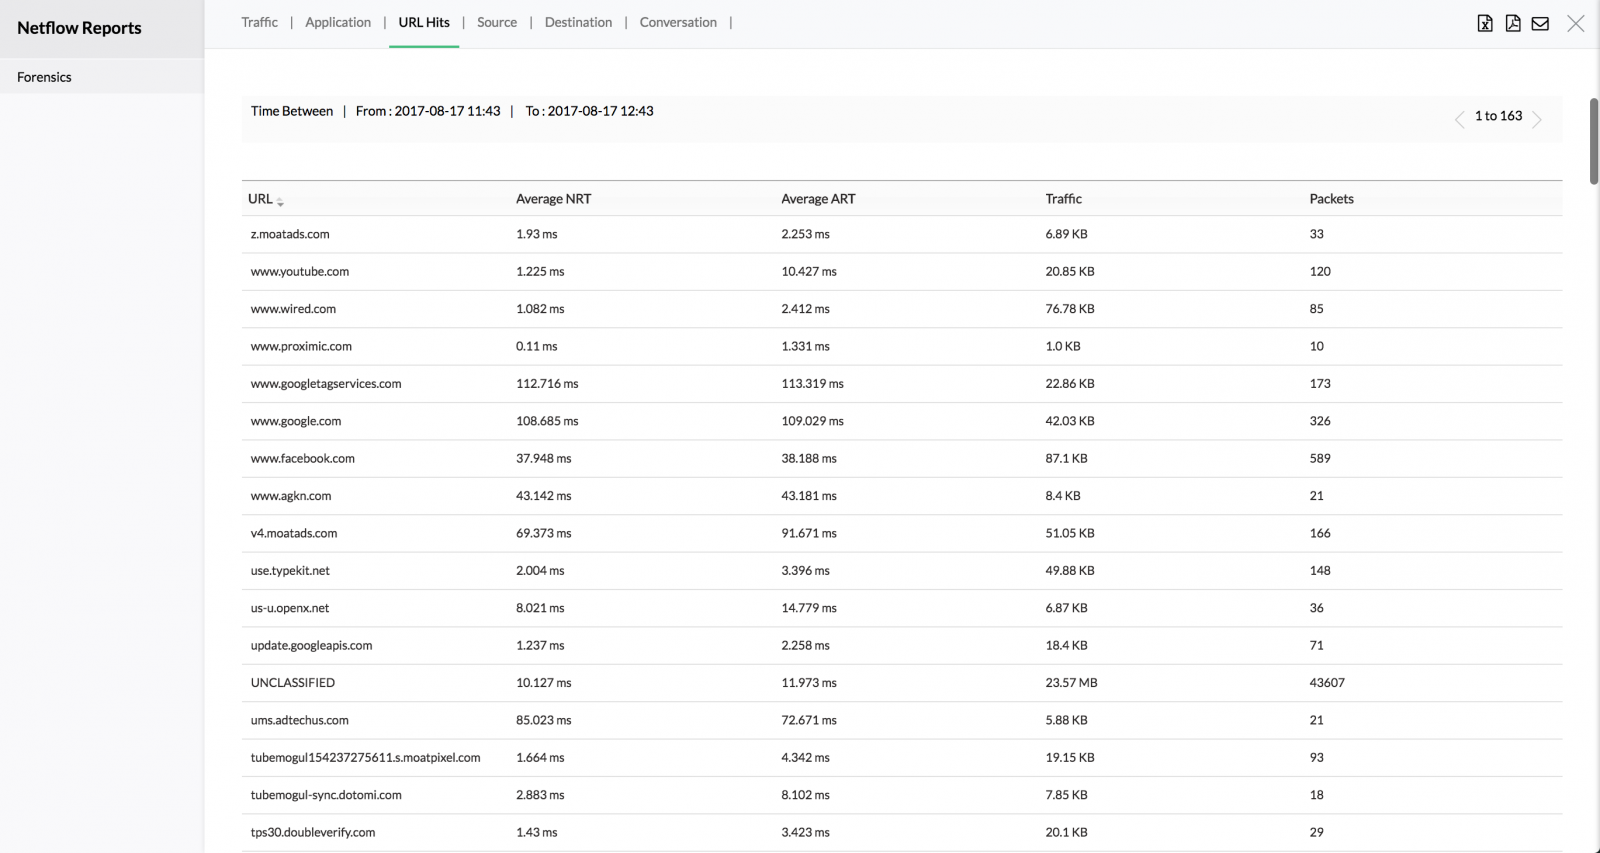
Manageengine DPI reports are based on Time and criteria. DPI reports are mainly concentrated on 3 metrics URL, NRT, ART.
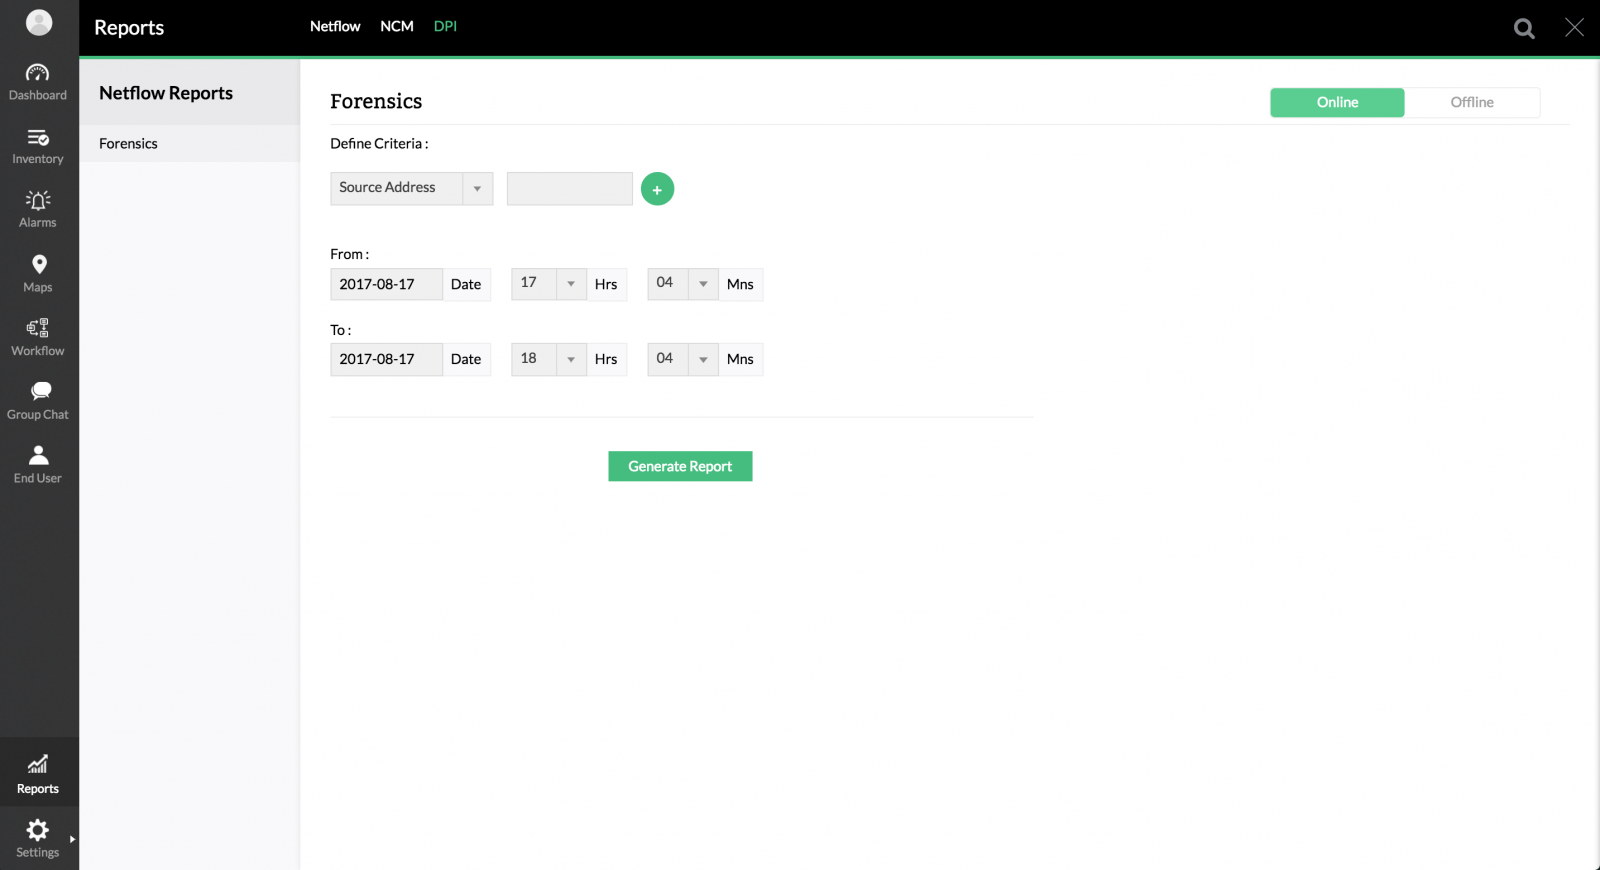
Criteria can be none or any or multiple of the list.
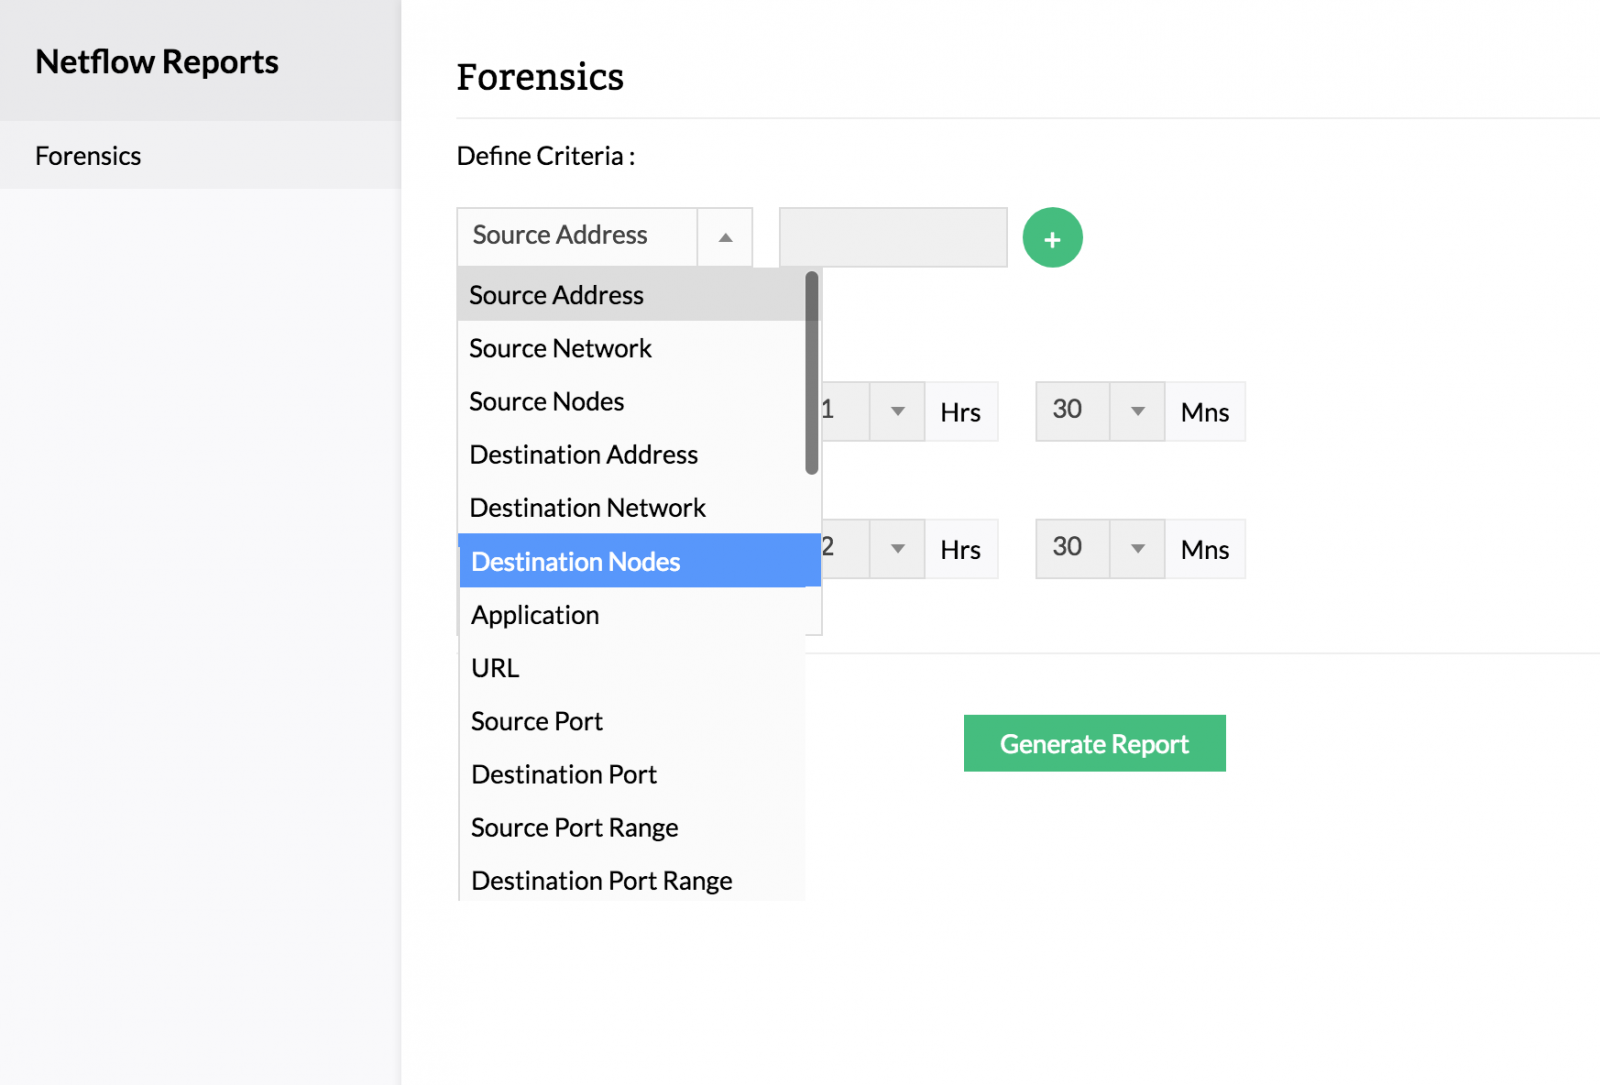
Next the time period should be within the DPI data storage time period.
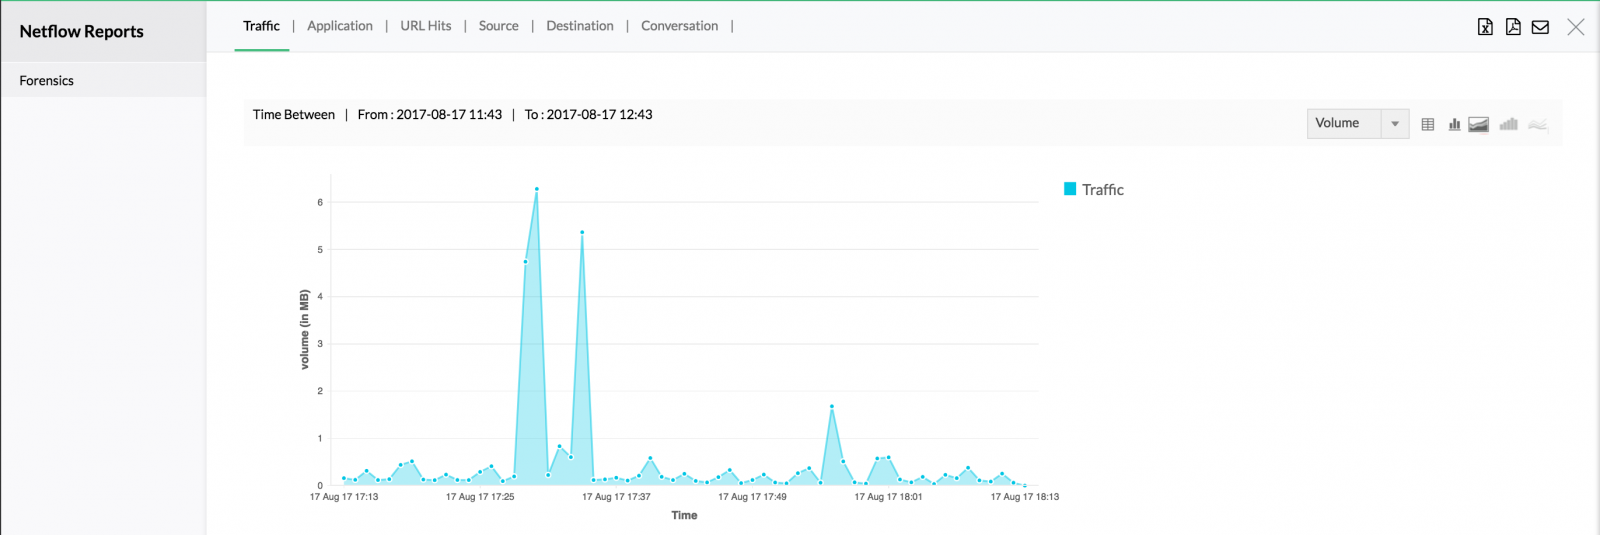
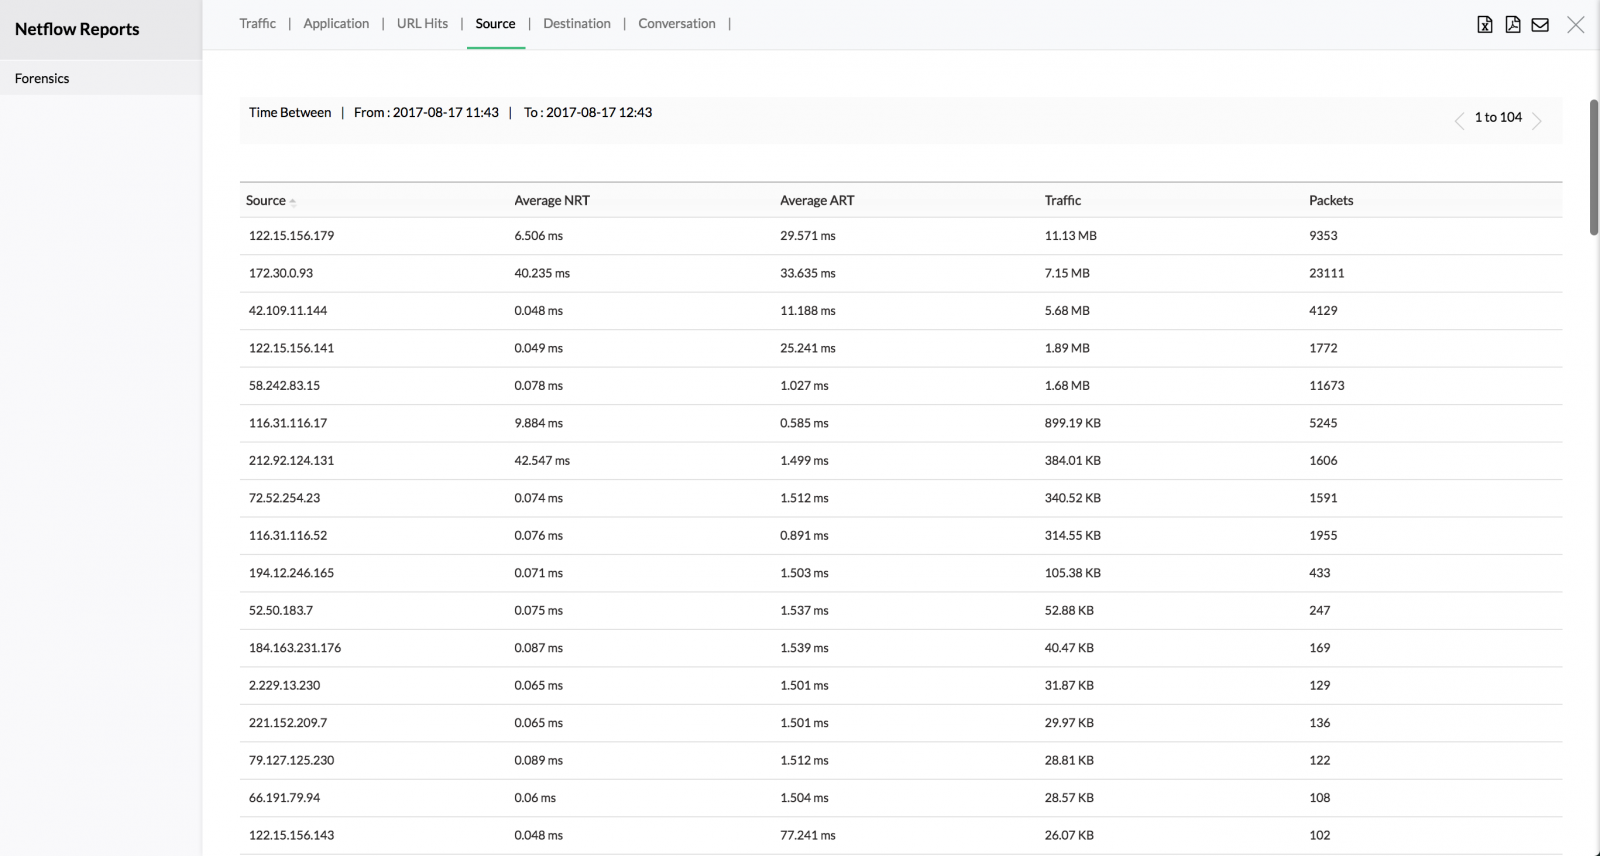
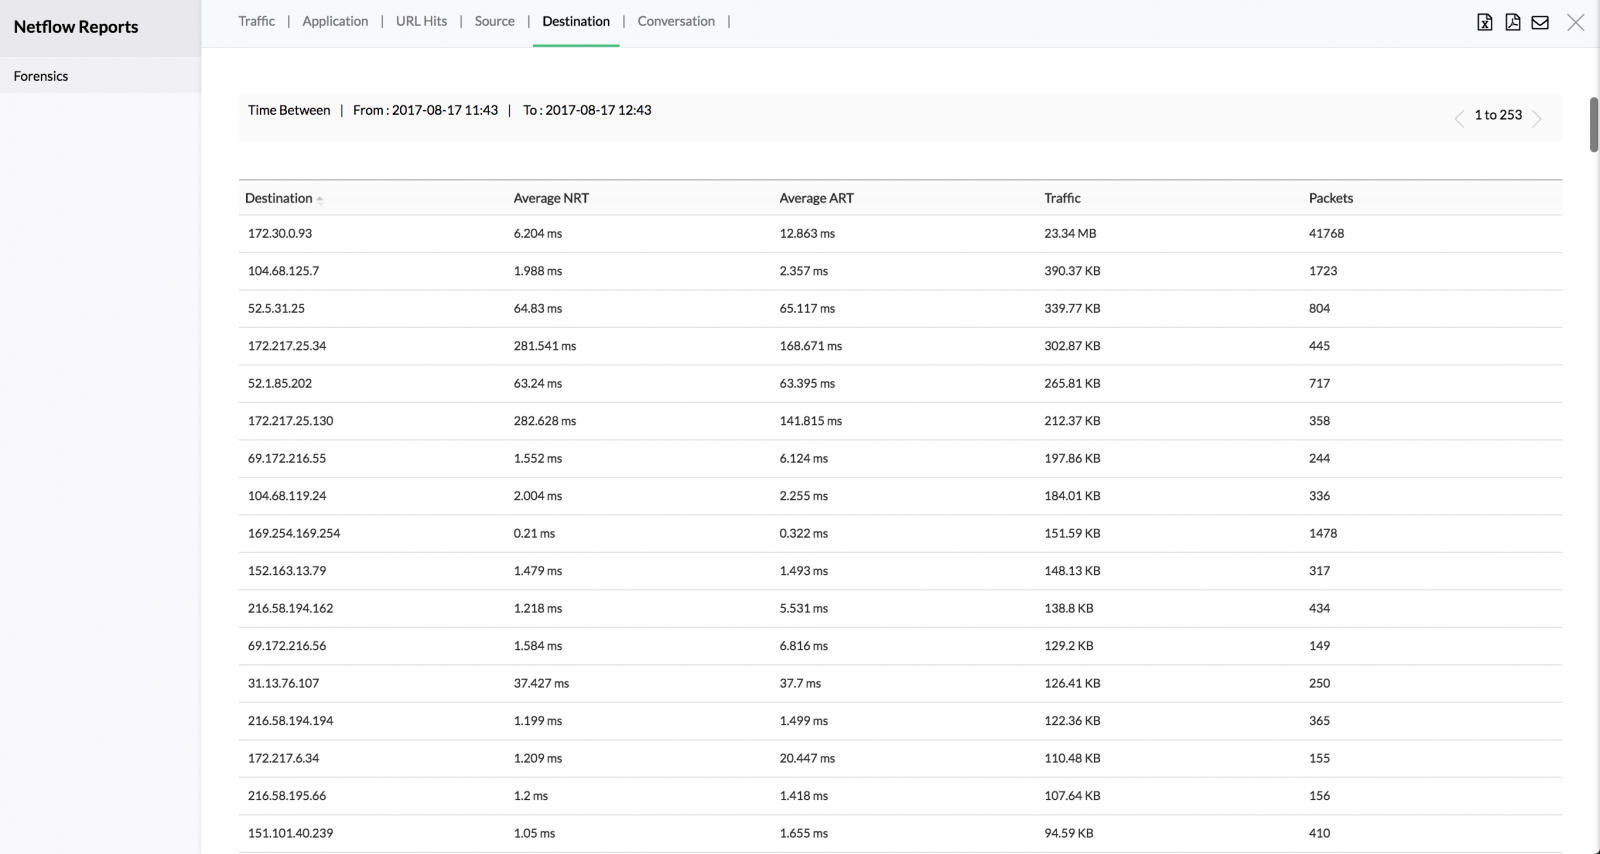
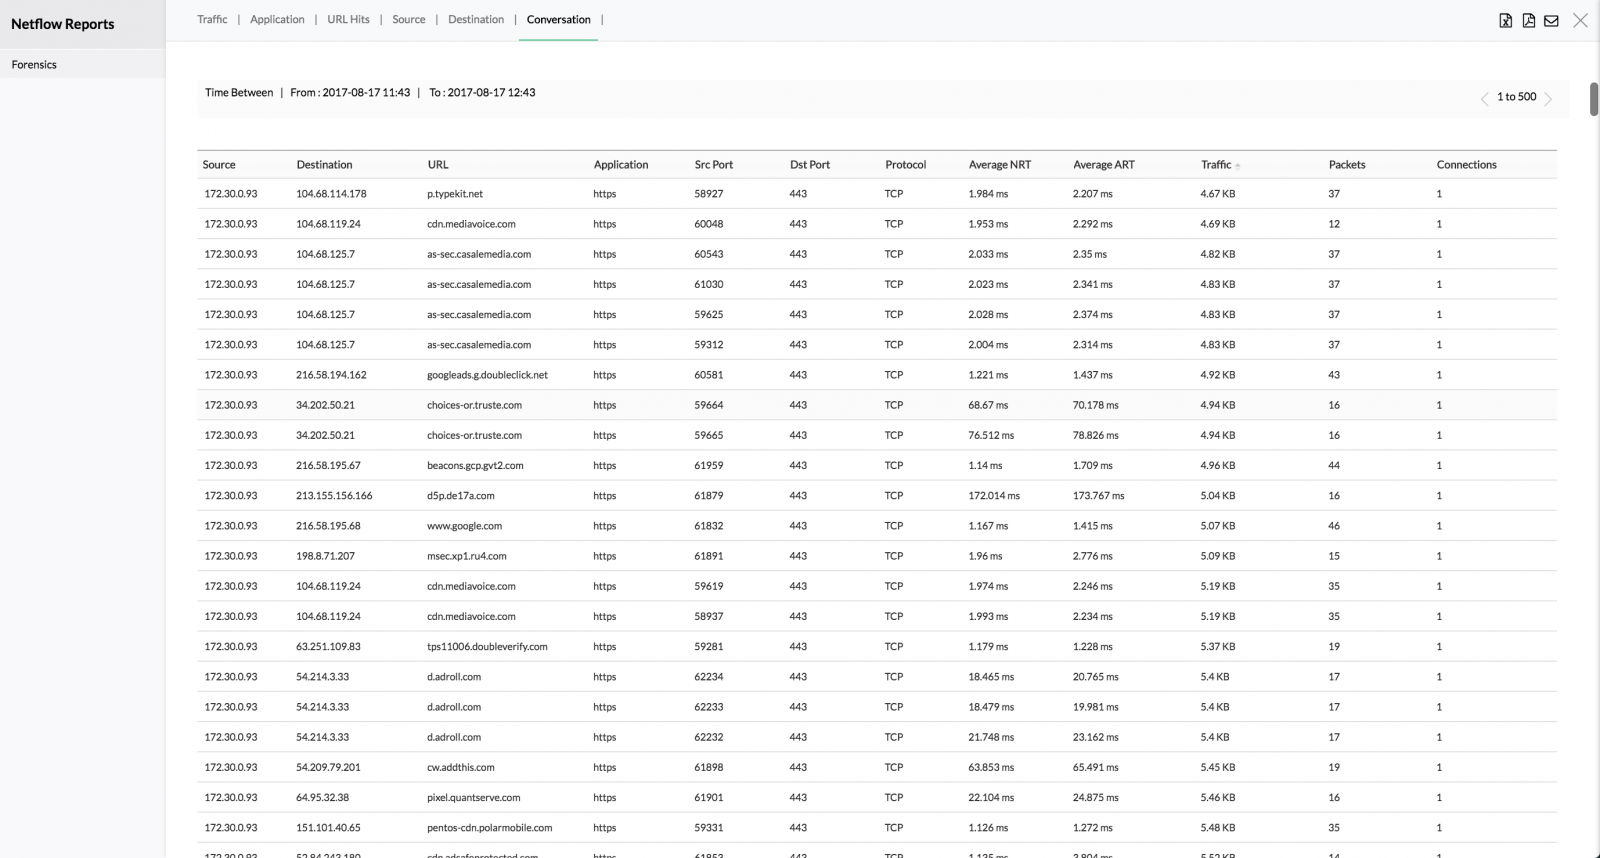
When you generate reports , you can see reports based on Traffic, Application (Layer 4), URL hits , Source, Destination, Conversation.
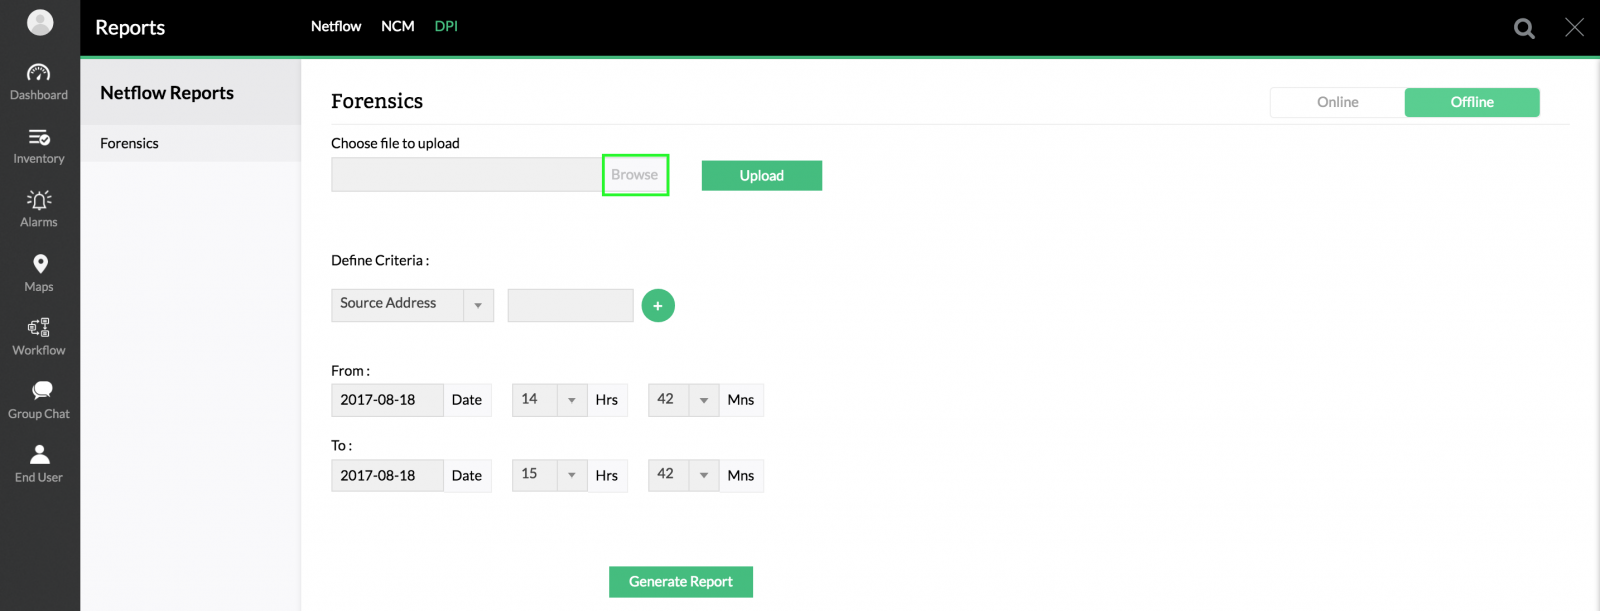
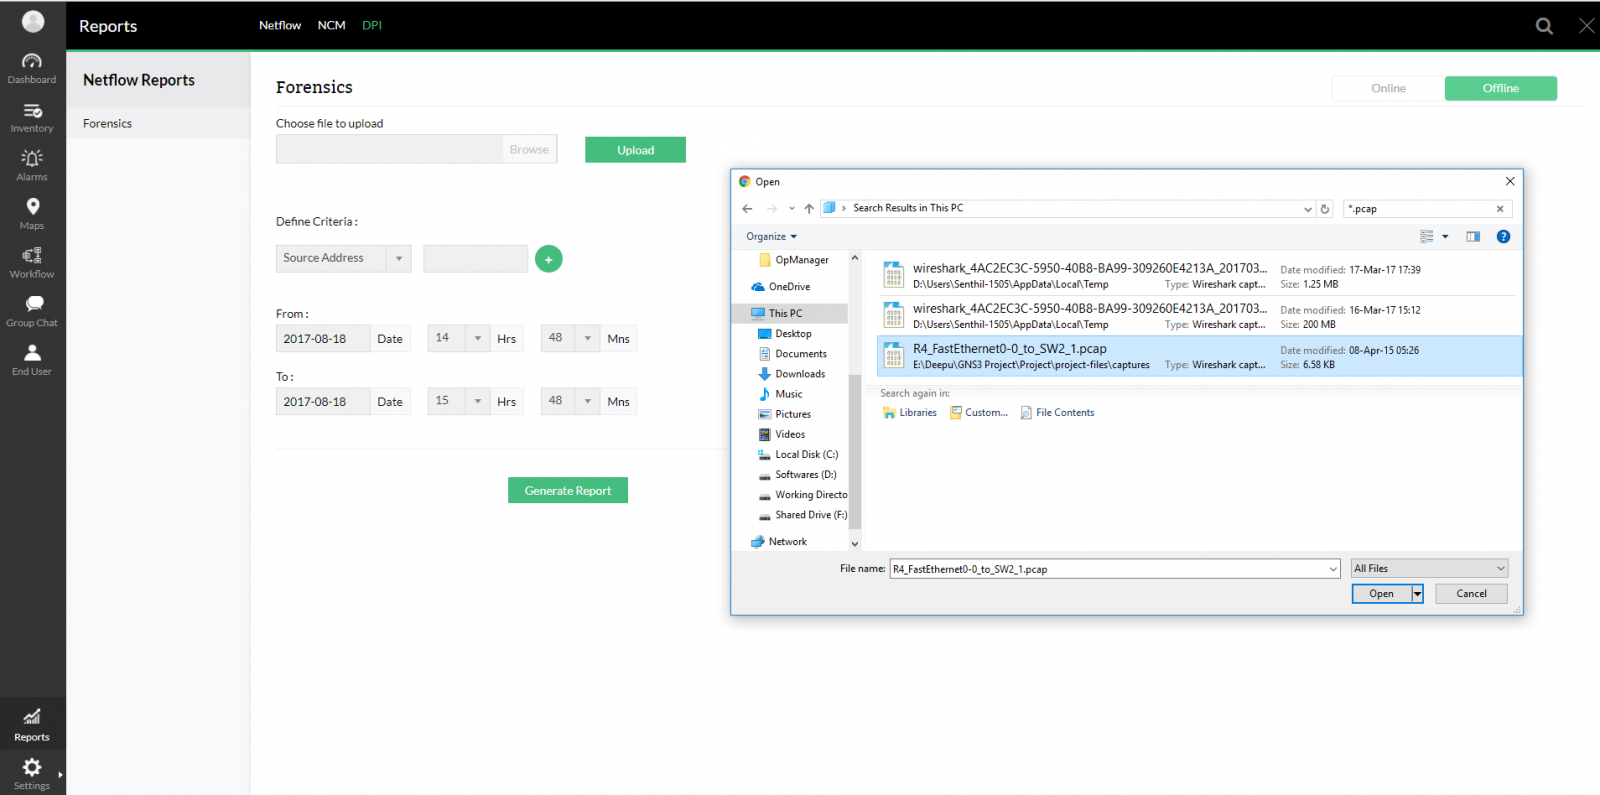
Offline Reports
Here we also have offline reports where you can save the captured packets (in PCAP format) saperately and generate the same above graphs.
