Monitoring VMware ESX/ESXi servers
OpManager Plus monitors your VMware servers for availability and performance using native APIs. The advantage of using native APIs is that it does not require any agent to be installed on your servers. Moreover, it enhances the usability and offers in-depth monitoring capabilities to troubleshoot your Virtual Infrastructure.
Some of the highlights of monitoring VMware Servers with OpManager Plus:
- Supports ESX/ESXi 4.0 to latest version 5.1
- Monitors effective utilization of critical resources like CPU, Memory, Network and Disk
- Supports monitoring of hardware health such as temperature, voltage, power, fan speed, status of processors etc. via API.
- Out-of-the-box 70 plus reports on Host and VMs
- Automatically maps the VMotioned VMs to the corresponding Hosts
Apart from monitoring the Hosts and VMs, OpManager Plus also monitors the Key Performance Indicators (KPIs) of guest OSs. Similar to that of any Windows or Linux server, OpManager Plus monitors the applications, Windows & TCP services, processes running on the VMs using WMI/SNMP.
Pre-requisites for monitoring VMware ESX/ESXi Servers
- HTTPS User Name and Password: As OpManager Plus uses native APIs to monitor the VMware servers, it requires https username and password of the Host server to poll the performance data. Provide the correct https username and password when discovering the Host.
- VMware Tools (optional): We recommend that you install VMware tools on the VMs. In general, VMware tools improve the performance of the Virtual Machine. Moreover, they offer IP address of the VMs, which helps OpManager Plus to automatically discover them. Click here to know the procedures for installing VMware tools.
Discovering VMware ESX/ ESXi servers in OpManager Plus
To discover the host and the VMs, you just need to provide the IP Address and https credentials of the vCenter/ Host. When you provide the vCenter credentials, all the host and VMs managed by that particular vCenter will be discovered. In-case of providing the Host credentials, the host along with its VMs are discovered.
Steps to discover the Host and VMs
Before proceeding ensure that you have configured the VMware credentials for the vCenter/ Host, and SNMP and WMI credentials for the VMs in the Credential Library. To configure the credentials
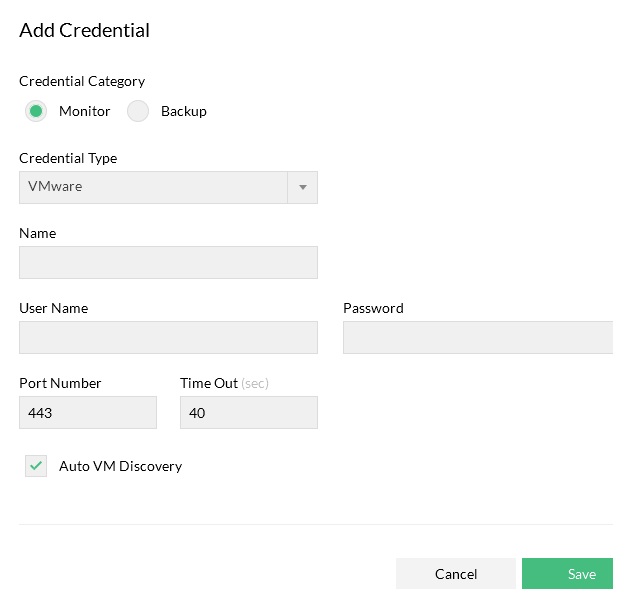
- Go to Admin-> Discovery ->Credential Settings and click Add Credential.
- Select VMware as the Credential type and enter the vCenter/ Host Name and its HTTPS Username and Password.
- Enter the HTTPS web service port number and timeout interval for the connection between the vCenter/ Host and OpManager Plus server.
- Click Save to add the credential.
Similarly, add the credentials for the VMs. Select the Credential Type as WMI for Windows and SNMP for non-Windows OS.
To discover the vCenter/ Host:
- Go to Admin-> Discovery-> Add Device.
- Enter the Device Name / IP Address.
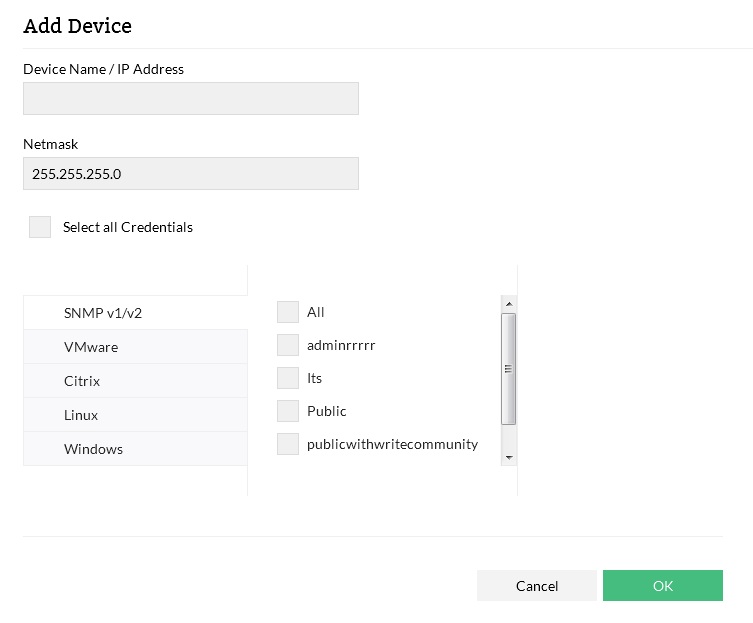
- Enter the correct Netmask and select the appropriate credentials.
- Click OK button to add the vCenter/ host.
If any of the VMs are already discovered or added, OpManager Plus automatically maps them as Virtual Device.
Note: If the device has been added successfully, but not displayed under the Virtual Devices, search for that device. Upon finding the particular device, Go to its snapshot page and look for the device type. If it is mentioned as ‘unknown’, wrong credentials might have been provided or it is not reachable during discovery. Provide the correct credentials and click on ‘Rediscover Now’ present under three line menu at the top right corner in the snapshot page, to discover it as an ESX host.
Configuring VM IP Address
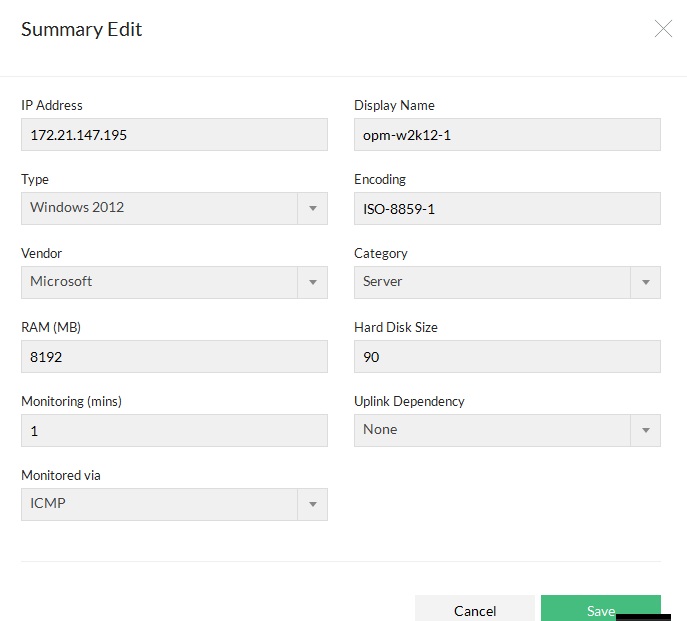
OpManager Plus, with the help of installed VMware Tools, identifies the IP address of the VM and maps it to the host. In case the VMware Tools are not installed, OpManager Plus discovers it using VM's entity name. You can assign the IP address for such VMs in the host snapshot page. Click on the Edit device details present under three line menu icon at the top right.
Manage or Unmanage VMs
You can now choose to monitor only the required VMs on a Host. OpManager Plus discovers all the VMs during the initial discovery and you will find them listed under the inventory in the host snapshot page. Select the relevant icon to monitor the required VMs on the host. OpManager Plus maintains this configuration when a HA, VMotion, or rediscovery happens.
Monitoring VMware ESX servers
All the discovered hosts and VMs are mapped under 'Virtualization' tab in the inventory section. Click on Virtualization ink to access the dashboard page, which provides a quick glance of your critical resources such as CPU, Memory, Network & Disk that are under pressure. Though ideal resource utilization is the key benefit we get from virtualization, it can lead to other problems because it is shared among the servers. Even if a single system has a resource crunch, it hugely affects the performance of the other systems running on the same host. Quickly identifying and fixing the resource utilization problems is therefore vital for a business to run smooth.
OpManager Plus shows the top hosts and VMs by resource utilization and the recent alarms raised. Click on the host or the VM name to see its snapshot page. The Virtual Devices Dashboard page refreshes automatically every 5 minutes to reflect the latest collected statistics.
Listed below are the various types of top resource utilization widgets to quickly identify any over utilized resource. It gives a quick glance on systems which are the top consumers of CPU, Memory, Network, Disk I/O and Disk Space.
| Top VMs | Top Hosts |
|
|
Snapshot page of a Host
Snapshot page of Host / VM provides a summary of the current statistics, recent alarms, configuration details such as VMs inventory, resource allocation for each VM, Network Adapters, HBA list and Datastores.
Host Details and Performance Charts
In this section you can find the Host details like IP Address, Vendor of Host, CPU Cores etc. on the left side. The right side gives a quick glance on performance data like CPU Utilization, Memory Utilization, Disk I/O Usage etc., collected during the last poll. These values are collected at an interval of 5 minutes. These data help you determine the current performance of the Host.

Host Heath At-a-Glance
This section provides the last one hour performance chart of the Host. You can view the reports of last 7 or 30 days. Click on 7 or 30 link available on the top right corner to view the last 7 or 30 days performance report respectively.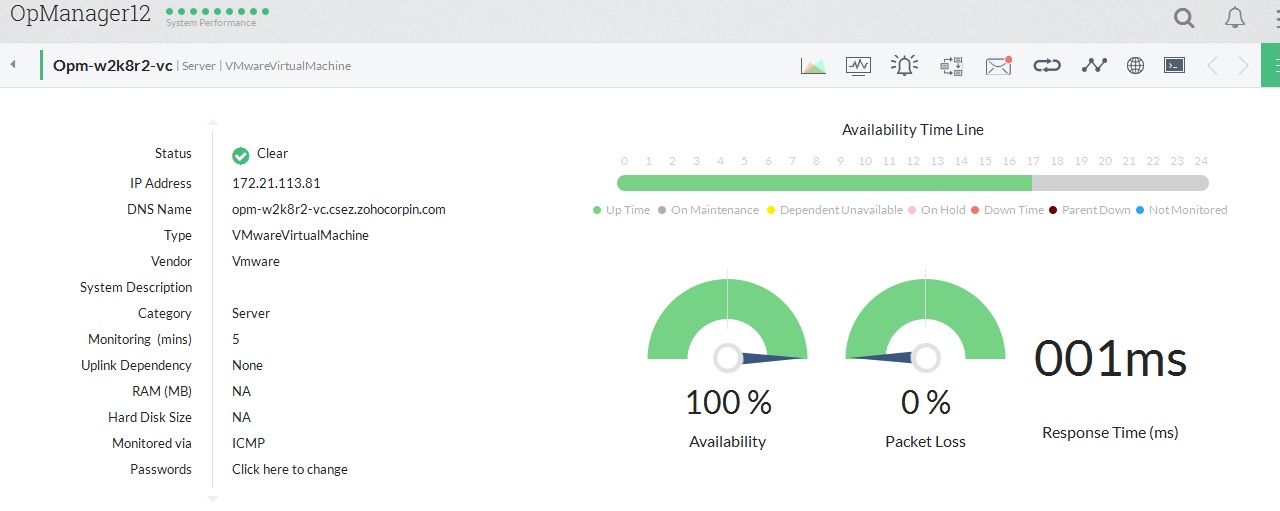
VM List & Resource Allocation Details
This section lists all the VMs on the Host, resources allotted to each VM, network adapters, storage adapters and datastore details. Any change in the inventory, gets updated automatically. You can also find the monitors that are enabled on the Host and notification profiles associated to it. Click on the respective tab to view its details.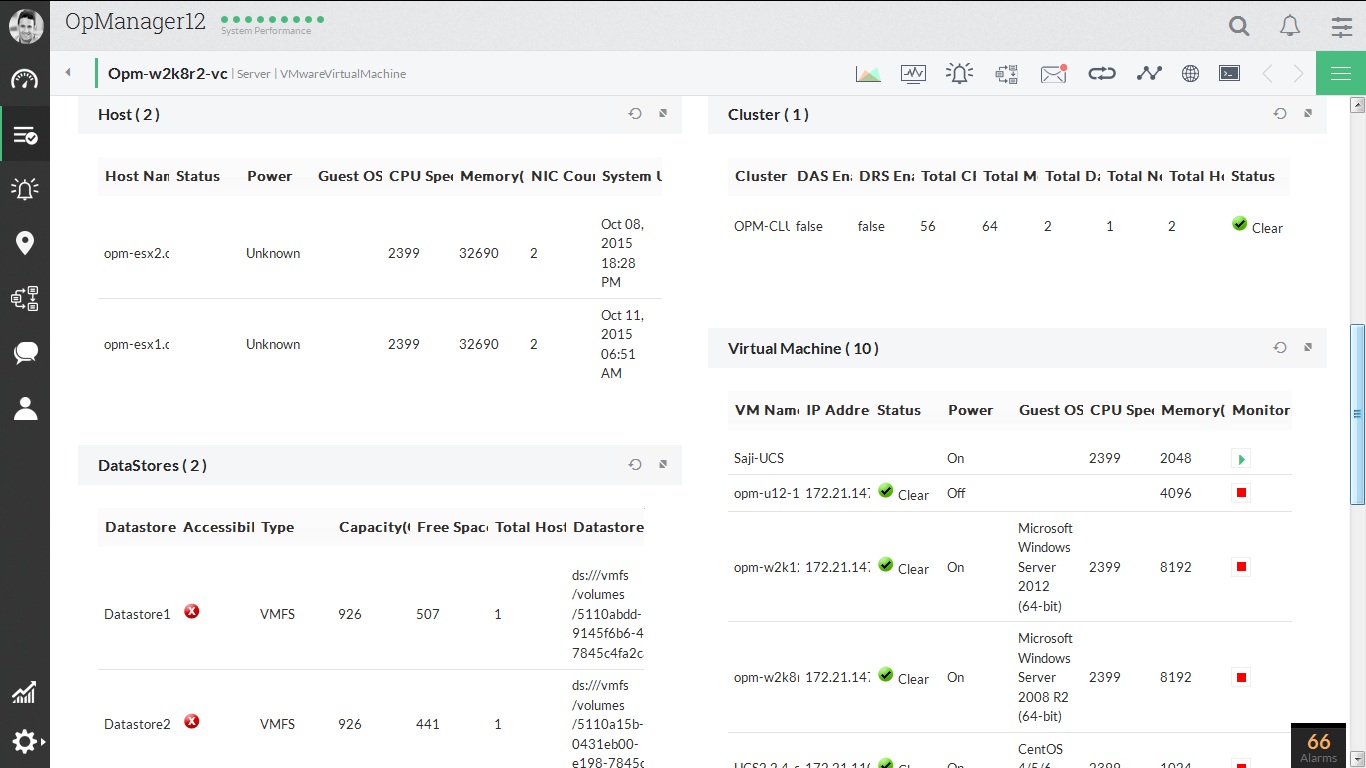
Click on the VM name to see its snapshot page. The snapshot page of the VM is similar to that of any Windows or Linux Server's snapshot page.
Configuring Thresholds for VMware ESX and VMs
OpManager Plus out-of-the-box offers monitoring templates for ESX hosts and VMs. The templates help you configure thresholds for multiple ESX hosts and VMs at one shot. For each performance metric you can configure Warning Threshold as well as Error Threshold, and receive proactive alerts if they are violated.
To configure the threshold value and apply the template
- Go to Admin-> Monitoring -> Device Templates.
- You can find the VMware ESX/ESXi and VMware Virtual Machine templates for the hosts and VMs respectively. Click on the required template.
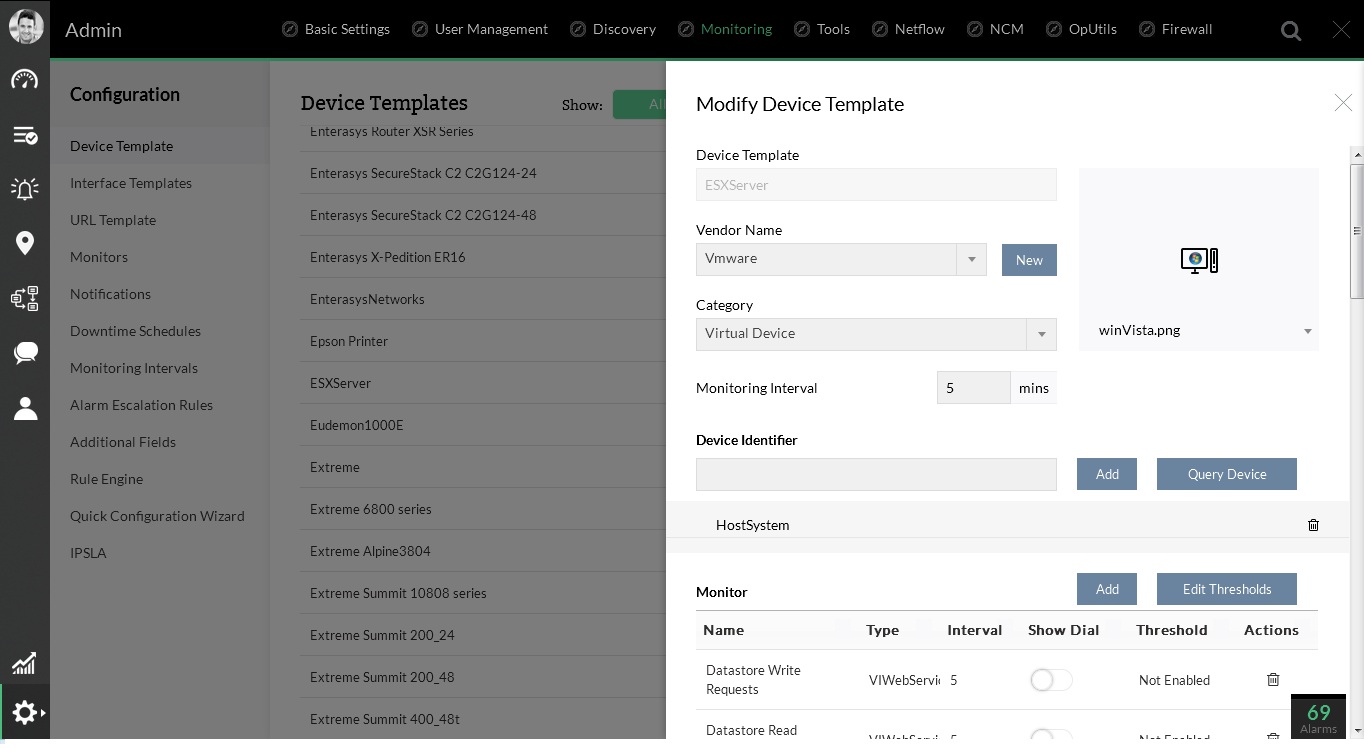
- Click on 'Edit thresholds' to enable or disable the threshold, and to modify Warning Threshold, Error Threshold and Rearm Values.
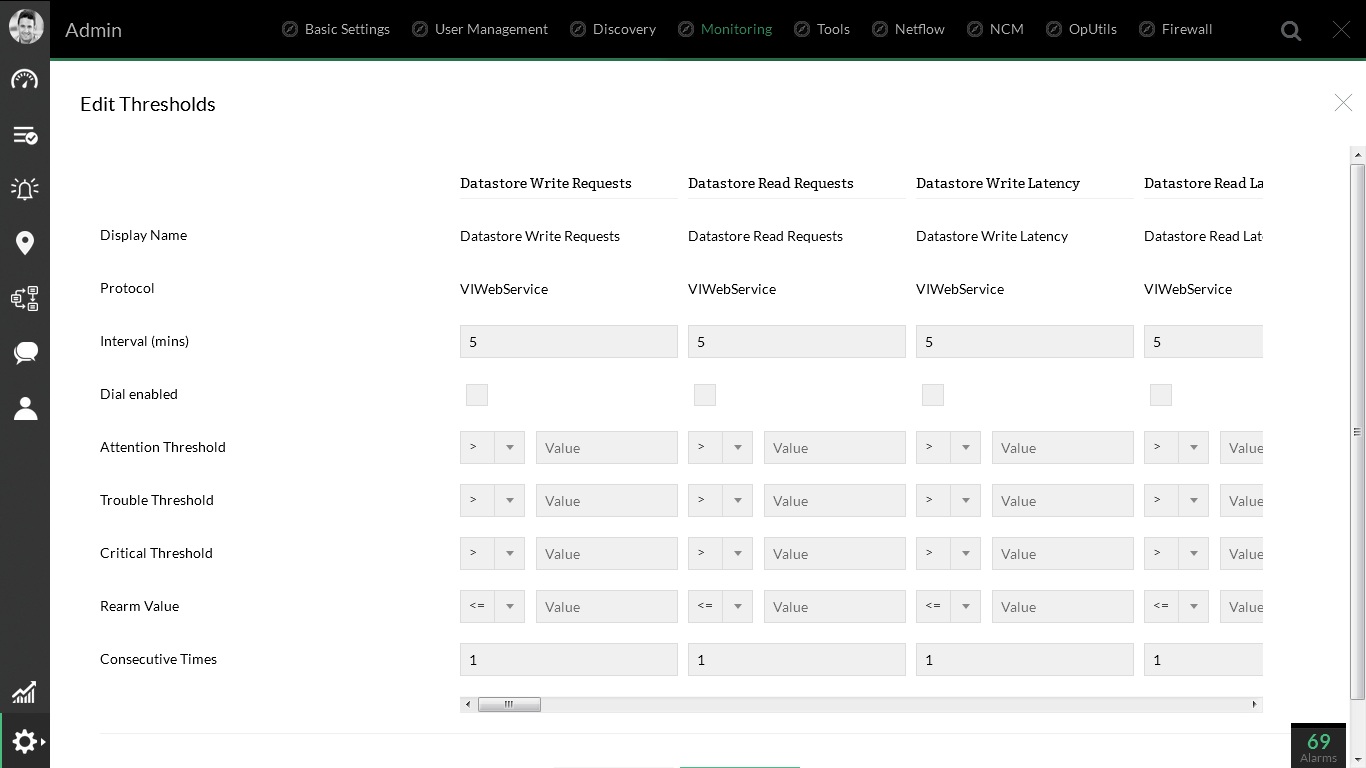
- Click OK.
- Click Associate for the devices to inherit the configurations in the template. While associating the template, click on Apply & Overwrite for the devices to remove the old and add the new configurations in the template.
Note: To edit the threshold values of a single ESX host, go its snapshot page and click the Monitors icon at the top. Click on the Edit icon of a monitor to edit its threshold values.
Managing VMware Alerts
OpManager Plus fetches events from each ESX Host, similar to SNMP traps. Currently we support important events, and this list is updated every release. Apart from host events, OpManager Plus also monitors threshold for critical performance indicators and raises alerts. The complete list of threshold violation alerts and supported events are shown below in Table 1 and Table 2 respectively.
To change the pre-set threshold values for each performance monitor, go to the snapshot page of the host or VM. Check for Monitors-> VM Performance Monitors. All the VM specific performance monitors are grouped under 'VM Performance Monitors'.
Table 1: List of Threshold Monitors for critical performance indicators supported by OpManager Plus
| S.No. | Threshold Monitors | Virtual Device Type | Resource | Severity |
| 1. | Host connection Status | Host | General | =2 (notresponding) - Critical =1 (disconnected) - Warning |
| 2. | Host Data Received (avg) | Host | Network | >1000000 KBps - Critical >800000 KBps - Warning |
| 3. | Host Data Transmission (avg) | Host | Network | >1000000 KBps - Critical >800000 KBps - Warning |
| 4. | Host Network Usage (avg) | Host | Network | >4000000 KBps - Critical >3600000 KBps - Warning |
| 5. | Host CPU Utilization (avg) | Host | CPU | > 90% - Critical > 85% - Warning |
| 6. | Host Memory Utilization (avg) | Host | Memory | > 90% - Critical > 85% - Warning |
| 7. | Host Disk Read Latency | Host | Disk | > 50ms - Critical > 45ms - Warning |
| 8. | Host Disk Write Latency | Host | Disk | > 50ms - Critical > 45ms - Warning |
| 9. | Datastore Freespace | Host | Network | < 5GB - Critical < 10GB - Warning |
| 10. | VirtualMachine Data Received (avg) | VM | Network | >125000 KBps - Critical >100000 KBps - Warning |
| 11 | VirtualMachine Data Transmitted (avg) | VM | Network | >125000 KBps - Critical >100000 KBps - Warning |
| 12. | VirtualMachine Network Usage (avg) | VM | Network | >250000 KBps - Critical >200000 KBps - Warning |
| 13. | VirtualMachine CPU Usage (avg) | VM | CPU | > 90% - Critical > 85% - Warning |
| 14. | VirtualMachine Memory Usage (avg) | VM | Memory | > 90% - Critical > 85% - Warning |
Table 2: List of ESX hosts' events supported by OpManager Plus
| S.No. | Events | Virtual Device Type | Severity |
| 1. | VmFailedToPowerOffEvent | VM | Major (Cleared on event 2 or 3) |
| 2. | VmPoweredOffEvent | VM | Clear |
| 3. | VmPowerOffOnIsolationEvent | VM | Clear |
| 4. | VmFailedToPowerOnEvent | VM | Major (Cleared on event 5) |
| 5. | VmPoweredOnEvent | VM | Clear |
| 6. | VmFailedToSuspendEvent | VM | Major (Cleared on event 7) |
| 7. | VmSuspendedEvent | VM | Clear |
| 8. | VmFailedToRebootGuestEvent | VM | Major (Cleared on event 9) |
| 9. | VmGuestRebootEvent | VM | Clear |
| 10. | VmFailoverFailed | VM | Critical (Cleared on event 11) |
| 11 | VmPrimaryFailoverEvent | VM | Clear |
| 12. | VmUpgradeFailedEvent | VM | Major (Cleared on event 13) |
| 13. | VmUpgradeCompleteEvent | VM | Clear |
| 14. | VmDisconnectedEvent | VM | Warning (Cleared on event 15) |
| 15. | VmConnectedEvent | VM | Clear |
| 16. | VmDiskFailedEvent | VM | Major |
| 17. | VmRelocatedEvent | VM | Clear |
| 18. | VmRelocateFailedEvent | VM | Critical (Cleared on event 17) |
Notifying VMware Alerts
Notification profiles help you to notify when any alert is raised for virtual devices. The notification can be a sound alert / email alert/ running a script etc. You can associate any of the notification profiles that is already created for the ESX host. To associate a notification profile to a virtual device,
- Go to the snapshot page of the host.
- Click on Notification icon present at the top.
- If no profiles are associated. Then click on 'Associate' to view the list of notification profiles already created.
- Select the notification profile that you want to associate and click Associate.
The notification profile is successfully associated to the host.
