Unified metrics
A unified metrics in Analytics Plus is a centralized framework that standardizes and defines how a particular metric or key performance indicator should be computed organization wide. Having a unified metrics ensures consistency, accuracy, and reliability of the data analysis. This Metrics layer resides between the raw data and analysis layer, creating a clear differentiation between data processing and the data visualization layer. It also gives a broader picture of how the metrics are related to each other.
Need for unified metrics
Businesses conduct analysis on huge volumes of data, and metrics or KPIs are the prime factors for assessing the performance and growth. In large organizations, data is stored in multiple sources; each department uses different computation logic, and this leads to varied interpretations of the same data. Hence, a unified metrics layer can resolve this issue.
Advantages of unified metrics
- Single Source of Truth: Implementing a metric helps align all the analytical efforts, ensuring that everyone in the organization understands and uses the same definition of the metrics. Unified metrics enables the unique identification of metrics, thereby promoting transparency and uniformity.
- Increased Efficiency: Simplifies the process of maintaining and monitoring metrics as any change needs to be done in a single place. It also significantly reduces discrepancies.
- Extensibility: It can seamlessly accommodate new business rule sets into the existing framework and can be used for training ML models, creating custom visuals, and integrating with other third-party applications.
- Data Integrity: Having a centralized framework for managing metrics promotes data integrity and improves data quality.
Accessing unified metrics in Analytics Plus
Analytics Plus catalogs all the Aggregate Formulas defined in the workspace. This includes calculation defined on all the data sources configured in that workspace. Users with read-only access can view the formulas, while users with administrator privileges and those with custom permissions to edit can modify and change them. It also lists the reports created over the particular formula. Follow the steps below, to view the unified metrics tab.
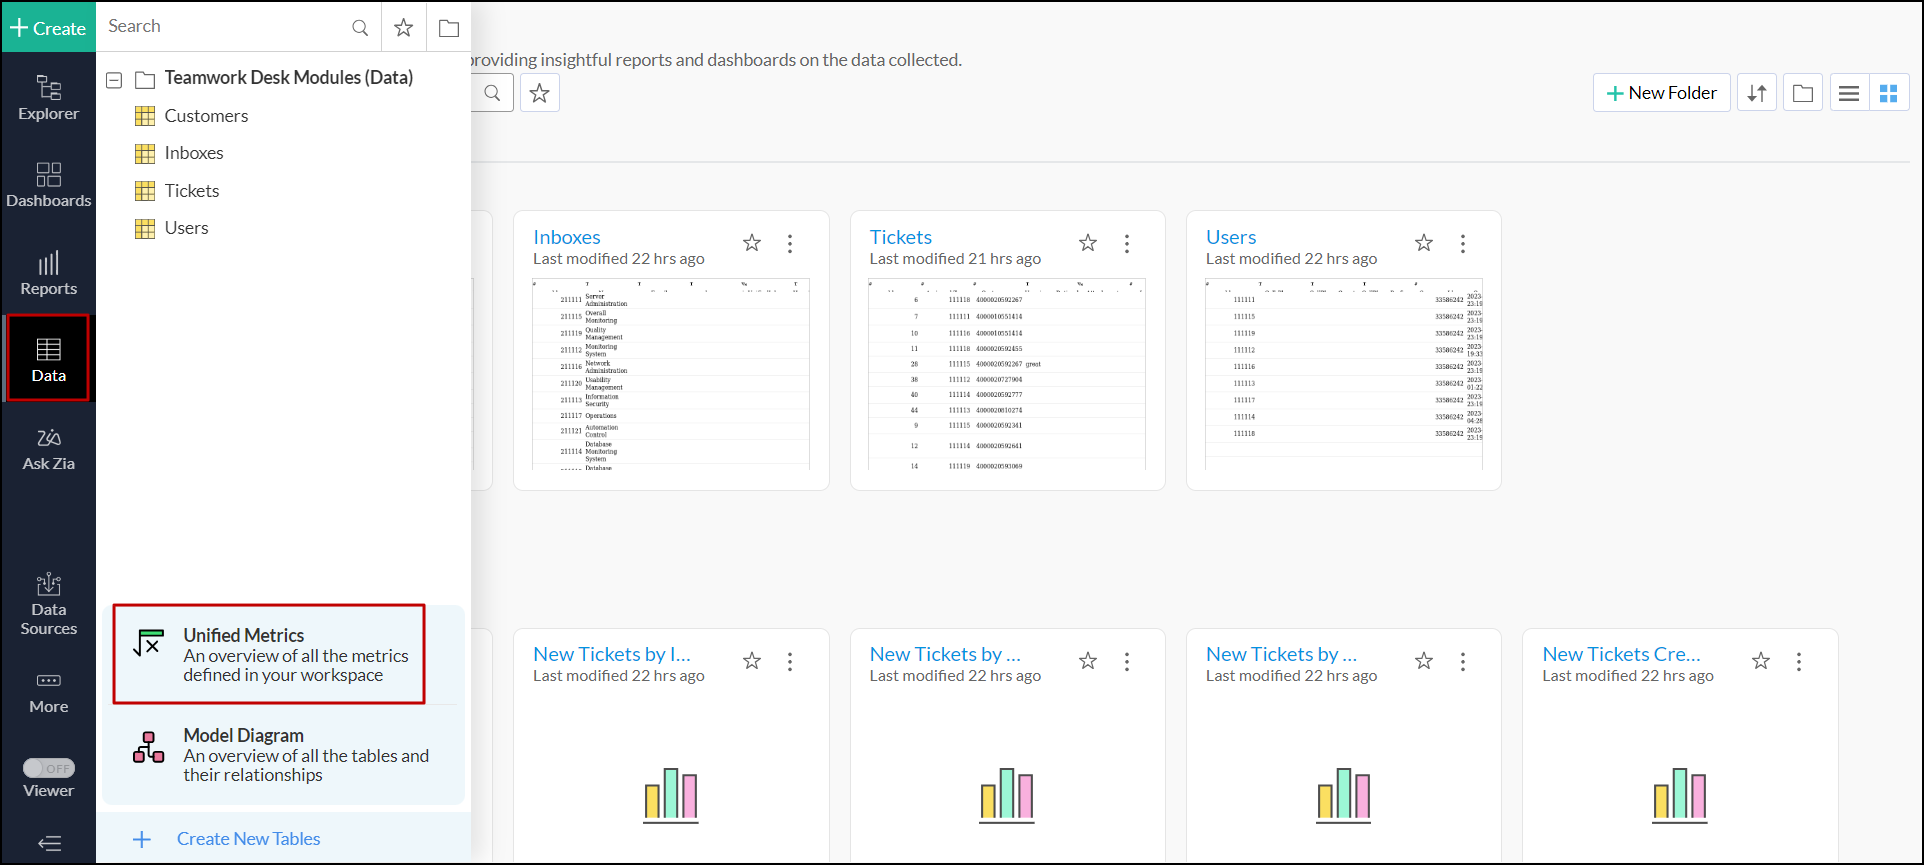
- Click the Data option on the side navigation panel.
- Scroll to the bottom of the pane and choose Unified Metrics.
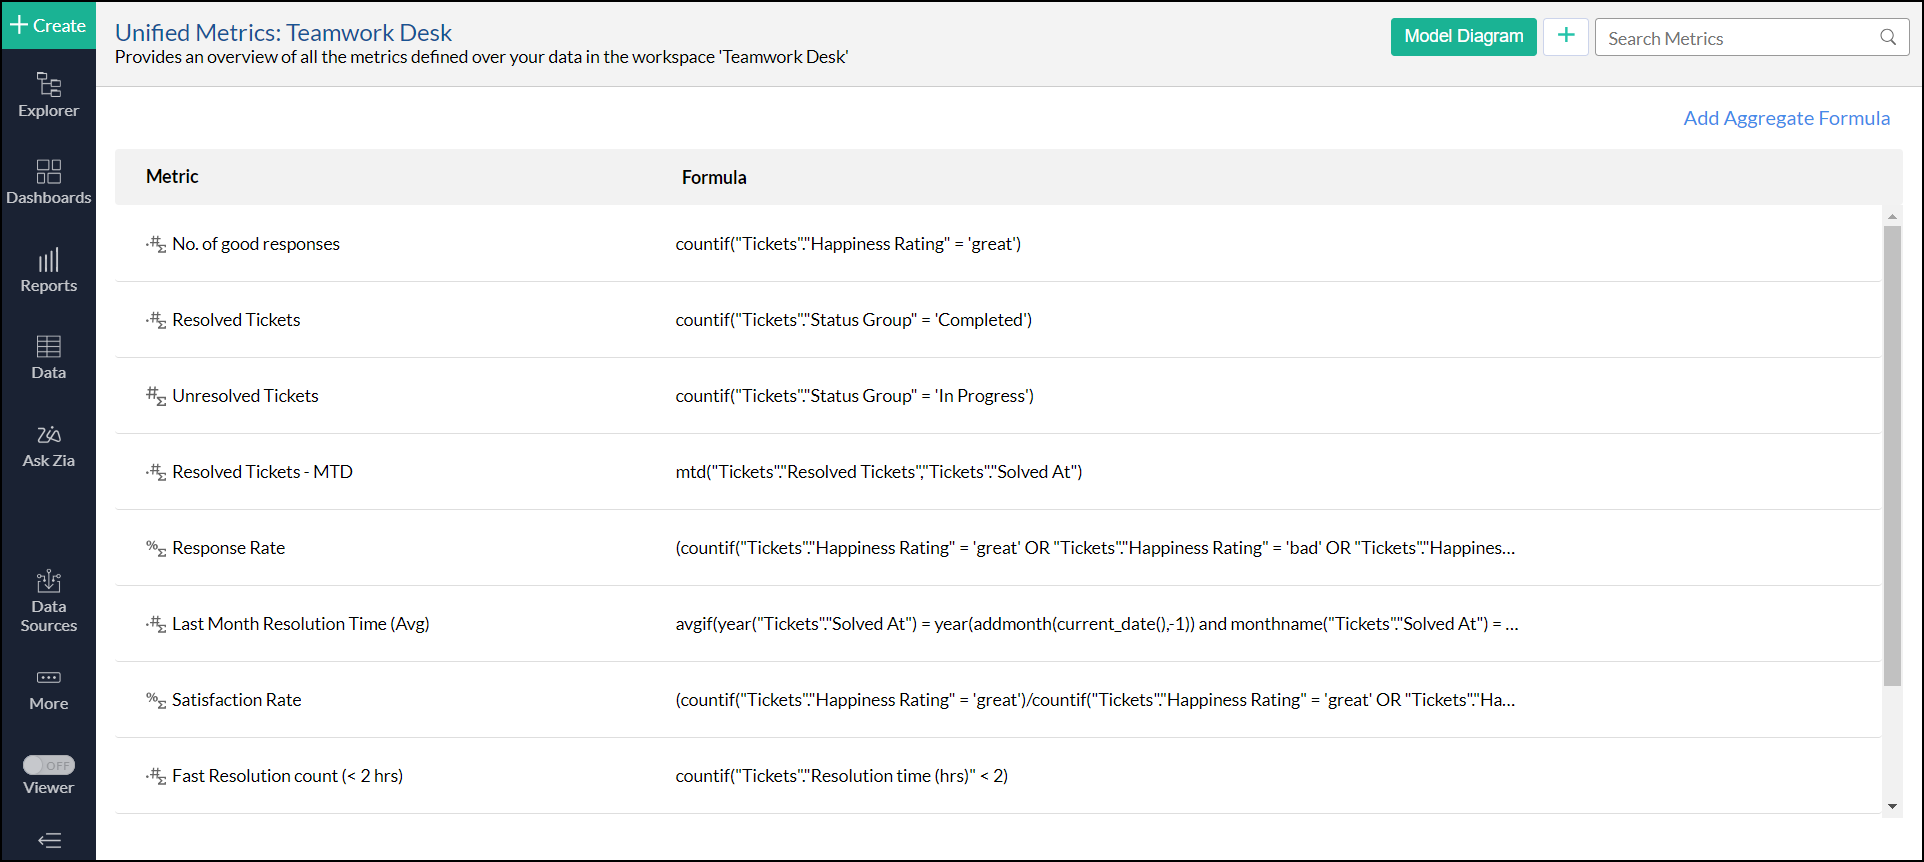
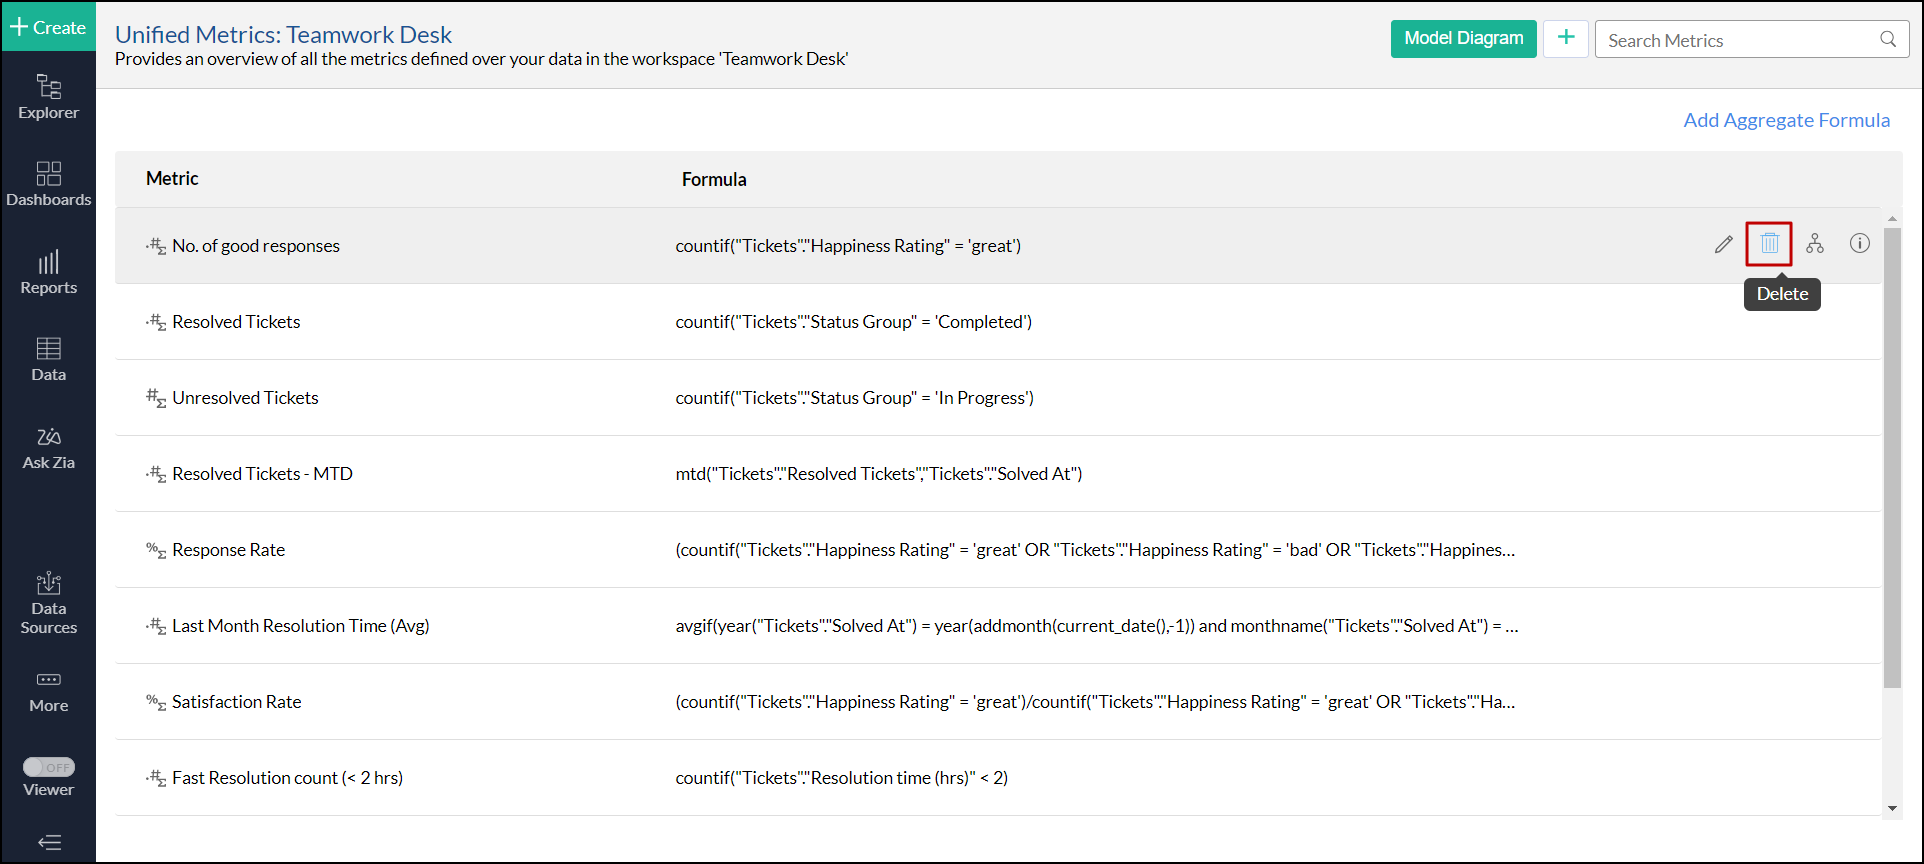
- All the Aggregate Formulas defined in that workspace will be listed along with meta information like descriptions or definitions for Admins and only the descriptions for Shared Users.
Analytics Plus allows you to perform the following actions on the listed aggregate formulas. Hover over the desired formula and choose the required option:
- Edit: Click the Edit icon, to modify the formula.
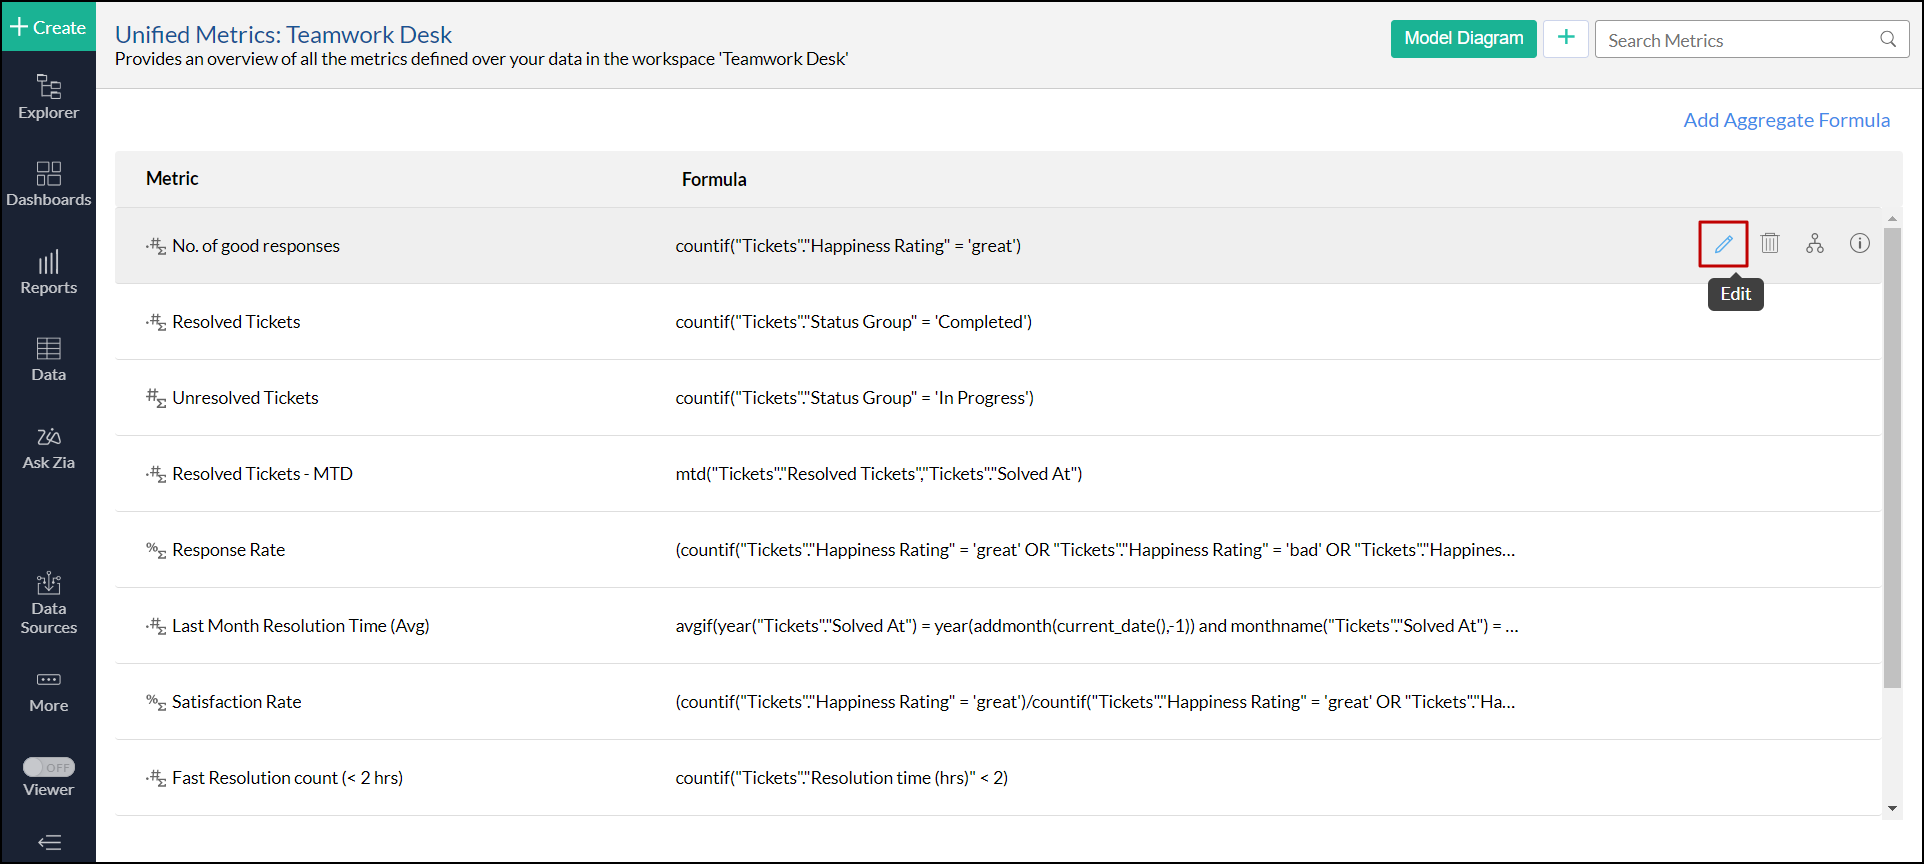
- Delete: Click the Delete icon to remove the formula.
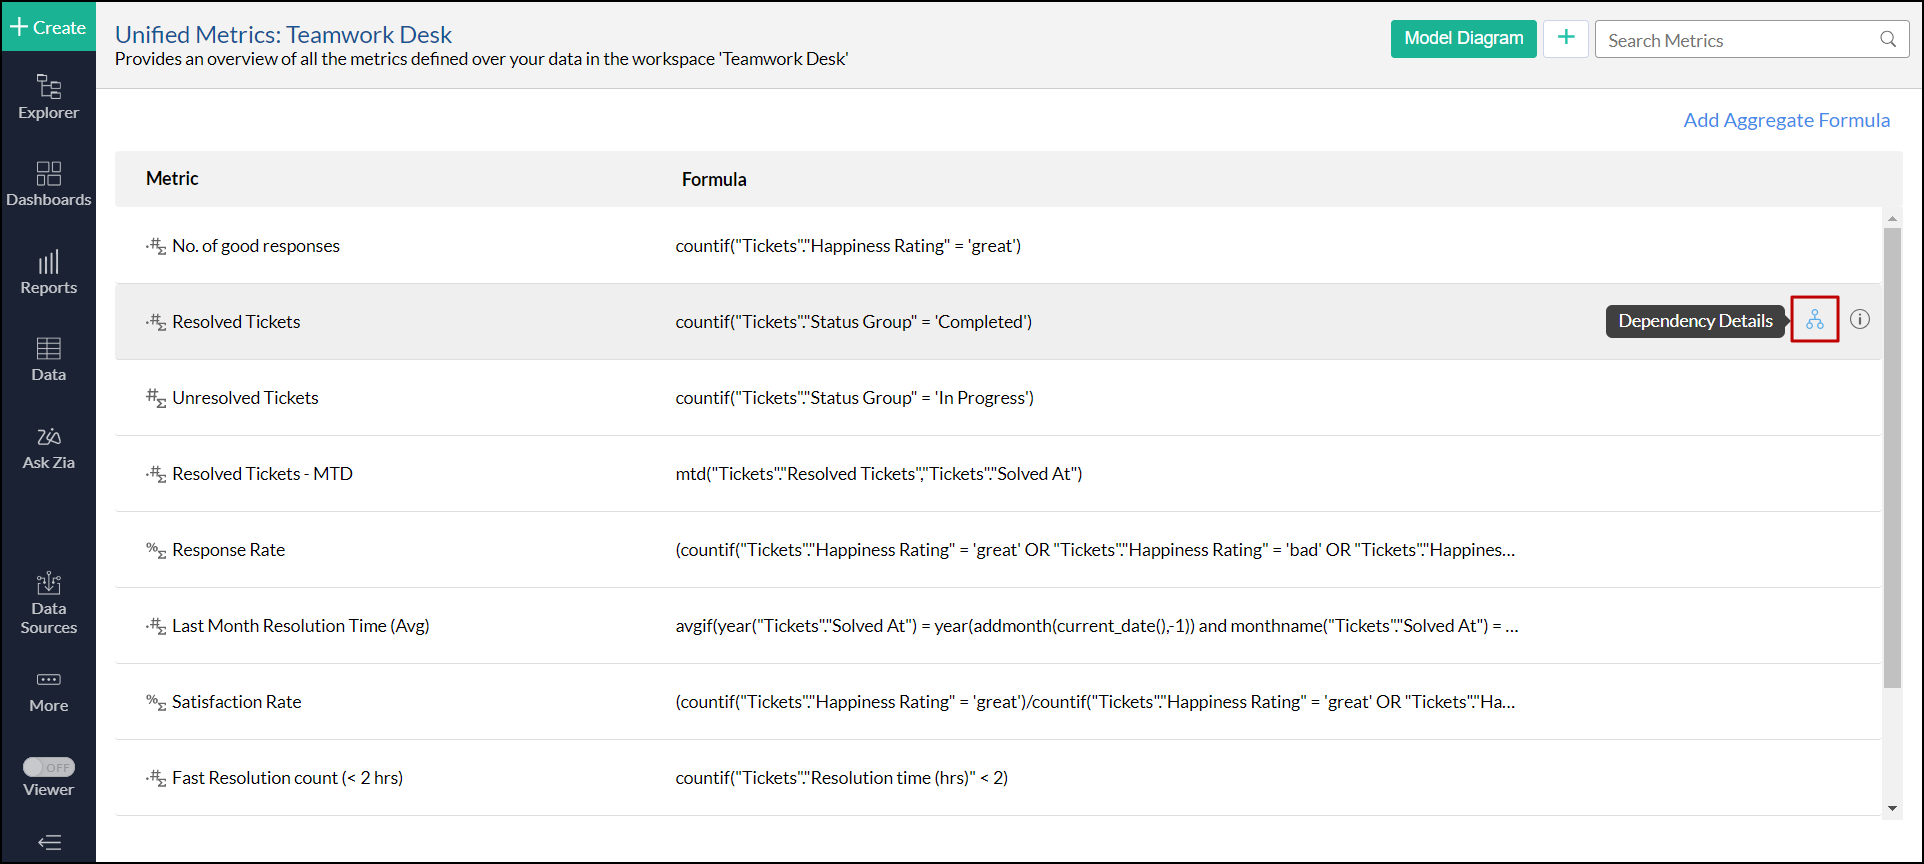
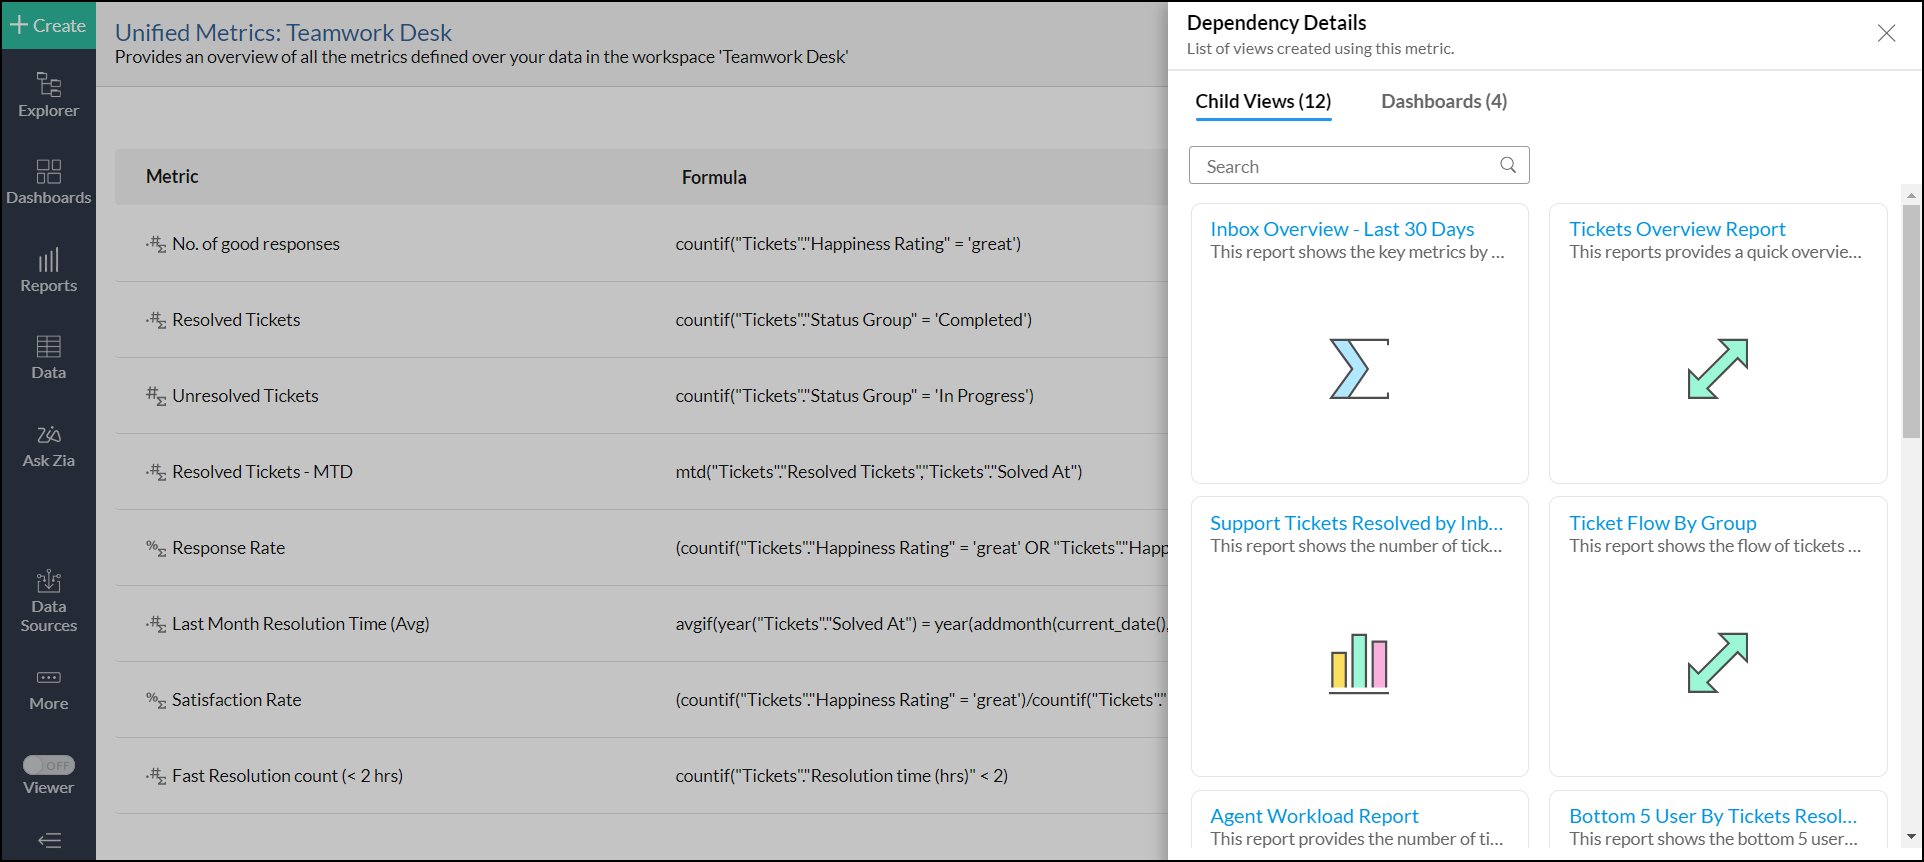
- Dependency Details: Click the Dependencies icon to know the views or reports associated with the formula.
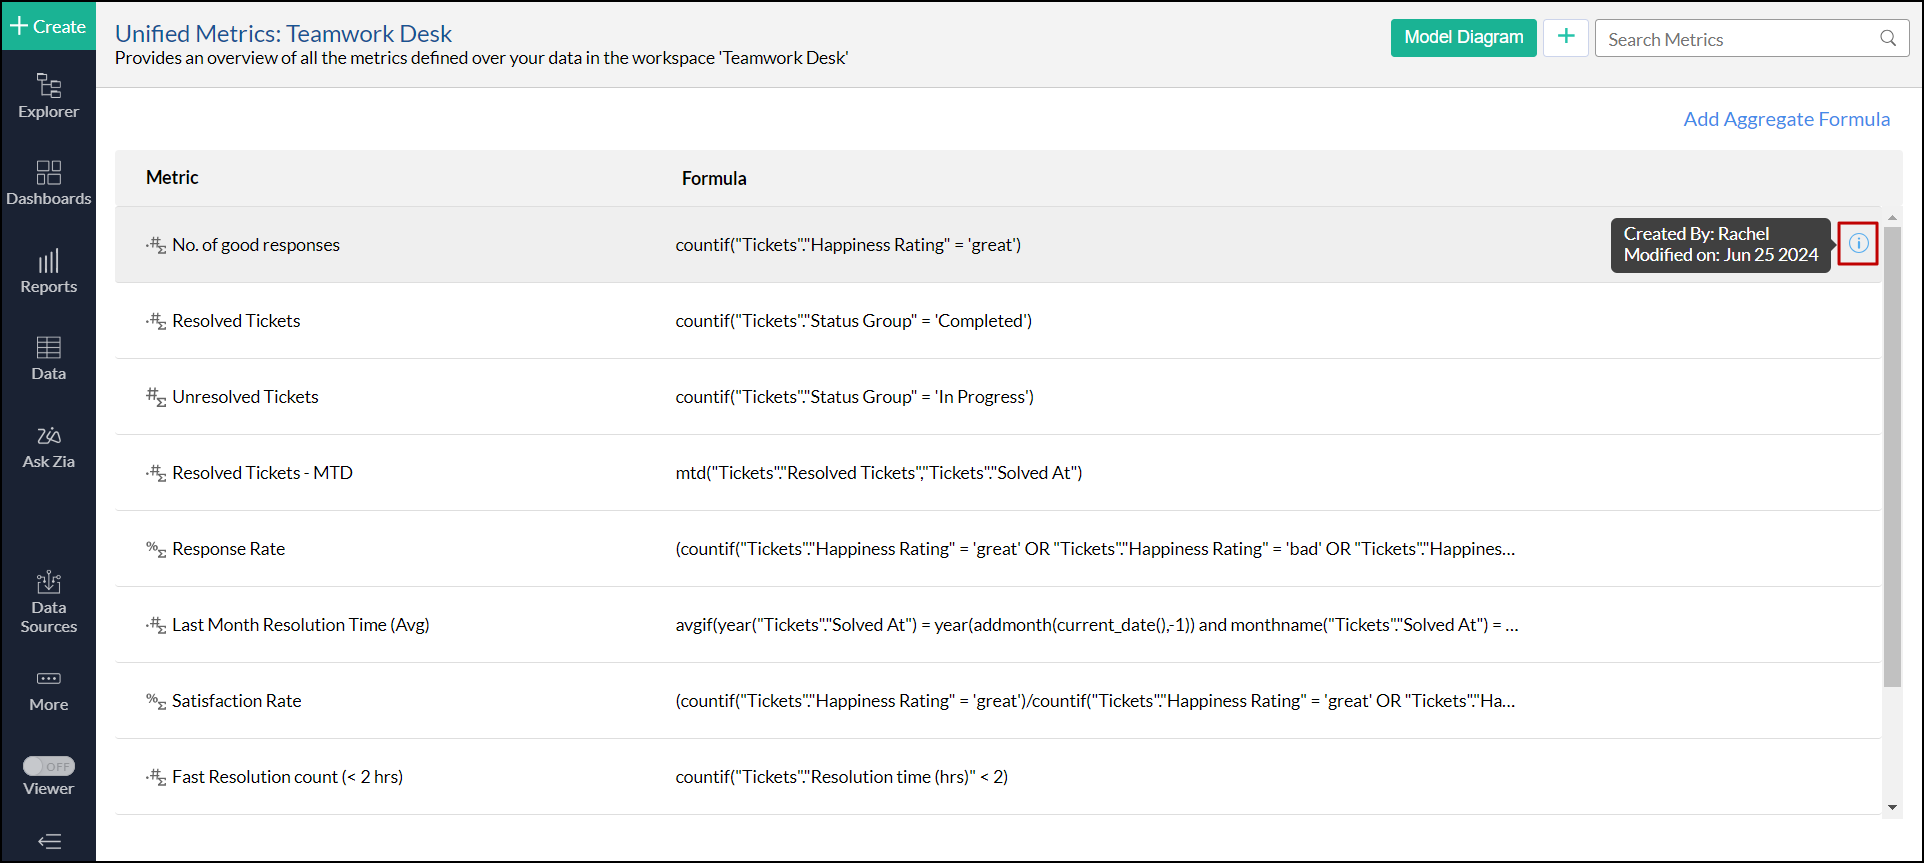
- Additional Information: Click the Info icon to get the details about the user who created a specific metric and the last modified time.
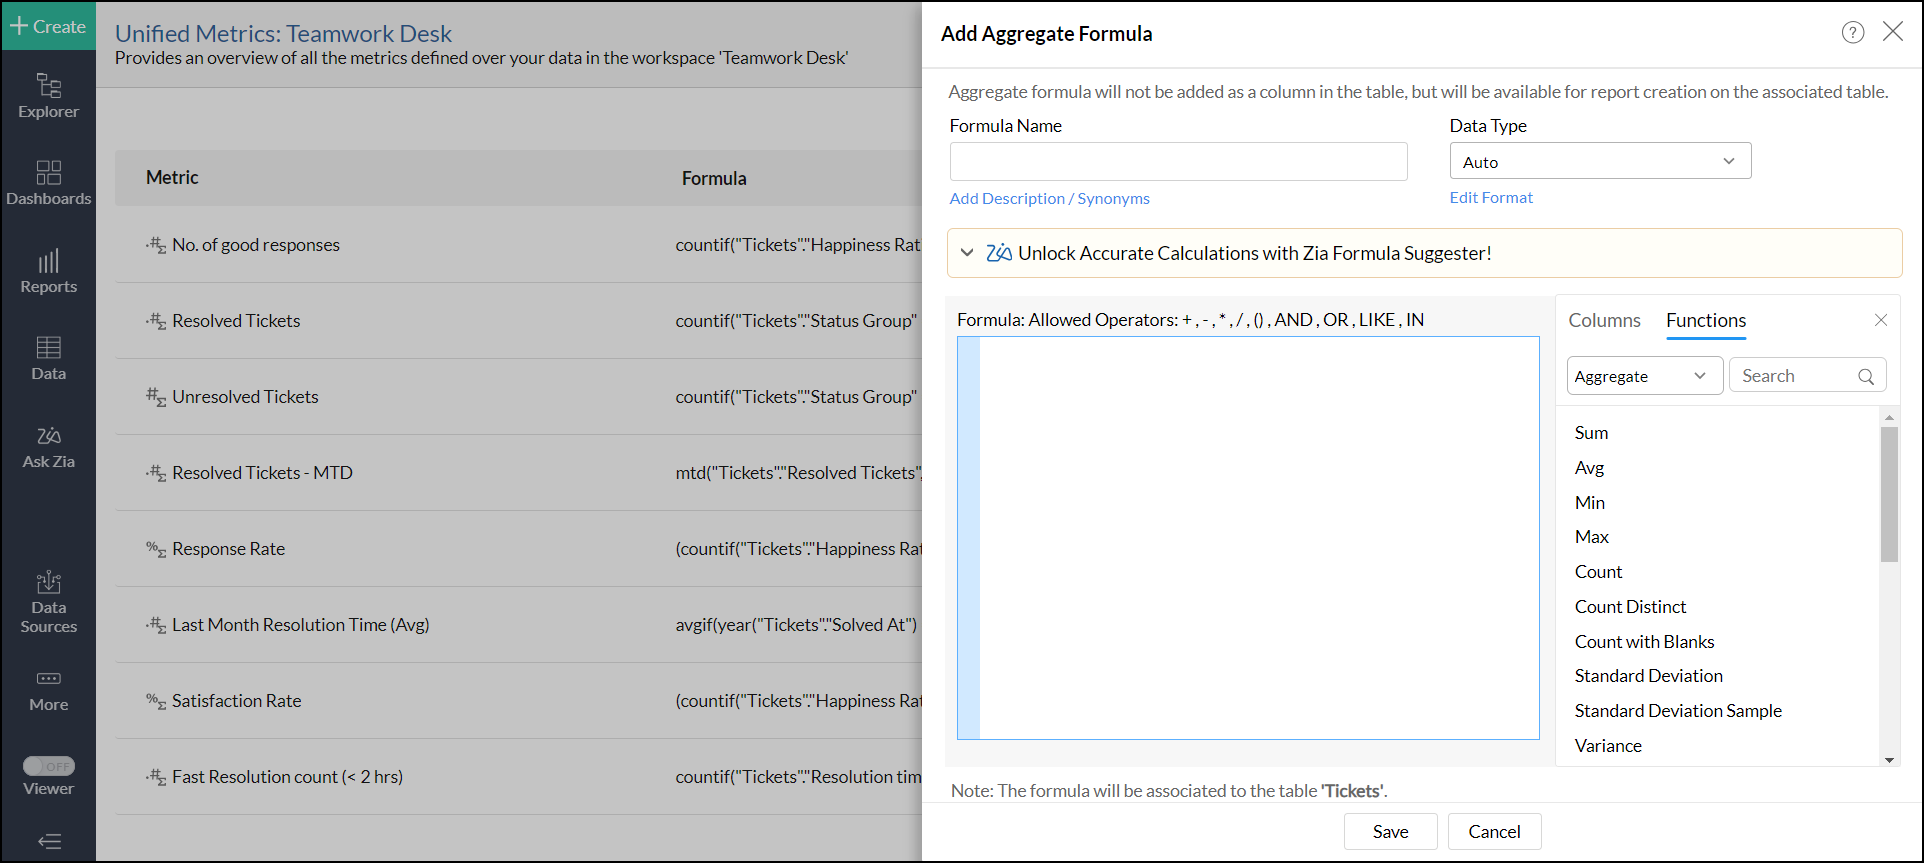
You can also add new aggregate formulas. Follow the steps below, to do this.
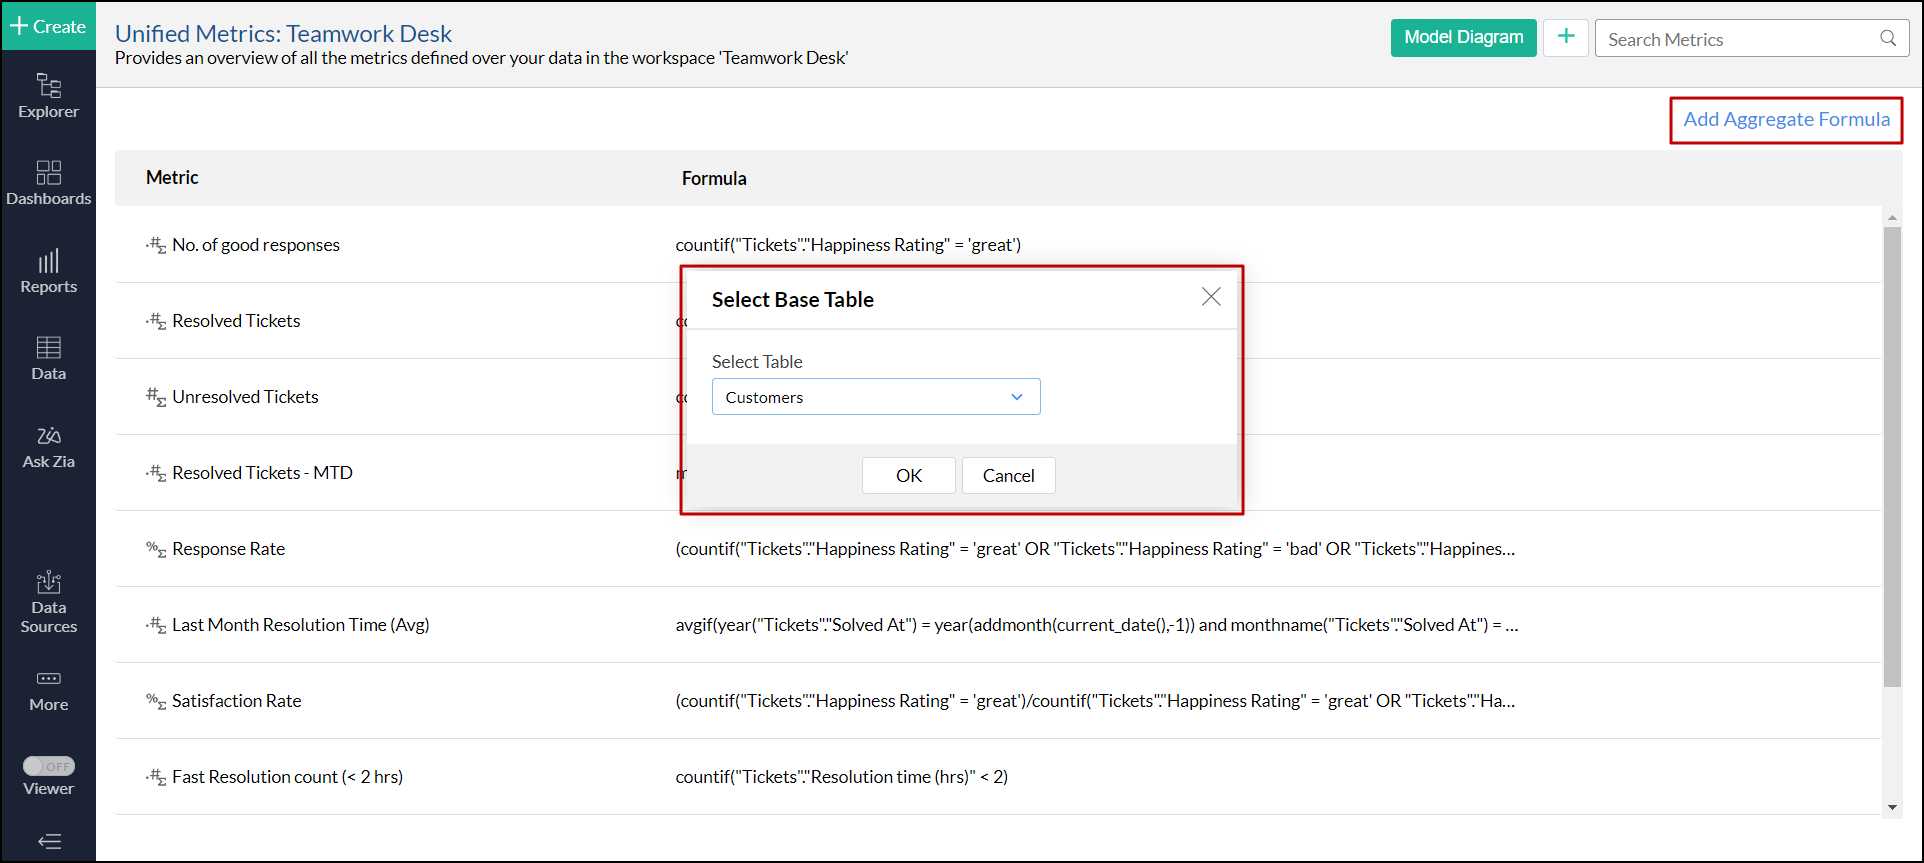
- Click the Add Aggregate Formula link at the top right corner.
- Choose the required table for which the aggregate formula should to be created, and click OK.
- Create the formula. Click here to learn more about creating aggregate formuals.