Support
 
Phone Get Quote
 
Support
 
US: +1 888 720 9500
US: +1 888 791 1189
Intl: +1 925 924 9500
Aus: +1 800 631 268
UK: 0800 028 6590
CN: +86 400 660 8680

Direct Inward Dialing: +1 408 916 9892

Get Quote


Process Monitor (ProcMon) is an advanced monitoring tool for Windows that enables IT administrators to monitor all activities that happen on file systems, registry keys, and the network. A computer also runs several processes, or sets of instructions at any given time, and this tool keeps a tab on all of these. ProcMon also enables administrators to monitor all the threads within a process. For these reasons, it is a very handy tool for troubleshooting Windows and investigating malware.

As we will see in this article, ProcMon is a step-up from the Task Manager that we're all familiar with. Task Manager tells us what processes are currently running. On the other hand, ProcMon tells us what processes are running, and what they are actually doing.

How to download ProcMon

The download takes a very short time, and it is very simple to install.

The ProcMon UI

When you first open ProcMon, this is what you'll see:

There are several default columns in ProcMon such as:
  • Time of day: As the name suggests, this is the time at which a particular event was logged. This is actually measured up to 7 decimal points!
  • Process Name: This is the name of the process that generates the events.
  • PID: This is the process ID or a unique number that identifies each running process in your computer.
  • Operation: This is the name of the operation.
  • Path: This is the path to whatever is actually being worked on. For example, if a process leads to a file being read, this will show the path of that file.
  • Result: This shows the result of the operation.
  • Detail: This shows additional details.

What does ProcMon actually monitor?

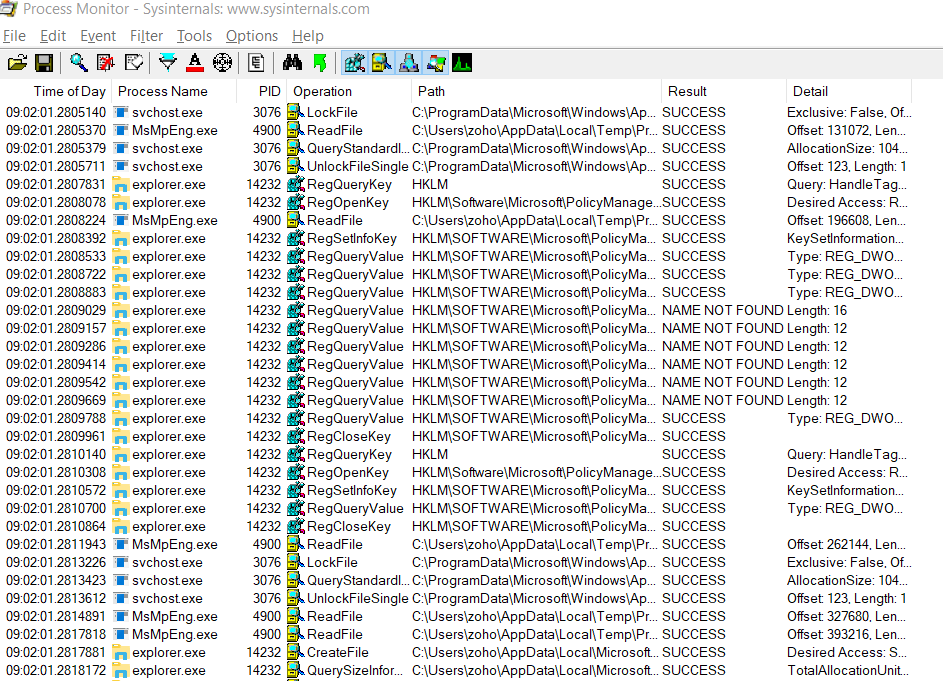
ProcMon monitors five different categories of events. These are:

  • 1Registry operations: All activities such as creating, deleting, reading, querying, and enumerating registry keys are logged.
  • 2File system operations: Activities such as file creations, deletions, modifications on both local and network drives are logged.
  • 3Network operations: All network activity (including source and destination addresses) associated with TCP/UDP traffic will be logged in ProcMon. It will however not log the actual information that was transmitted or received.
  • 4Process operations: All process and thread events such as process creation, process start, thread creation, thread start, thread exit, and process exit will be logged.
  • 5Profiling operations: This generates a log for memory use and processor time of each process.

How to use ProcMon

ProcMon captures thousands of events, and tracks all of them in real time. The best way to use ProcMon is to use the readily available filters, and zero-in on the events of interest.

The main filters are found at the top menu bar in ProcMon. The screen capture below highlights the main filters. There are five filter buttons, one for each of the different event categories.

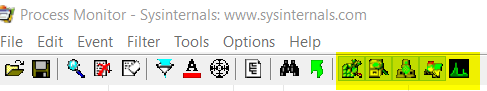
Hitting each button will exclude all events associated with a particular event category.

You can filter even more by right clicking on specific details in any of the columns, and either including such events, or excluding such events.

Benefits of using ProcMon

With the help of tools like ProcMon, an IT administrator can get to the bottom of most issues in Windows. The tool enables them to diagnose errors, fix problems, and troubleshoot the root cause of exceptions. Furthermore, it can be an integral part of an administrator's arsenal for hunting threats such as malware.

Monitoring processes with ADAudit Plus

ADAudit Plus can enable IT administrators to identify processes, and solve two practical problems:
  • Troubleshoot by zeroing-in on processes that may have led to an account lockout.
  • Identify processes that run on a machine for the very first time, thus indicating a potential malware.

Looking for processes that may have led to an account lockout with ADAudit Plus

To identify processes that may have led to an account lockout, the administrator has to:
  • Log on to the ADaudit Plus web console.
  • Navigate to Reports -> User Management -> Account Lockout Analyzer.
    (The Account Lockout Analyzer report can be run from this screen for any time period of choice. The report will display all locked out users in this time period.)
  • Click on Analyzer Details to get information about components including processes that may have led to an account lockout.
  • Analyze if any of the listed processes have led to the lockout.

Looking for potential malware by identifying processes that run for the first time on a machine

To get information on processes that run for the very first time on a machine, the administrator has to:
  • Open the ADAudit Plus web console.
  • Navigate to Analytics -> Anomalies -> Anomalous Process Activity -> New process on server.

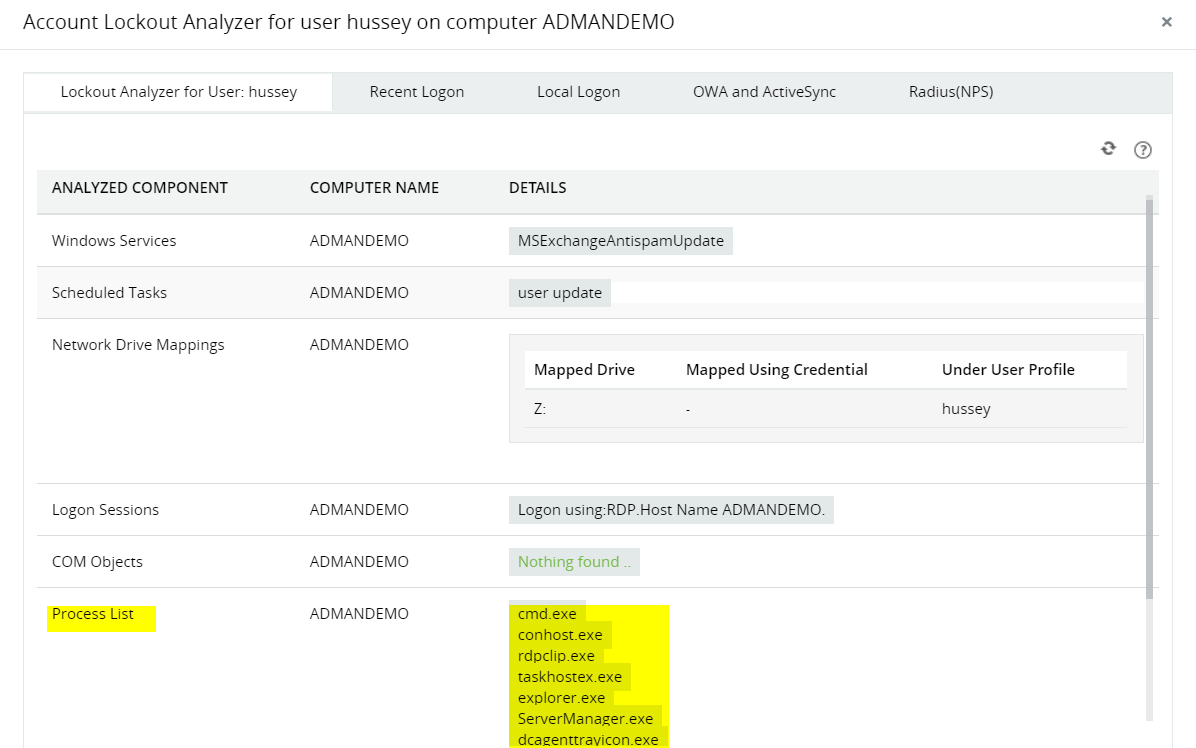
The Unusual Process column will list all the processes that run on machines for the very first time. IT administrators can use this information to identify potential malware and troubleshoot other problems.

About ADAudit Plus

ADAudit Plus is a real-time, web-based Windows Active Directory (AD) change reporting software that audits, reports and alerts on Active Directory, Windows servers and workstations, and NAS storage devices to meet the demands of security, and compliance requirements. You can track AD management changes, processes, folder modifications, permissions changes, and more with 200+ reports and real-time alerts. To learn more, visit https://www.manageengine.com/active-directory-audit/.

Tracking processes using native tools proving to be complicated?
Simplify this by getting your hands on ADAudit Plus.

Native auditing becoming a little too much?

Try ADAudit Plus to audit, track, and respond to malicious activities happening inside your Windows AD & Azure environment.

Try ADAudit Plus for free
 

ADAudit Plus Trusted By

Back to Top