Active Directory, Microsoft 365, and Exchange management and reporting
Hybrid AD, cloud, and file auditing; security; and compliance
Identity security with adaptive MFA, SSPR, and SSO
Reporting, auditing, and monitoring for hybrid Exchange and Skype
Active Directory, Microsoft 365, and Exchange backup and recovery
Hybrid AD, cloud, and file auditing; security; and compliance
SharePoint reporting and auditing
Microsoft 365 security
Cloud security monitoring and analytics
File auditing, data leak prevention, and data risk assessment
File security and storage analysis
Automated patching across multiple OSs and over 850+ third-party apps
Simplified third-party patch deployment via ConfigMgr and Intune
Seamless mobile device management from onboarding to retirement
Remote troubleshooting with integrated chat, voice, and video
Automated OS image creation and seamless role-based deployment
Prioritization-focused enterprise vulnerability management
App control and endpoint privilege management software
Data theft prevention with strict peripheral device control
Browser security with isolation, lockdown, and activity tracking
Sensitive data protection and compliance for endpoint devices
Real-time ransomware mitigation and file recovery for business continuity
Next-gen antivirus software for threat detection and breach prevention
Full-stack observability with AIOps and digital experience monitoring
AI-powered, all-in-one SaaS platform for observability and digital experience monitoring
Digital experience, application performance, and infrastructure monitoring
All-in-one vendor risk assessment tool to ensure domain security
Network, server, and storage performance monitoring
Bandwidth monitoring and traffic analysis
Network change and configuration management
Firewall rule, configuration, and log management
IP address and switch port management
Centralized IT alert management
Status pages for real-time status and incident communication
A cloud-native identity platform for workforce IAM
Full-stack service management for enterprises
IT asset management with an integrated CMDB
Unified endpoint management and security
Comprehensive mobile device management
Enterprise remote access
Automated multi-OS patch management
Full-stack monitoring for IT admins, DevOps, and SREs
Status pages for real-time status and incident communication
Cloud cost management for modern software teams
SaaS management platform to maximize ROI
Centralized IT alert management
Secure your IT infrastructure and prove compliance from the cloud
AI-powered unified analytics platform to correlate all IT data
An all-in-one DNS management service to keep your business online
Low-code application development platform
Remote support software
Collaborative project management
Agile project management
All-in-one collaboration tool for unified communication
Secure email hosting solution for businesses
All-in-one video conferencing solution for remote business meetings
All-in-one AR remote assistance software solution for remote collaboration.
Unified network monitoring and endpoint management for MSPs
Unified Active Directory management and reporting solution for MSPs
Unified SIEM solution for MSSPs
Log management and advanced threat intelligence for MSSPs
Complete privileged access security for enterprises
Privileged password management
Full-stack service management for MSPs
Thread profiling enables you to identify and isolate bottlenecks in your code stack. In Applications Manager's APM Insight, all thread profiles collected in the chosen time window are listed, along with the thread count, CPU time and memory details. Each thread profile consists of a list of threads that were running when the application was being profiled.
Upon clicking a specific thread profile, one can view:
Contents:
To view Thread Profiles,
Note: Thread profiling is supported only for JAVA and .NET agents.
APM Insight schedules thread profiling twice a day for a period of 5 minutes.
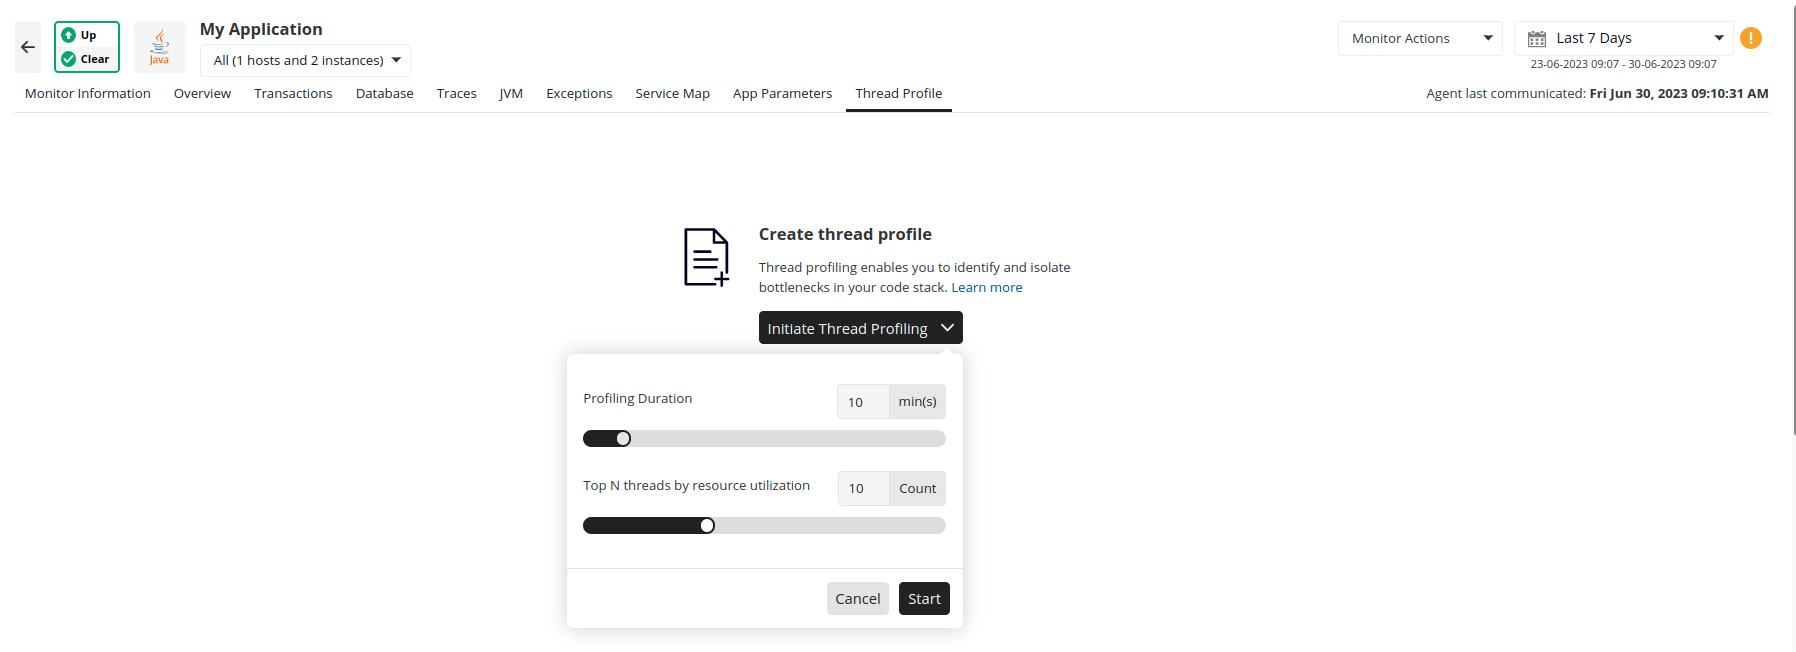
With On-Demand profiling, one can initiate thread profiling at the current time for a duration ranging from 5 to 30 minutes. The threads are sampled at regular time interval in the specified duration and the collective data is displayed at the end of time duration.
To initiate On-Demand profiling,
Note: On-Demand profiling can be initiated only once per hour (i.e) if you initiate On-Demand profiling for 5 minutes, next initiation can be done only after 55 minutes.
On-Demand profiling can be initiated for both applications and instances.
With this option, you can easily identify the threads that consume the most CPU or memory. You can choose any value (N) from five to 20.
Note: This option is only available for Java agents v6.0 and above.
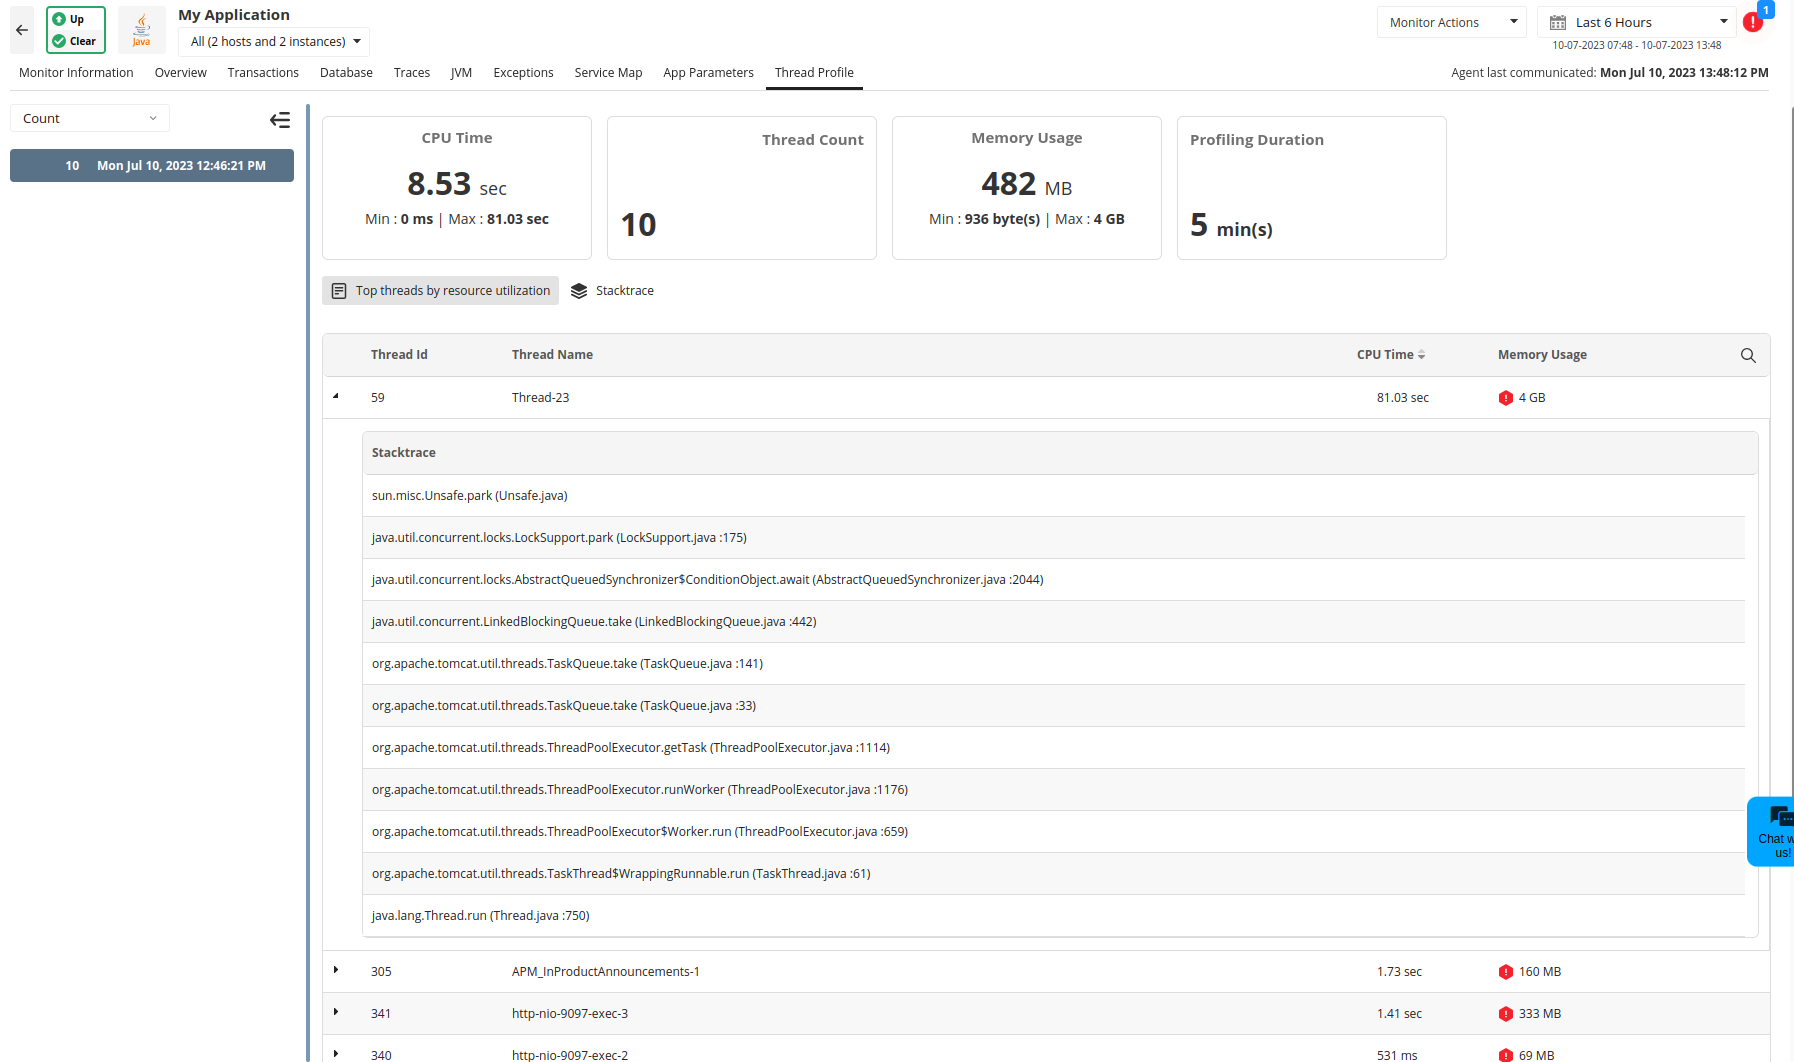
When ON-DEMAND thread profiling is requested, the agent also monitors the CPU and memory usage of each thread. The agent picks the top N threads that consumed a large amount of resources from each category (CPU and memory) based on the N value you provided. Once the profiling is finished, the threads, along with their usage statistics and stack traces, will be displayed in the Applications Manager web client.
The below figure shows the threads sorted in descending order by the amount of resources consumed.