Filter quantitative data
Analytics Plus offers different options for filtering quantitative data. In this document, we'll explore the Top/Bottom N filter in detail. Click here to learn more about other filtering options.
Top/ Bottom N filter
You can quickly identify the high-performing and underperforming areas in your data with Analytics Plus' Top/Bottom N filter. It functions by sorting the data and ranking each data according to its relative position. To use this filter, follow the steps below.
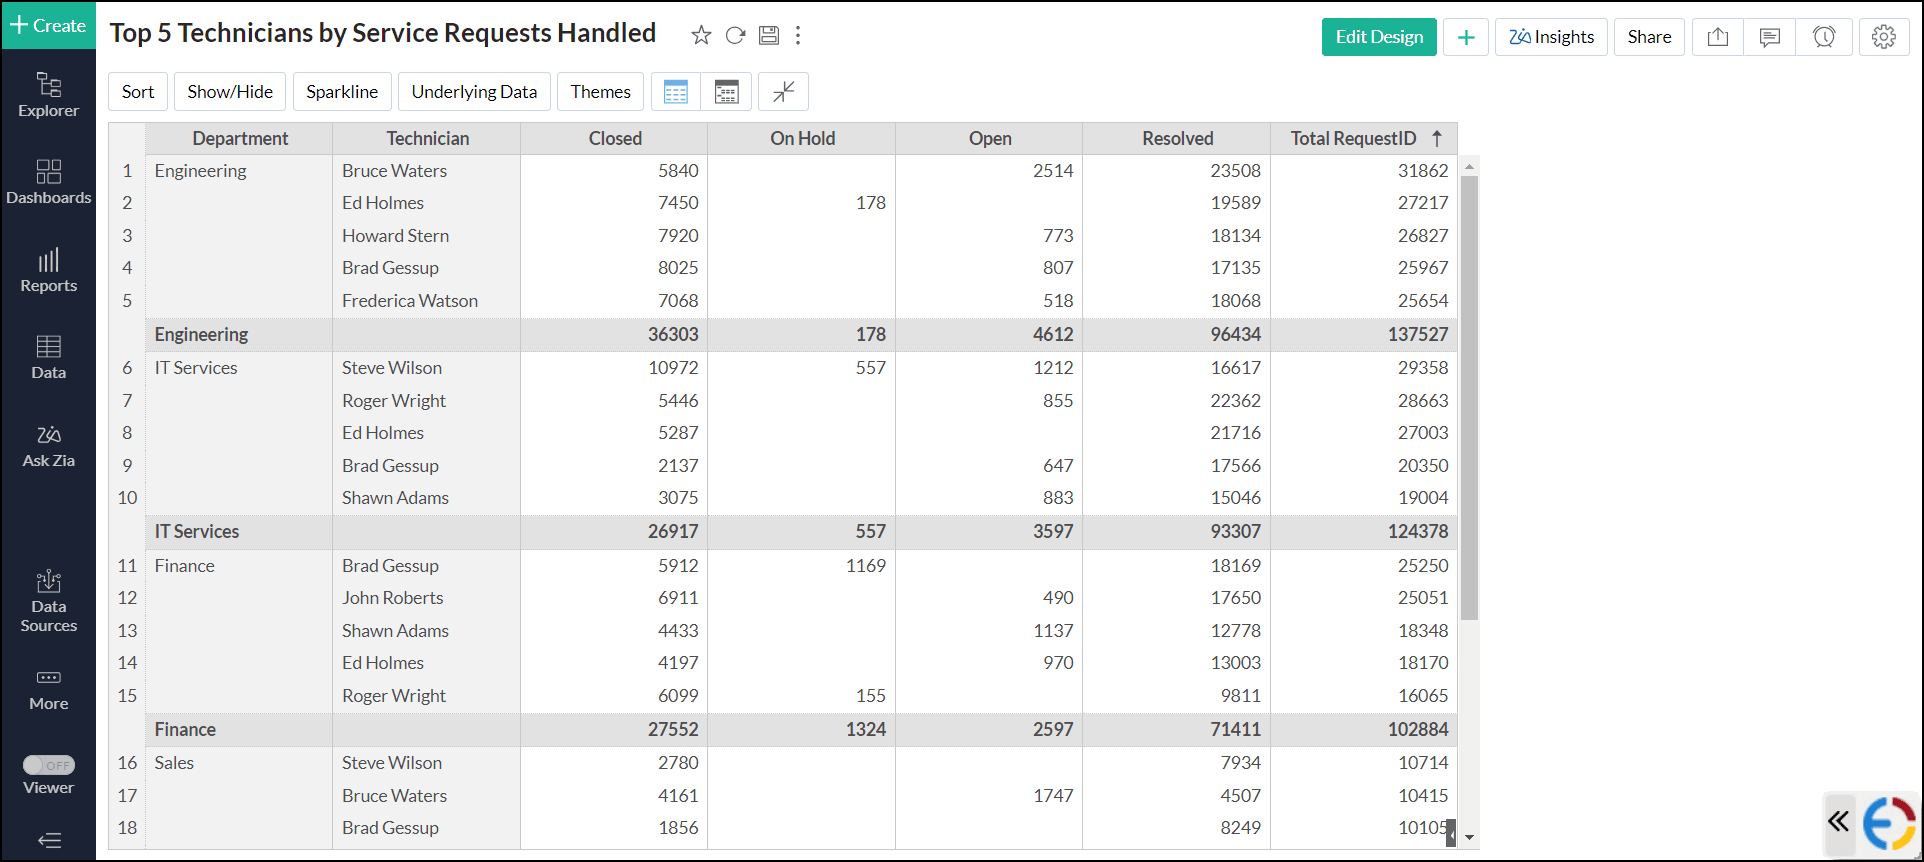
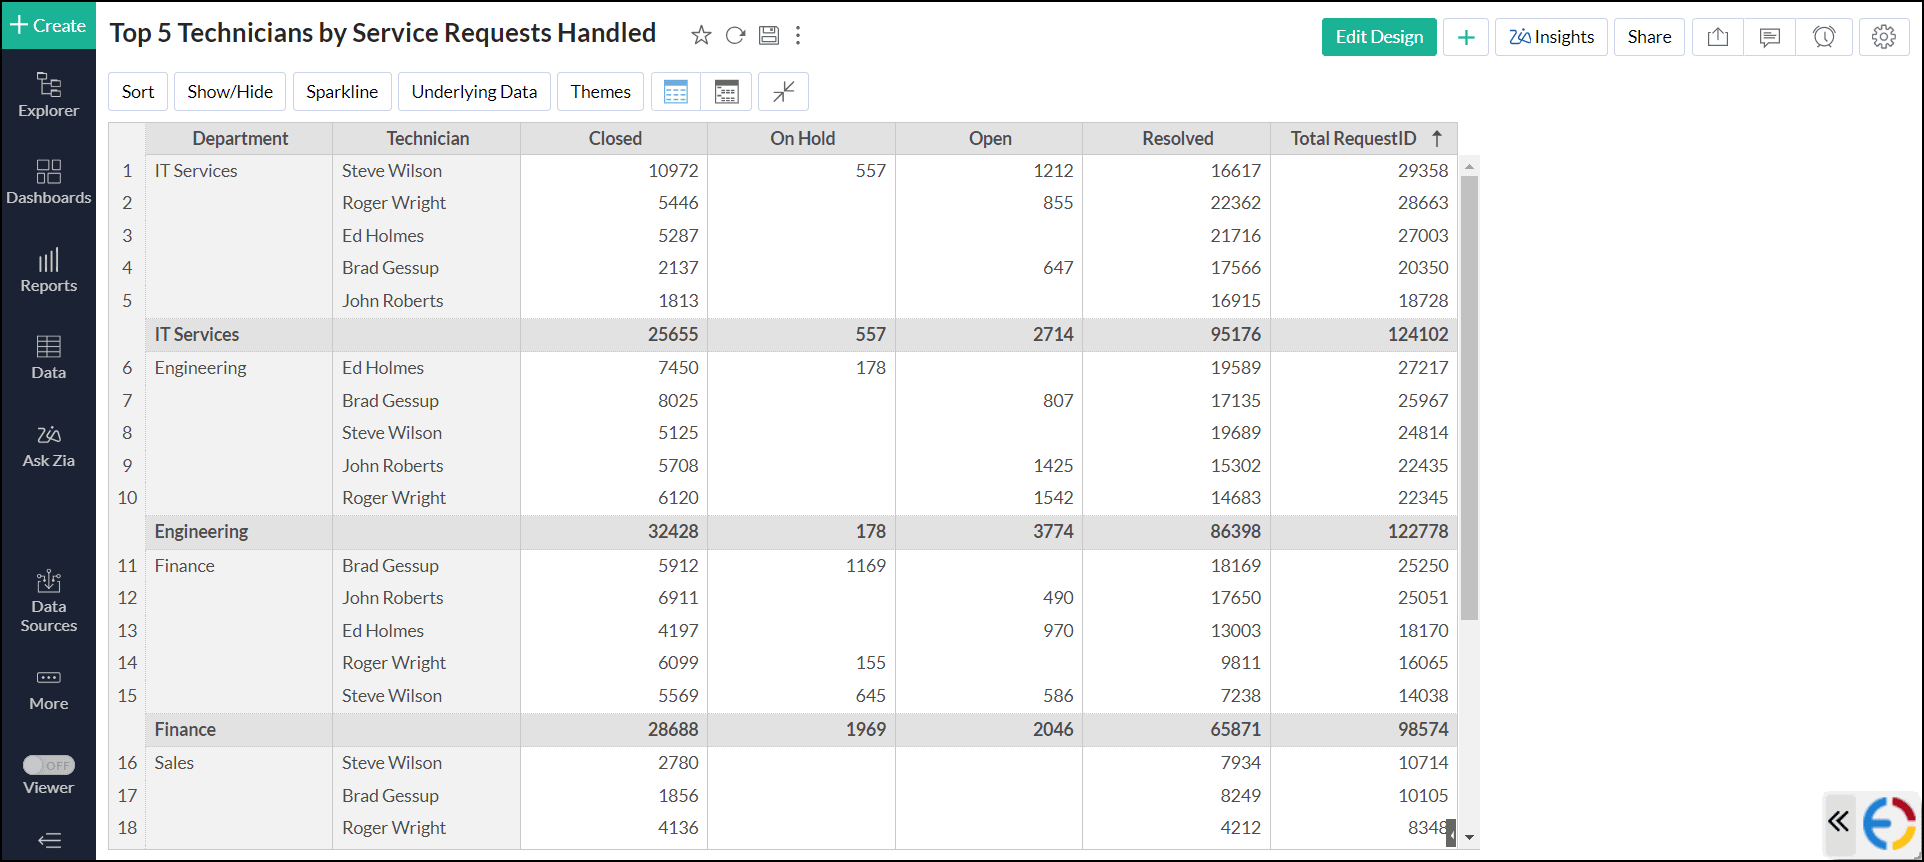
- Open the required chart in Edit Design mode or create a new one. For instance, let's create a pivot view to visualize the Top 5 Technicians in each department based on the number of service requests they have handled.
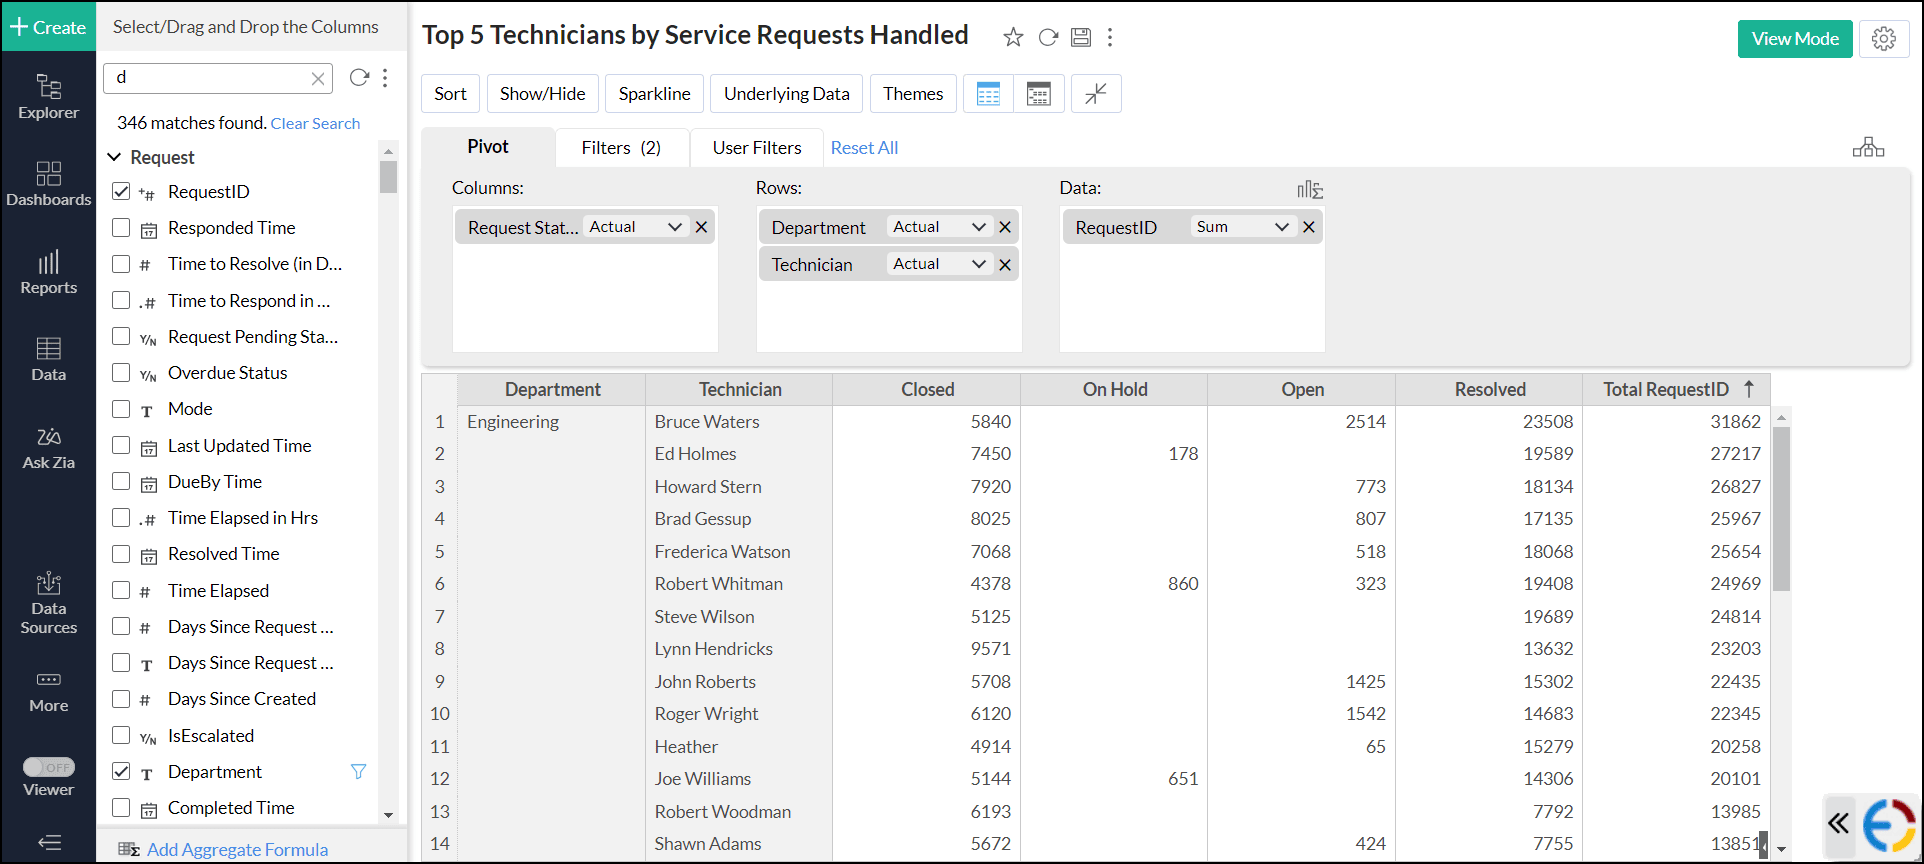
- Navigate to the Filters tab, and drag and drop the corresponding numeric column (RequestID).
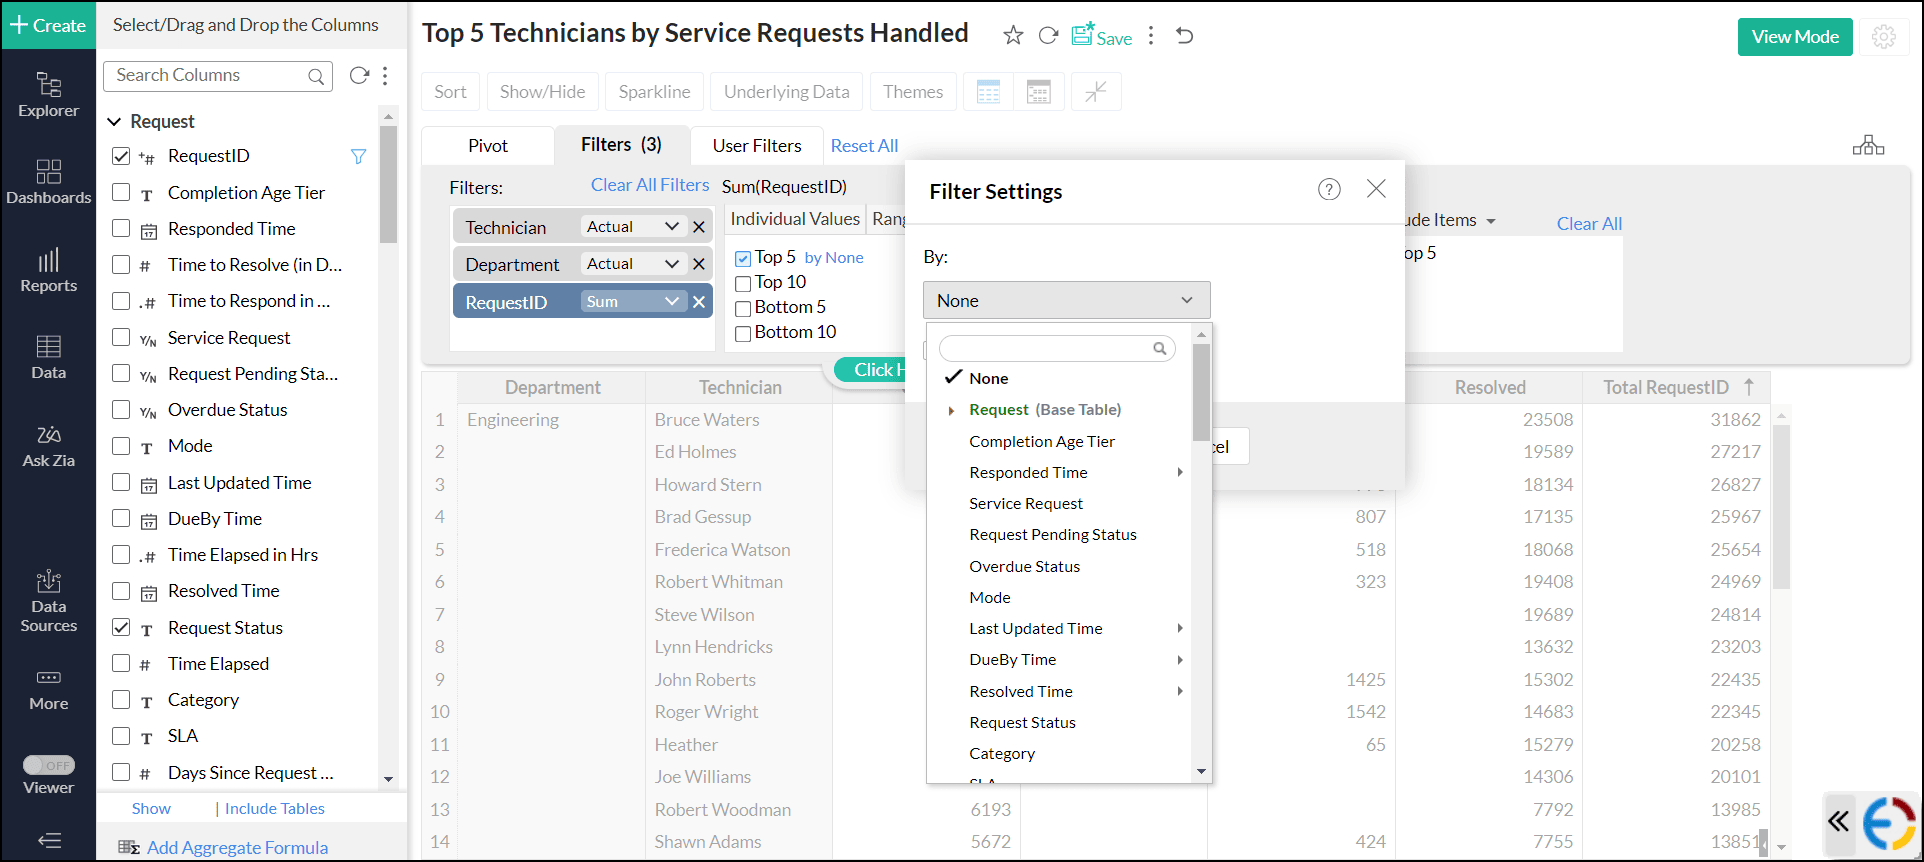
- Navigate to the Top/Bottom N tab.
- Choose one of the available options or define a custom range using the + Add New Range option. In this example, choose the default Top 5 filter.
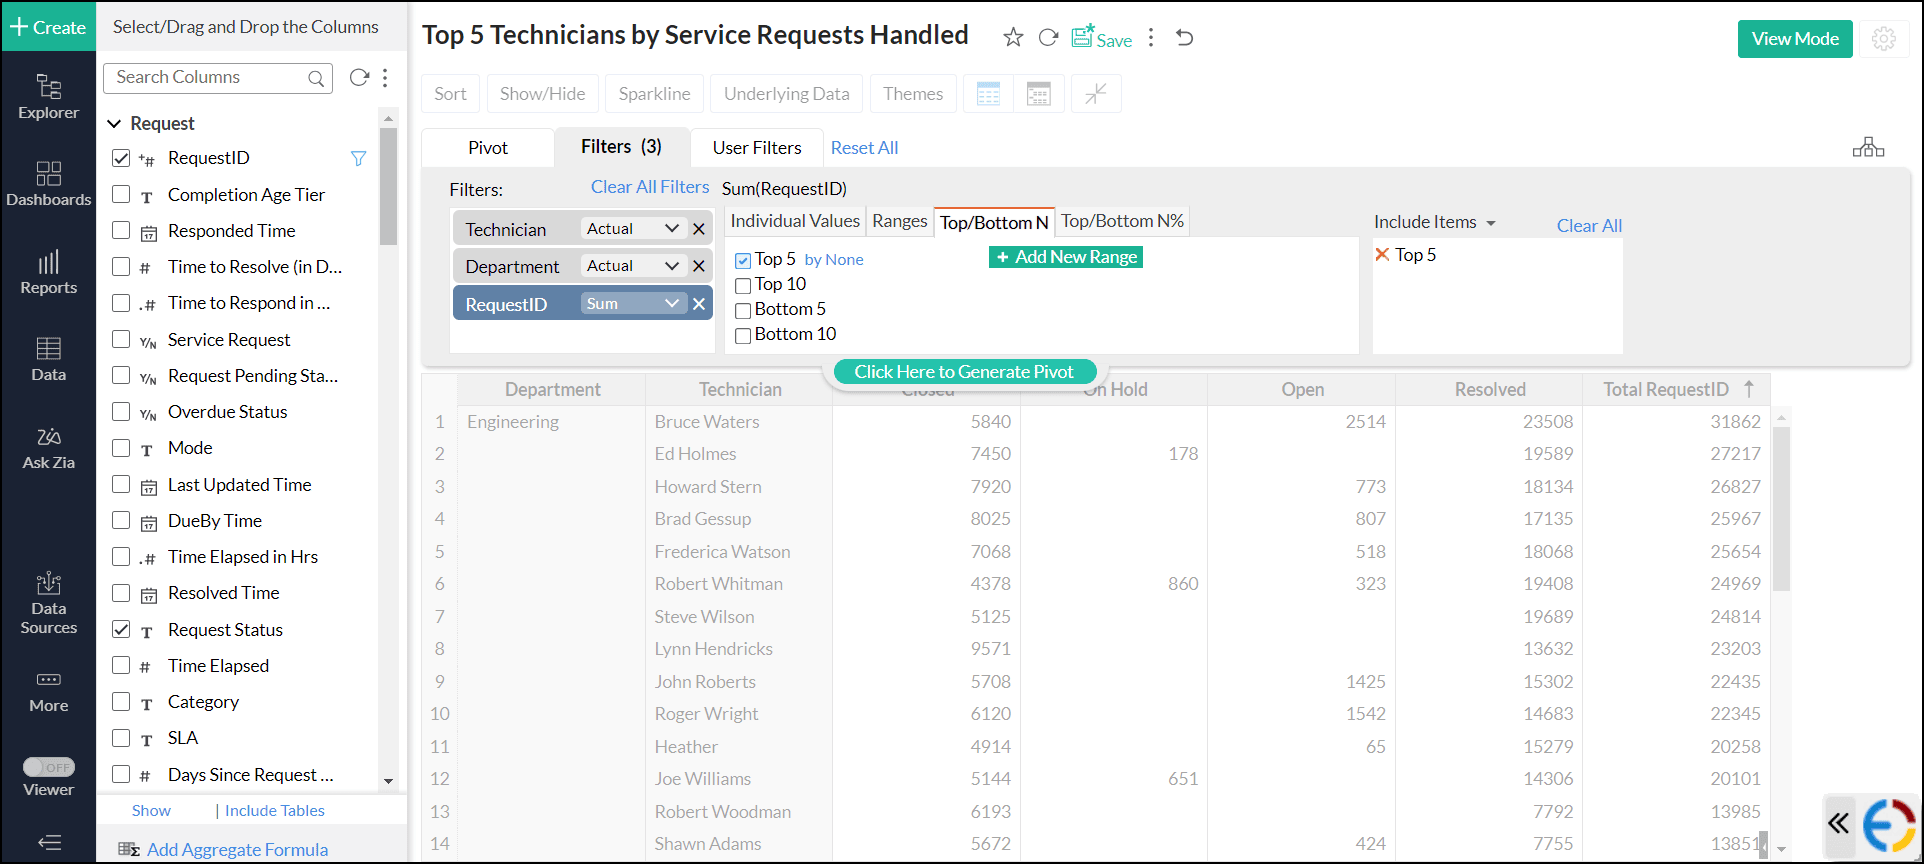
- Click the By None link next to the selected filter.
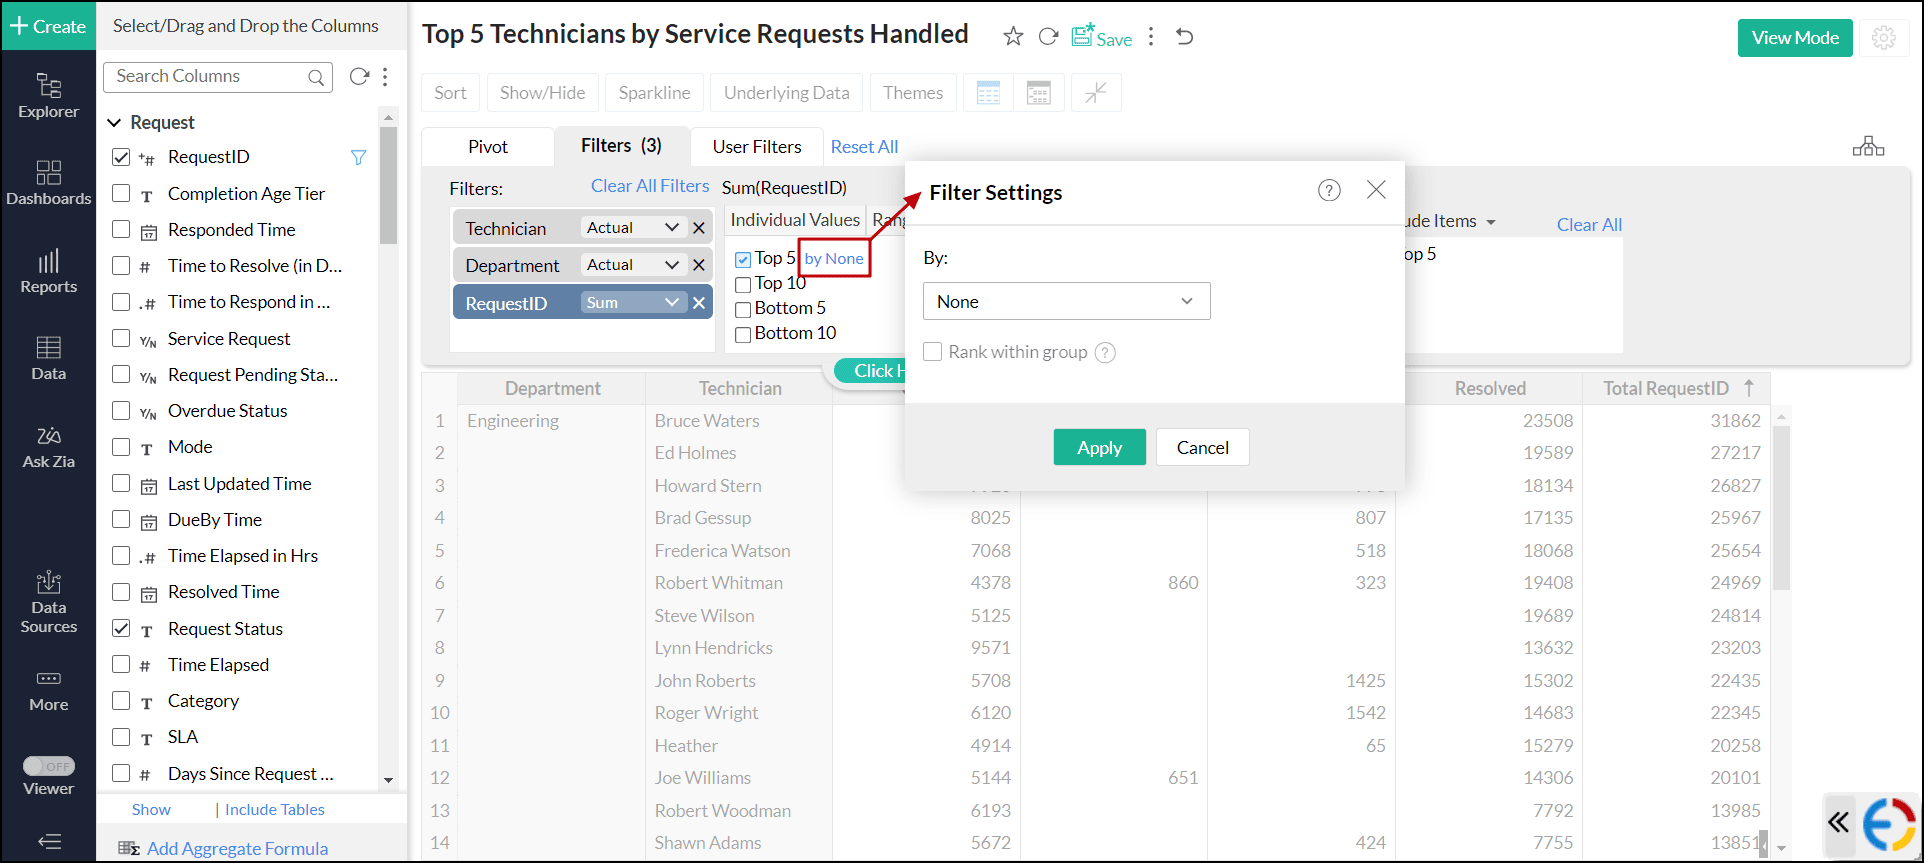
- Select the Primary Field or Base Level for grouping and ranking the values using the By drop-down. For this example, choose the Technician column.
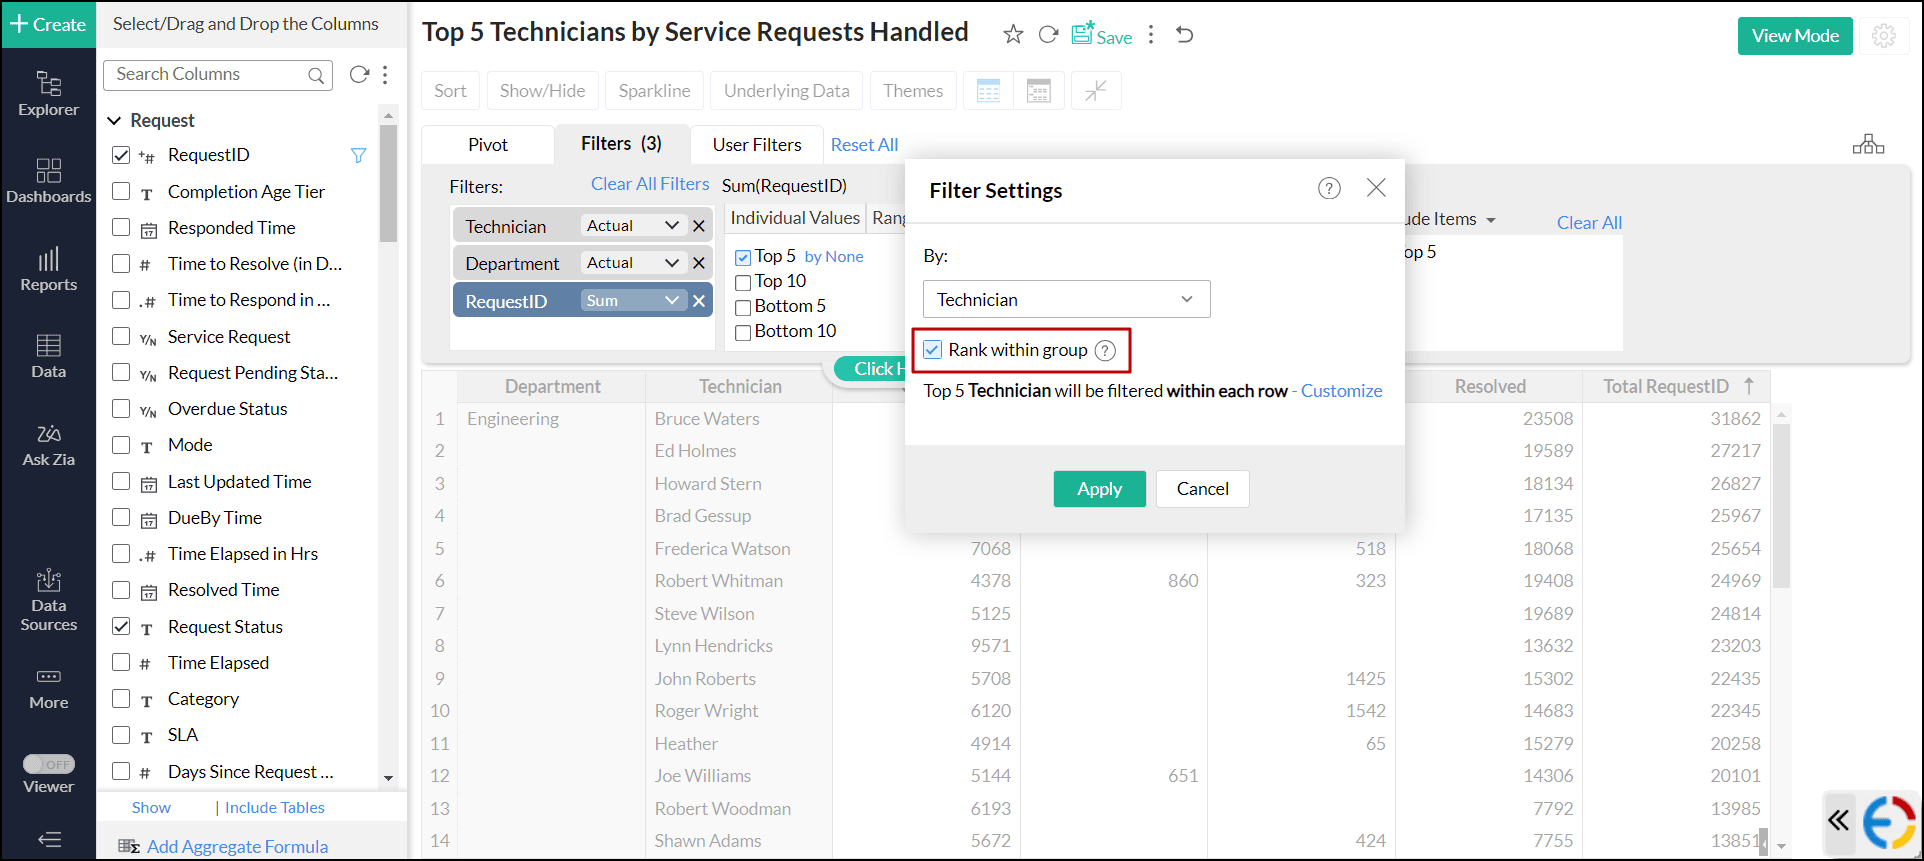
- Select the Rank within group checkbox to rank the data based on their values.
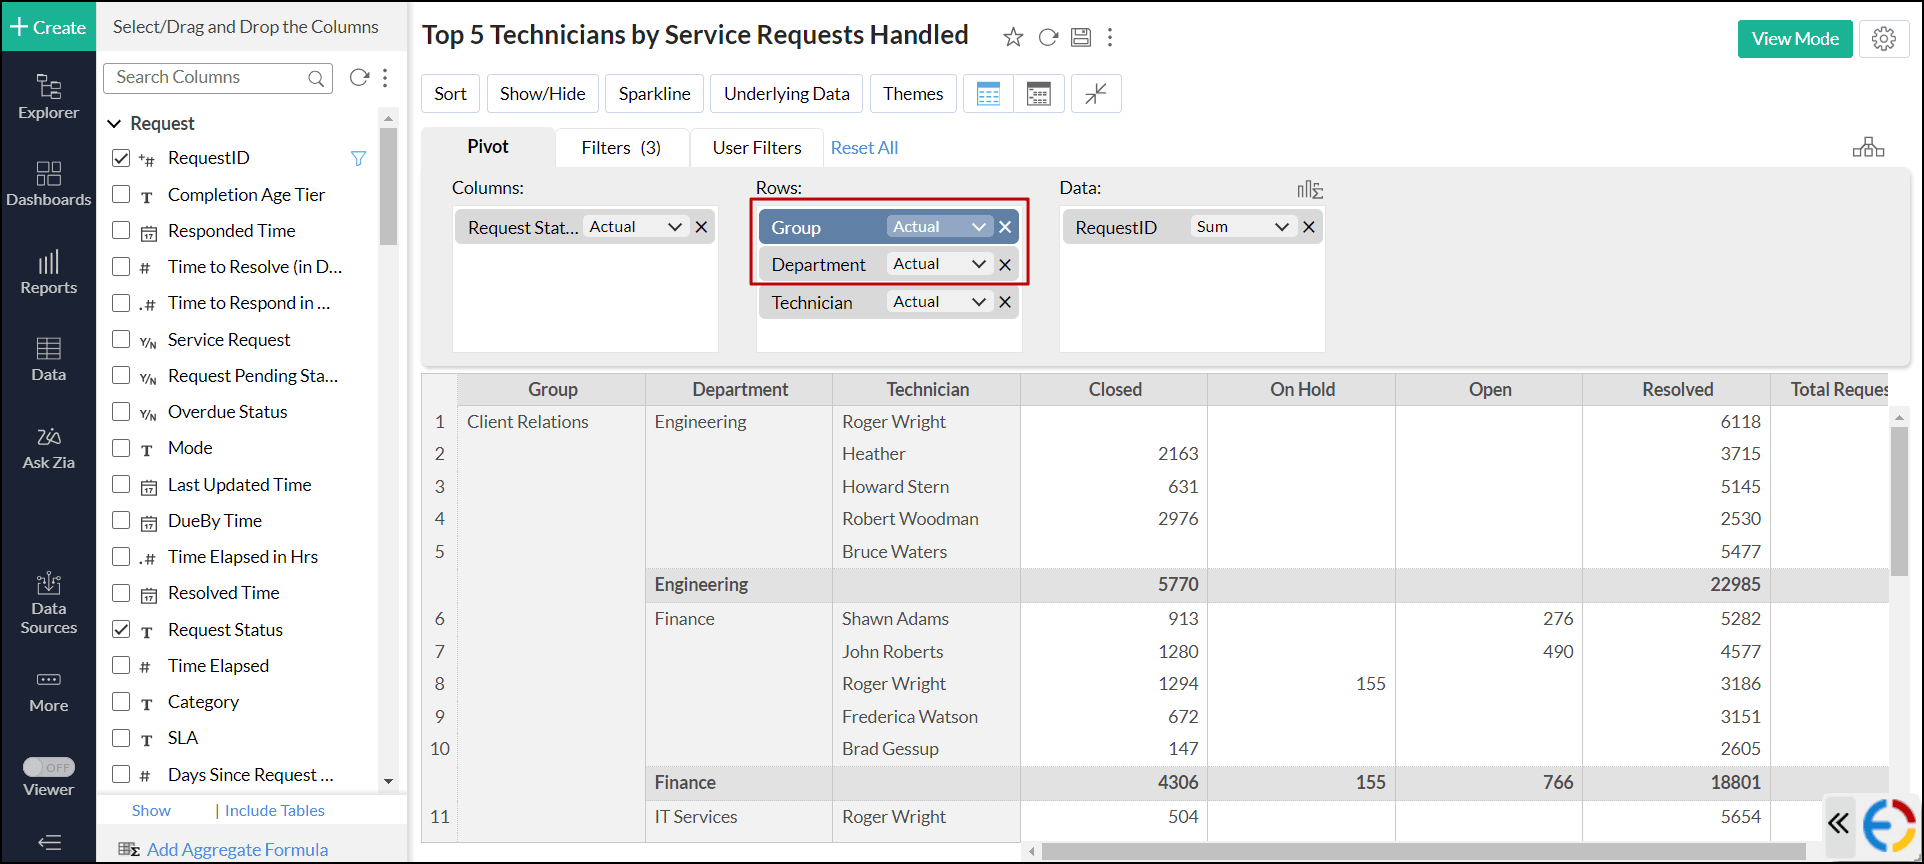
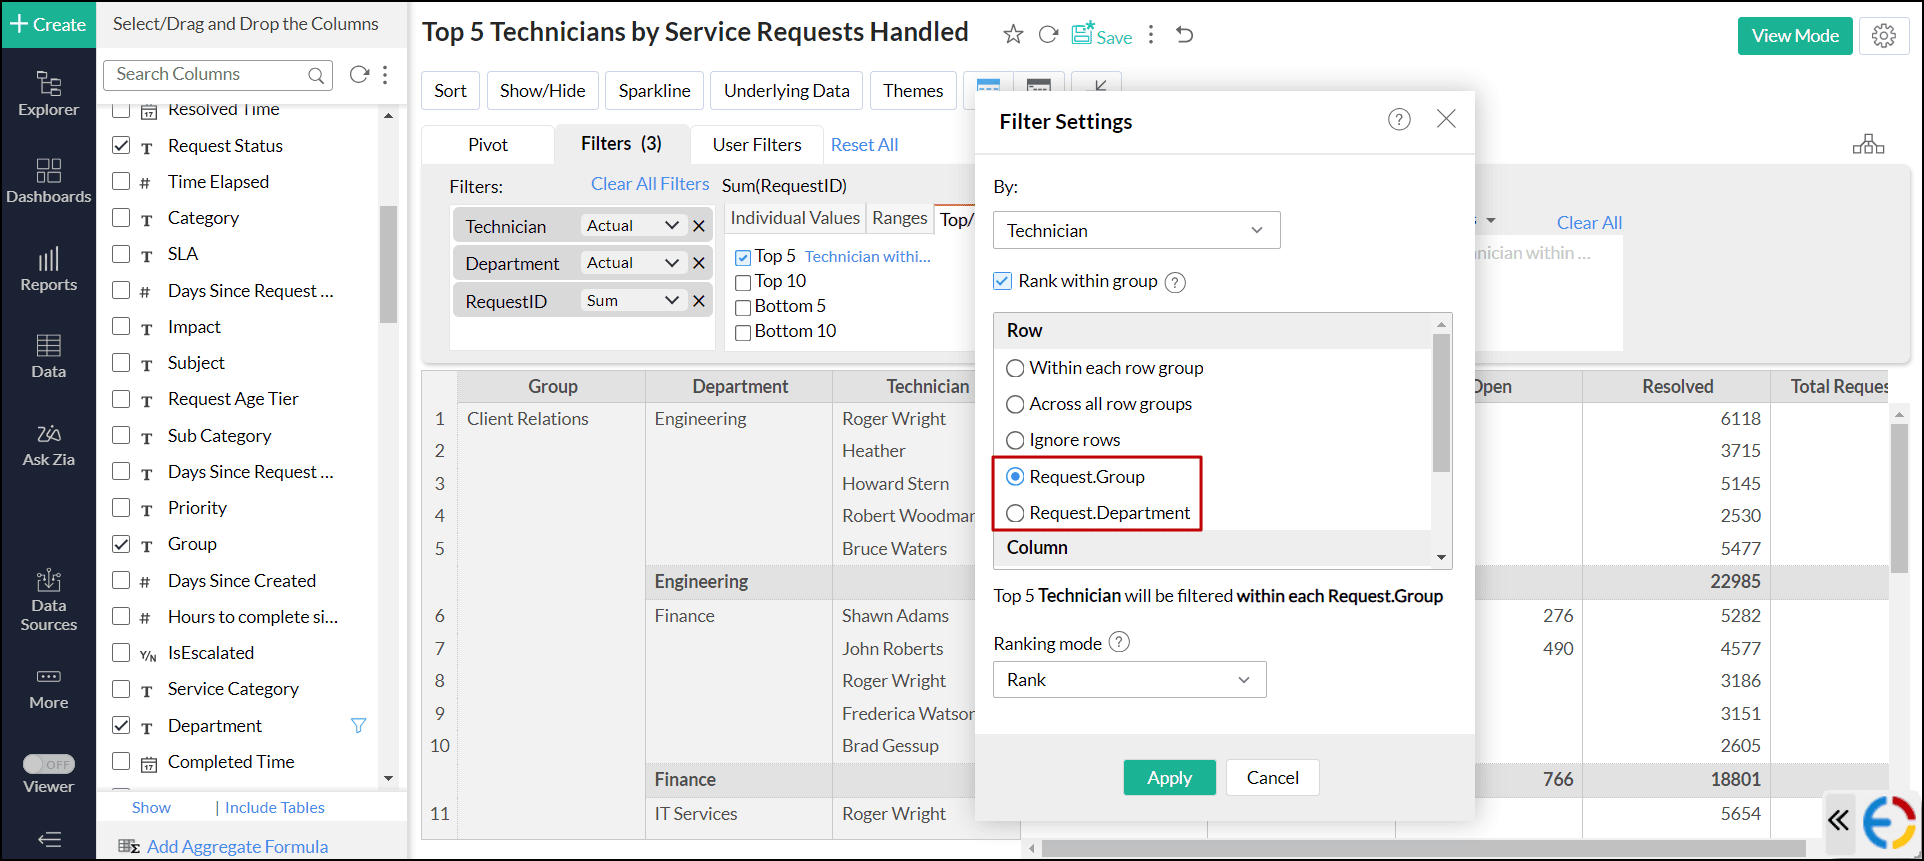
- Click the Customize link to customize the grouping that is used for ranking. The following are the options available:
- Within each group: This option ranks the aggregated data and gets the top or bottom n values from each group in the report.
- Across all groups: This option ranks the aggregated data and gets the top or bottom n values spanning across the entire group of fields.
- Ignore rows or columns: This option is available only for the pivot view, and this excludes all the fields present in the row or column shelf for ranking.
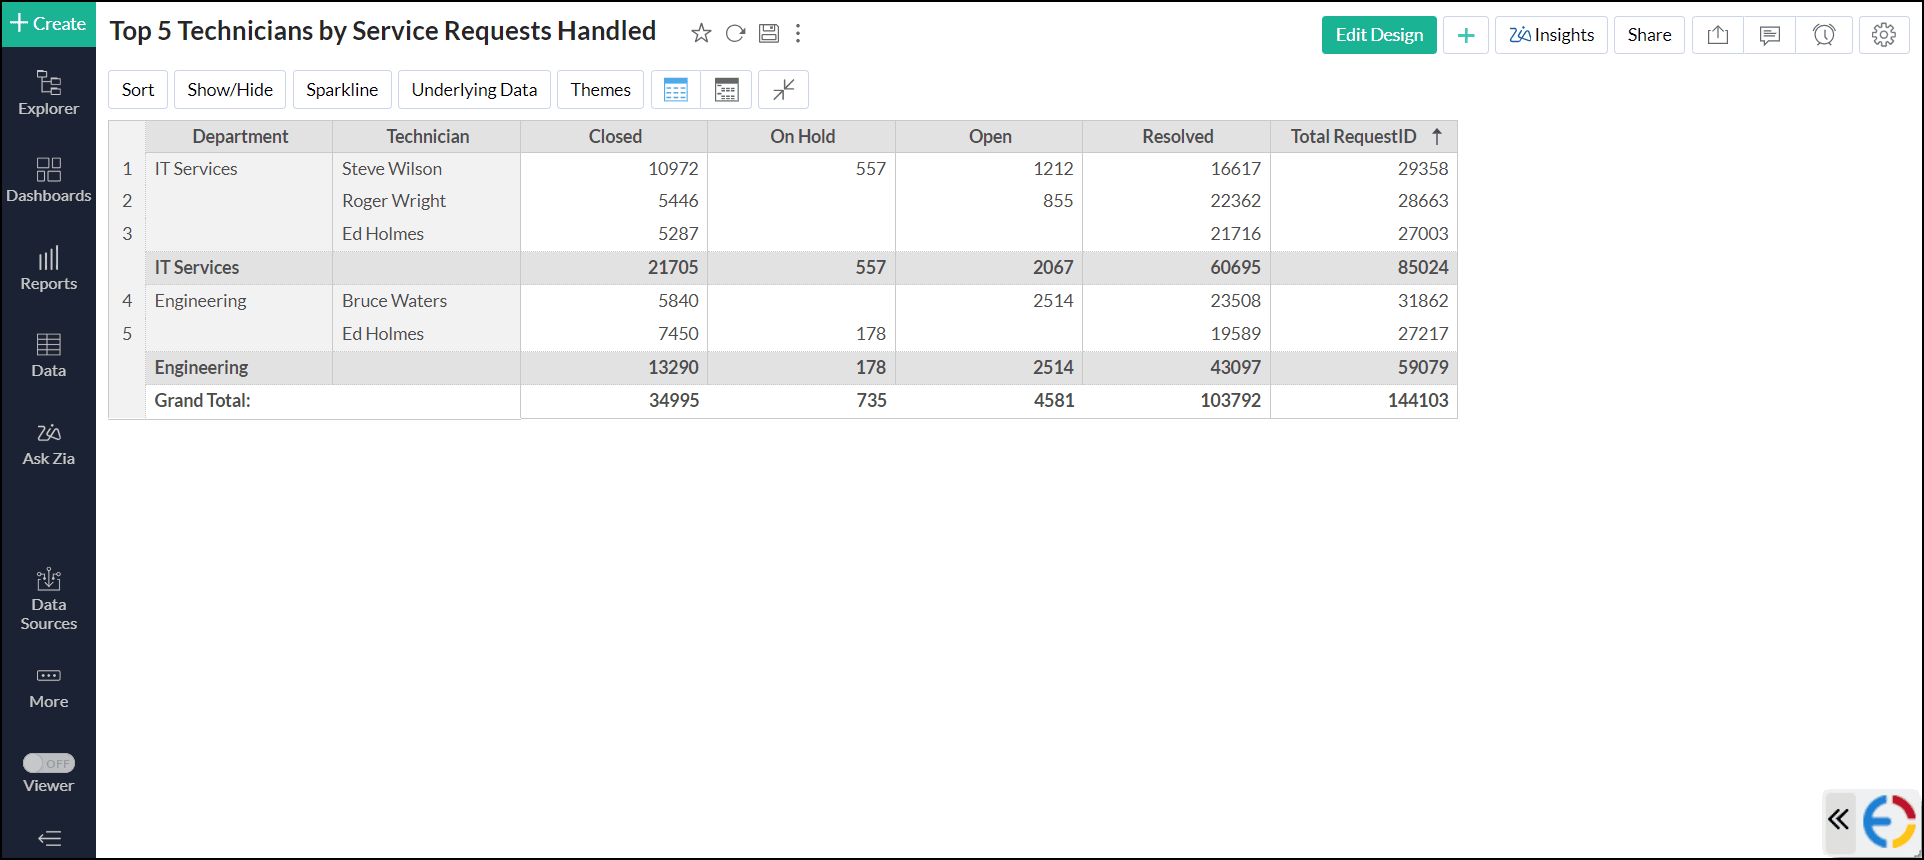
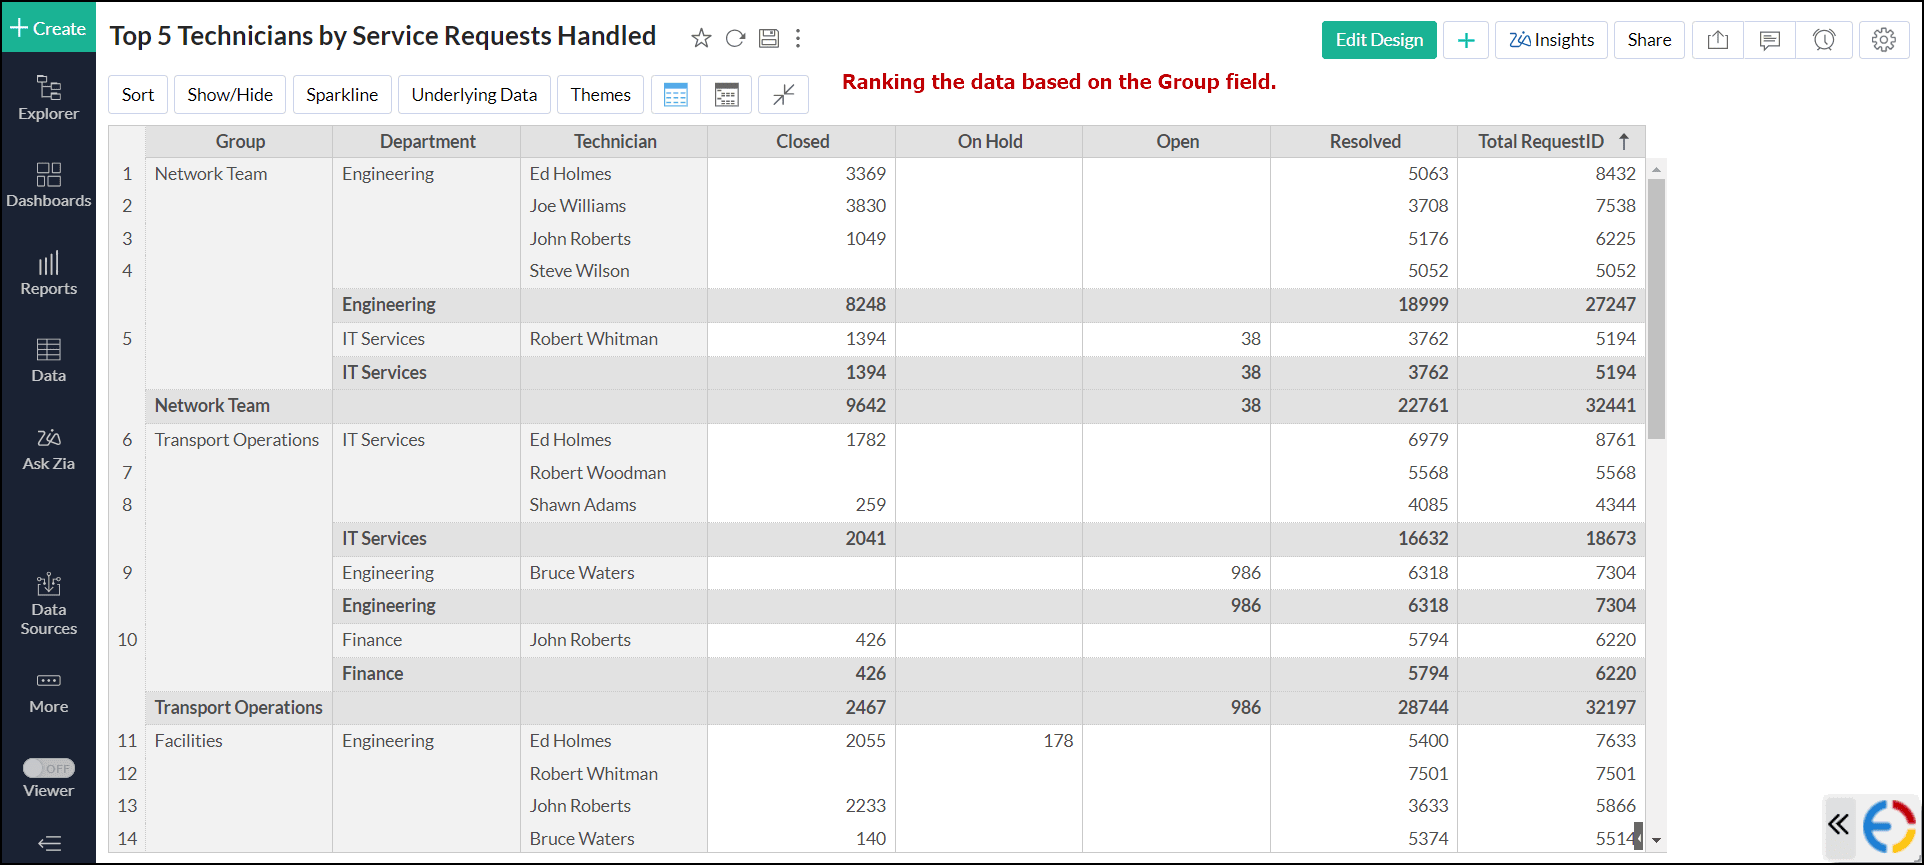
- Fields used in the report: This option allows you to rank the data based on the fields added above the primary field selected for ranking in the designer shelf. In the example below, the Group and Department field is added above the Technician field (the primary field selected for ranking) in the designer shelf.
- Within each group: This option ranks the aggregated data and gets the top or bottom n values from each group in the report.
- Ranking mode: This option enables you to choose the appropriate ranking method. The following are the available options.
- Rank: Columns with identical values are assigned the same rank, leading to a gap in the subsequent ranking numbers. For example, values of 10, 8, 8, and 6 would be ranked as 1, 2, 2, and 4.
- Dense Rank: Columns with identical values are assigned the same rank, and the next distinct value receives the immediately following ranking number. For example, values of 10, 8, 8, and 6 would be ranked as 1, 2, 2, and 3.
- Unique Rank: Each column is assigned a distinct ranking number, even if the values are identical. For example, values of 10, 8, 8, and 6 would be ranked as 1, 2, 3, and 4.
![]()