Creating a tabular view
With Analytics Plus' intuitive drag-and-drop report builder, you can easily create a tabular view within minutes. This document explains the various steps involved in creating the required tabular view.
Creating a tabular view
Follow the steps below to create a tabular view in Analytics Plus:
Open the required workspace and click Create > Tabular View from the side panel.
In the pop-up that appears, select the desired base table and click OK.
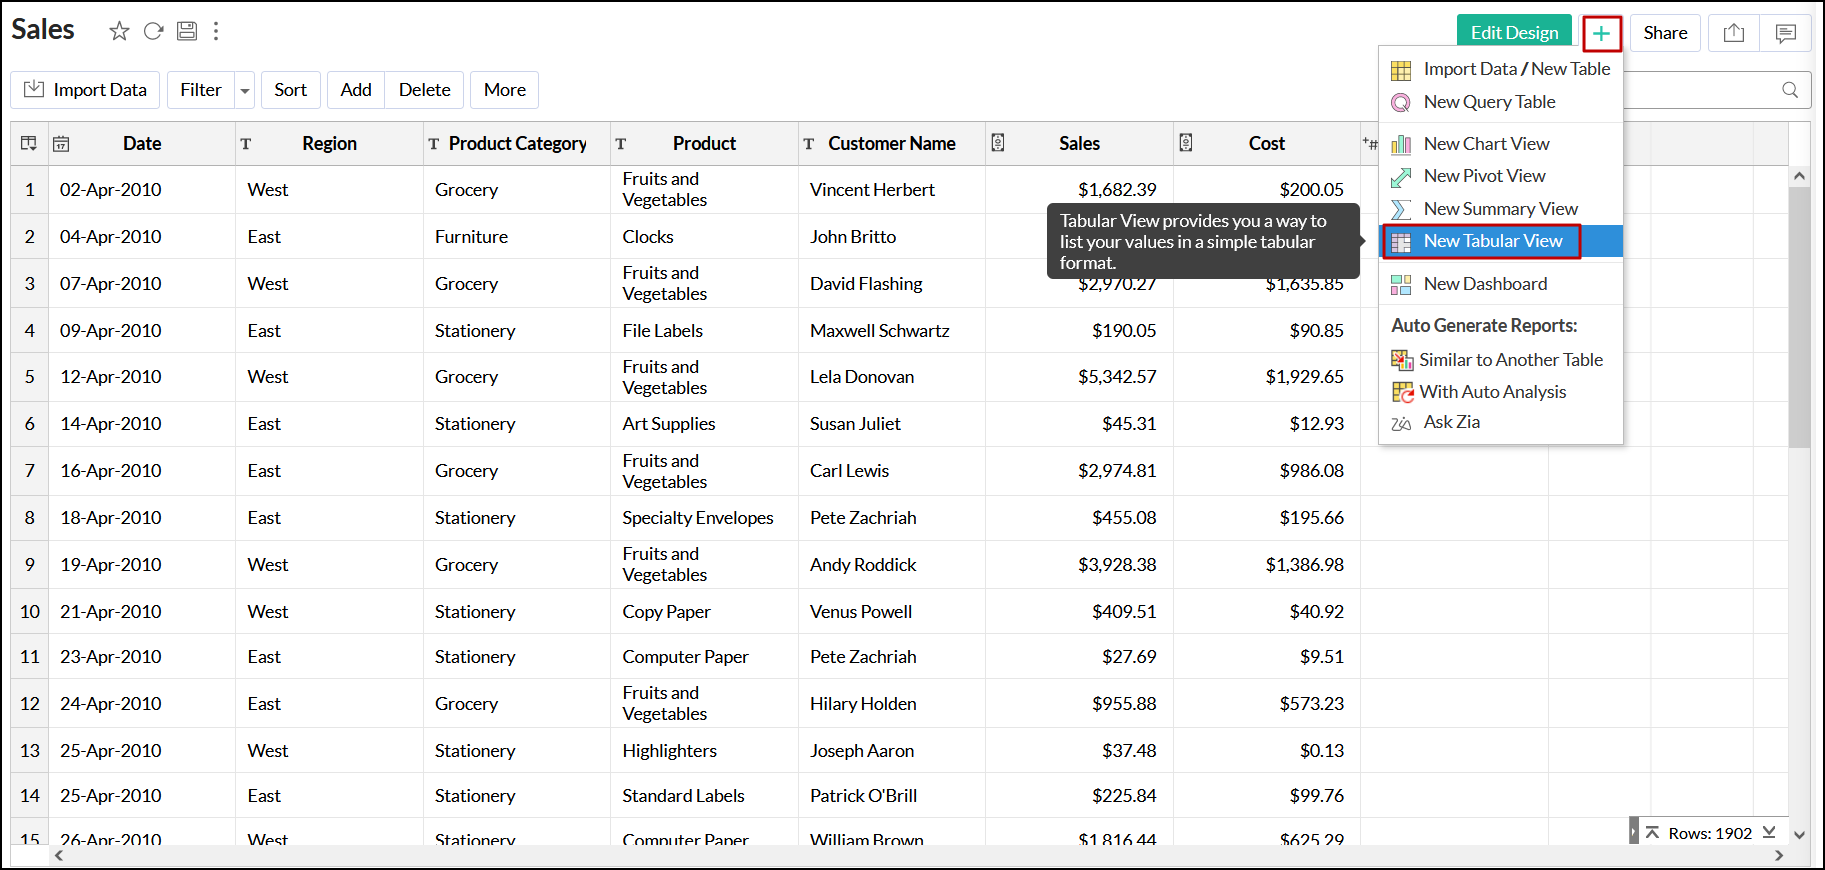
You can also create a new tabular view by opening the required table and clicking the + (Create New) > New Tabular View option from the toolbar.
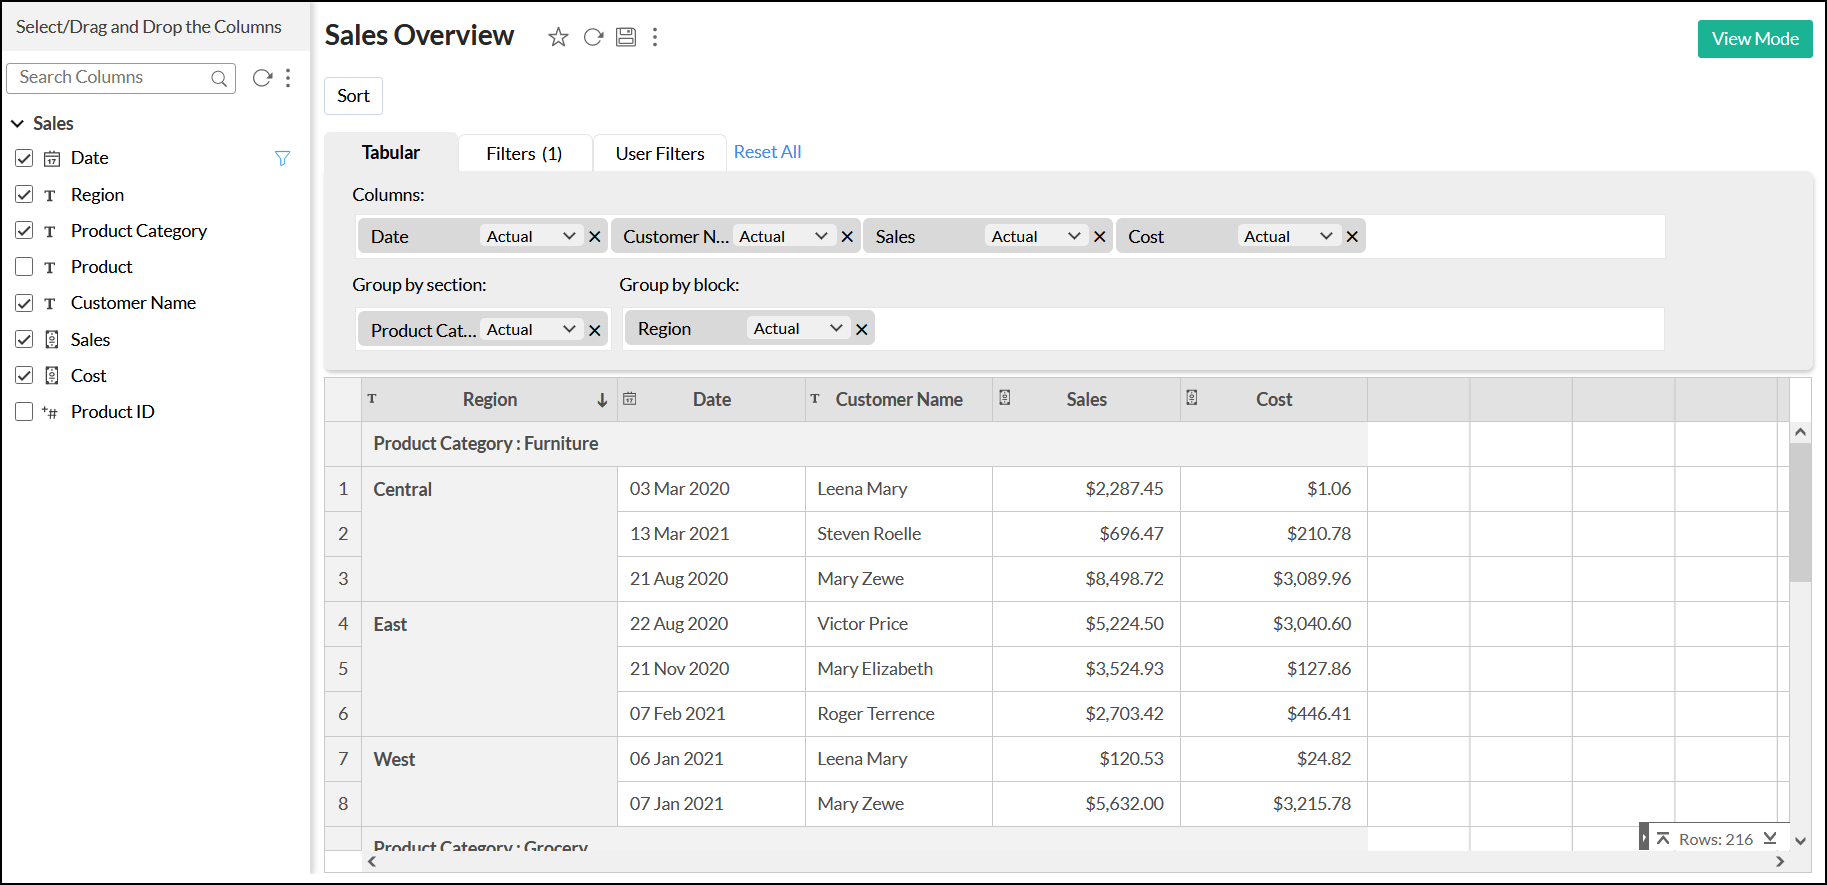
In the Edit Design window that opens, drag and drop the required columns from the left pane to the corresponding shelves in the design area.
You can also select the checkbox beside each column to automatically place the columns in the appropriate shelves.
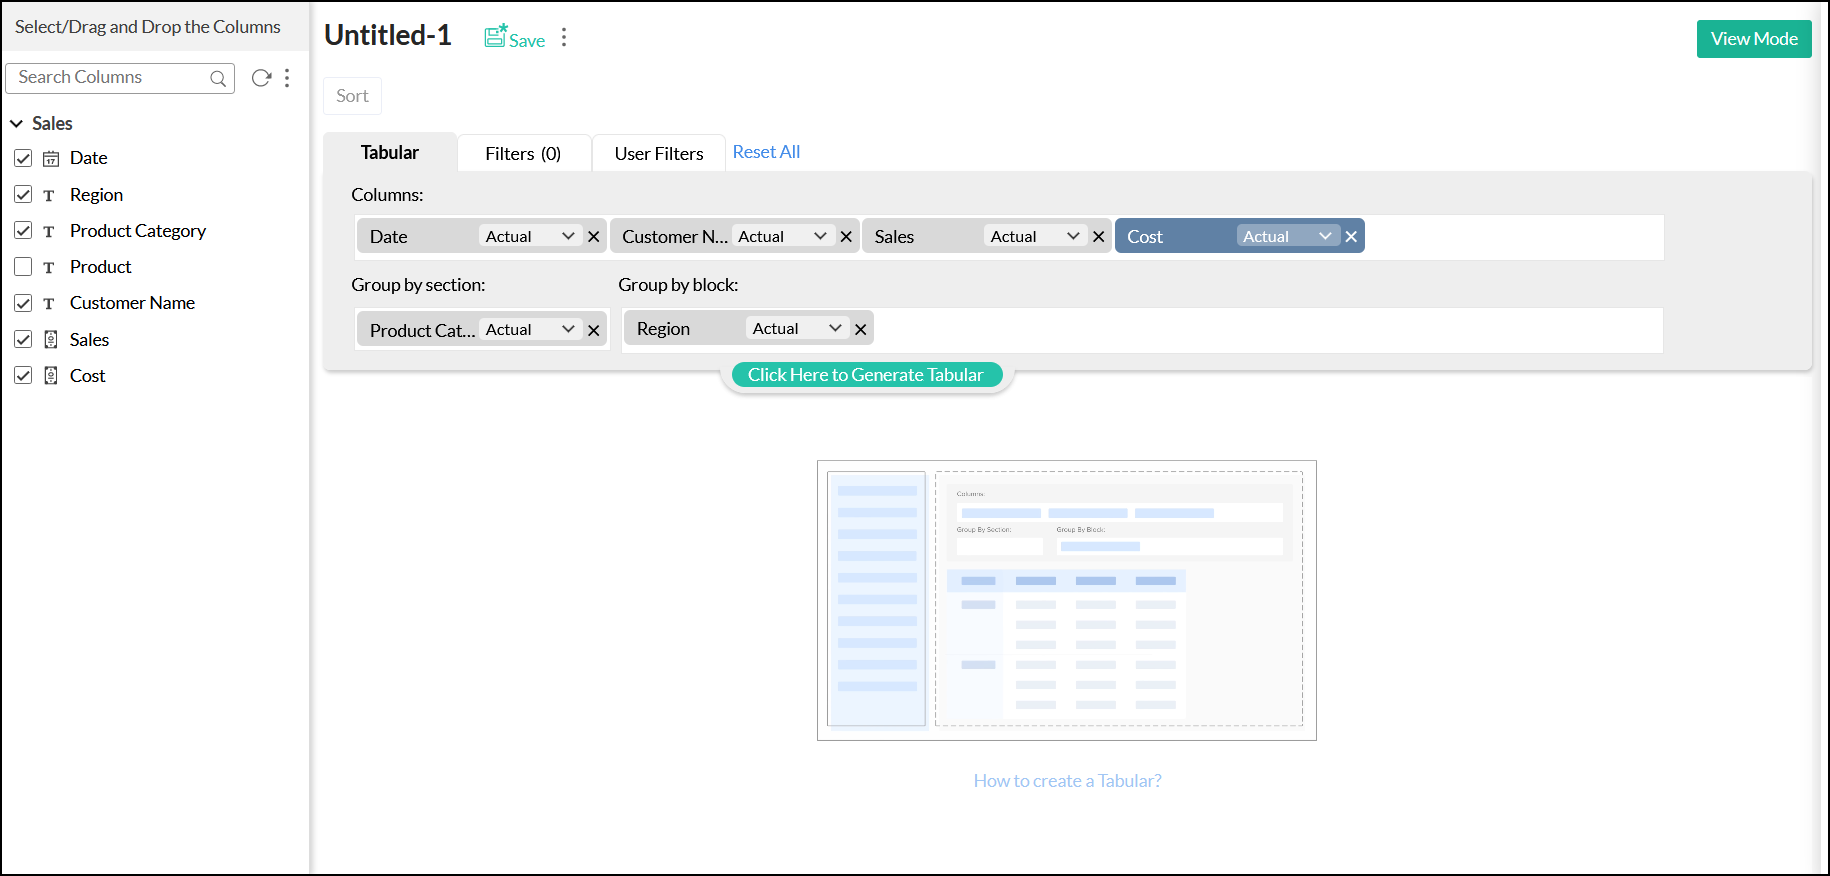
Click the Click Here to Generate Tabular button to create the tabular view.
Click the Save link that appears next to the report's name. In the pop-up that appears, provide a name and description for the tabular view, choose the destination folder, and click OK.
Note: You can only create tabular views using data from a single table.
Shelves in tabular views
The following is a brief description of each shelf in a tabular view:
Columns: Distinct values present in the columns dropped in this shelf will be added as columns to the tabular view. Multiple columns can be added to this shelf.
Group by section: Columns dropped in this shelf will group the view as sections. Only one column can be added to this shelf, i.e., only a single sectional grouping is possible.
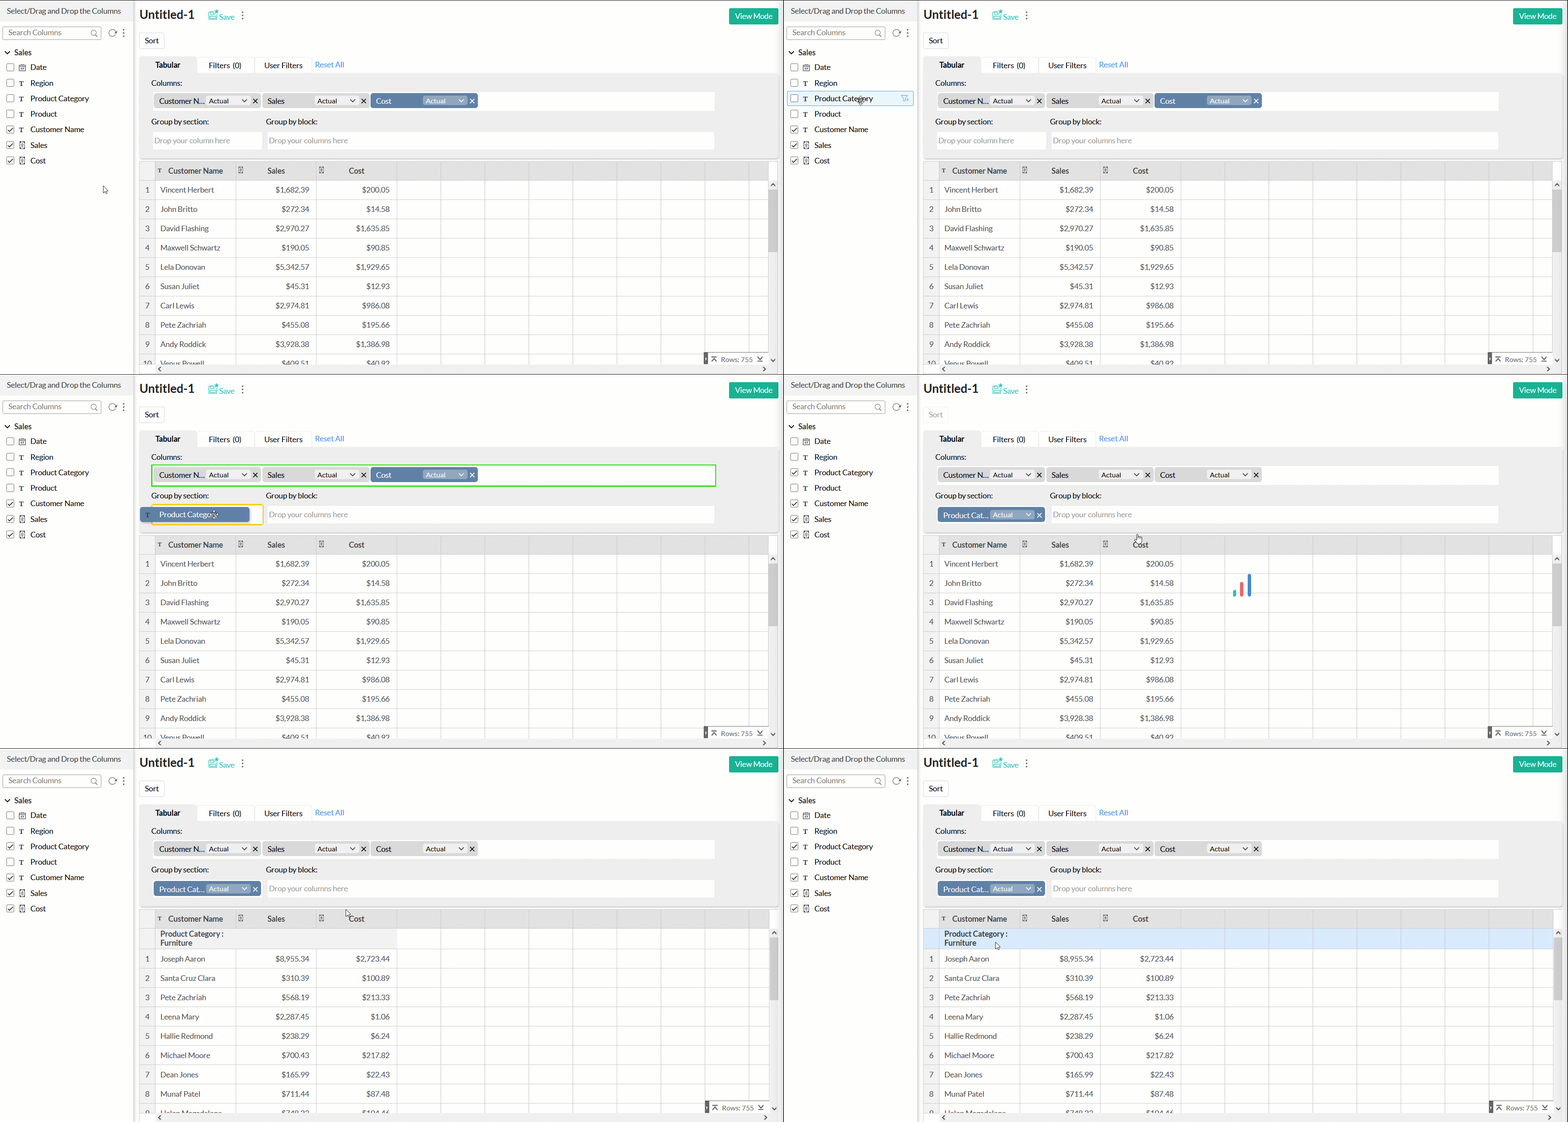
Group by block: Columns dropped in this shelf will group the data rows into blocks. Multiple columns can be added to this shelf and will be displayed as horizontally categorized data, i.e., as a group within a group.
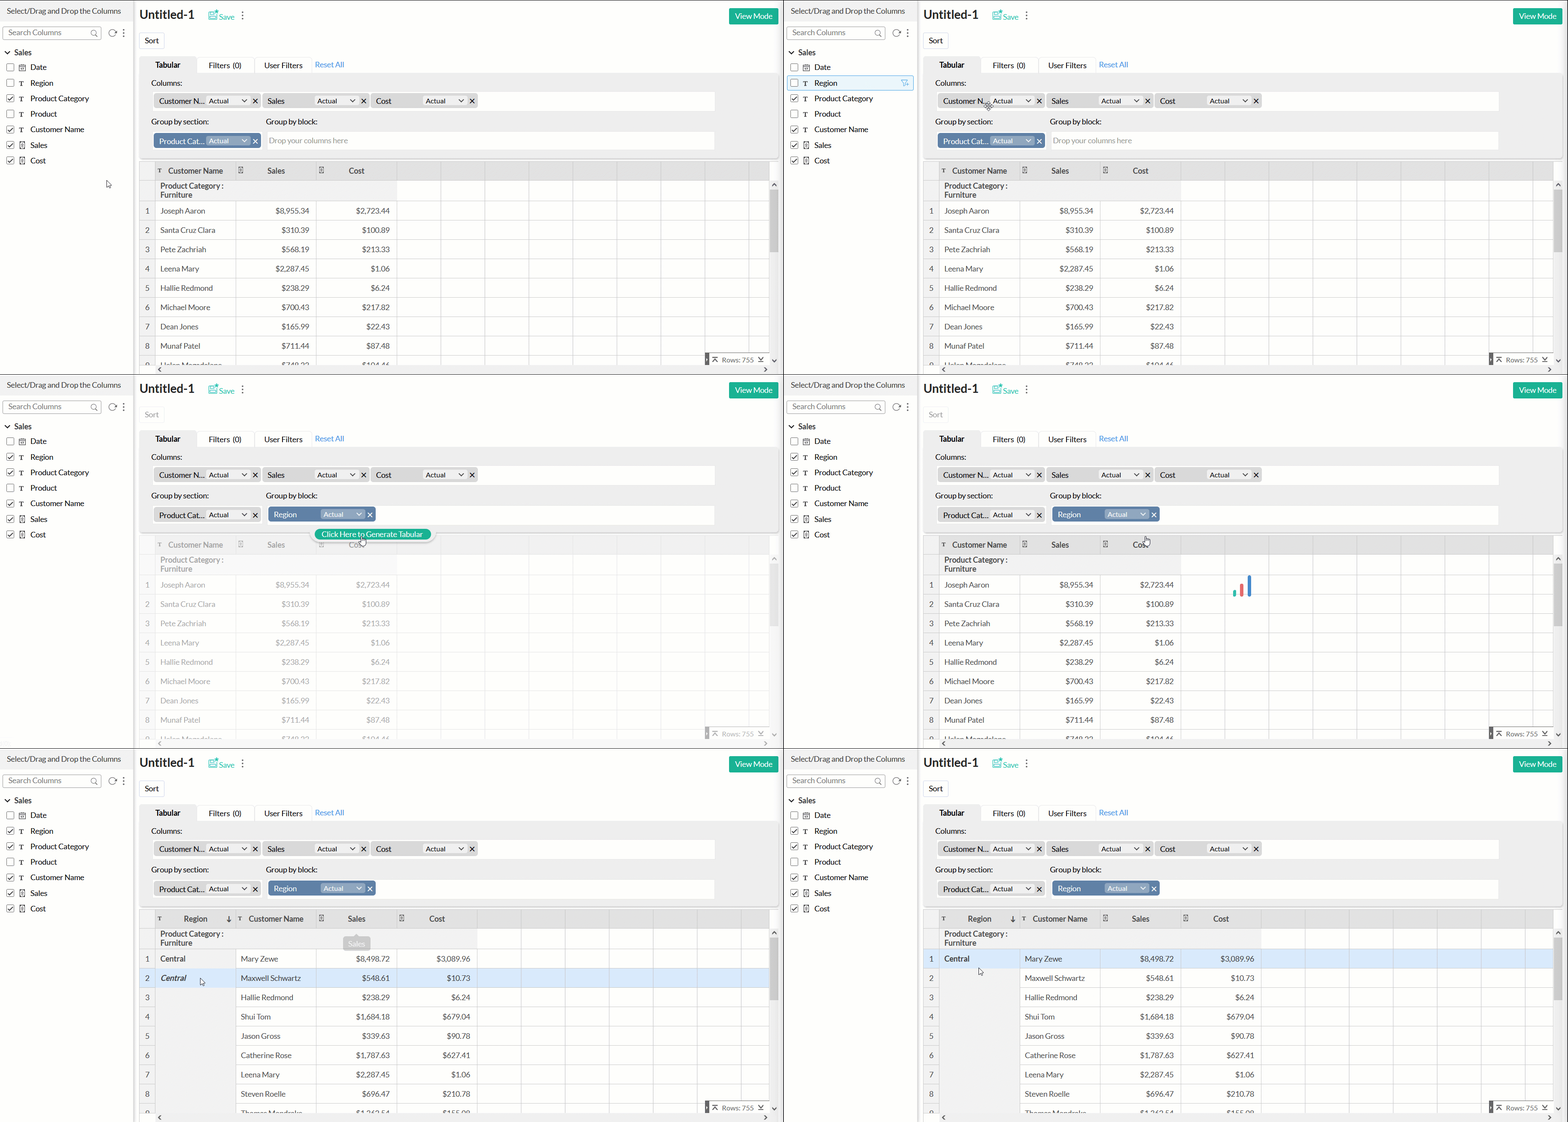
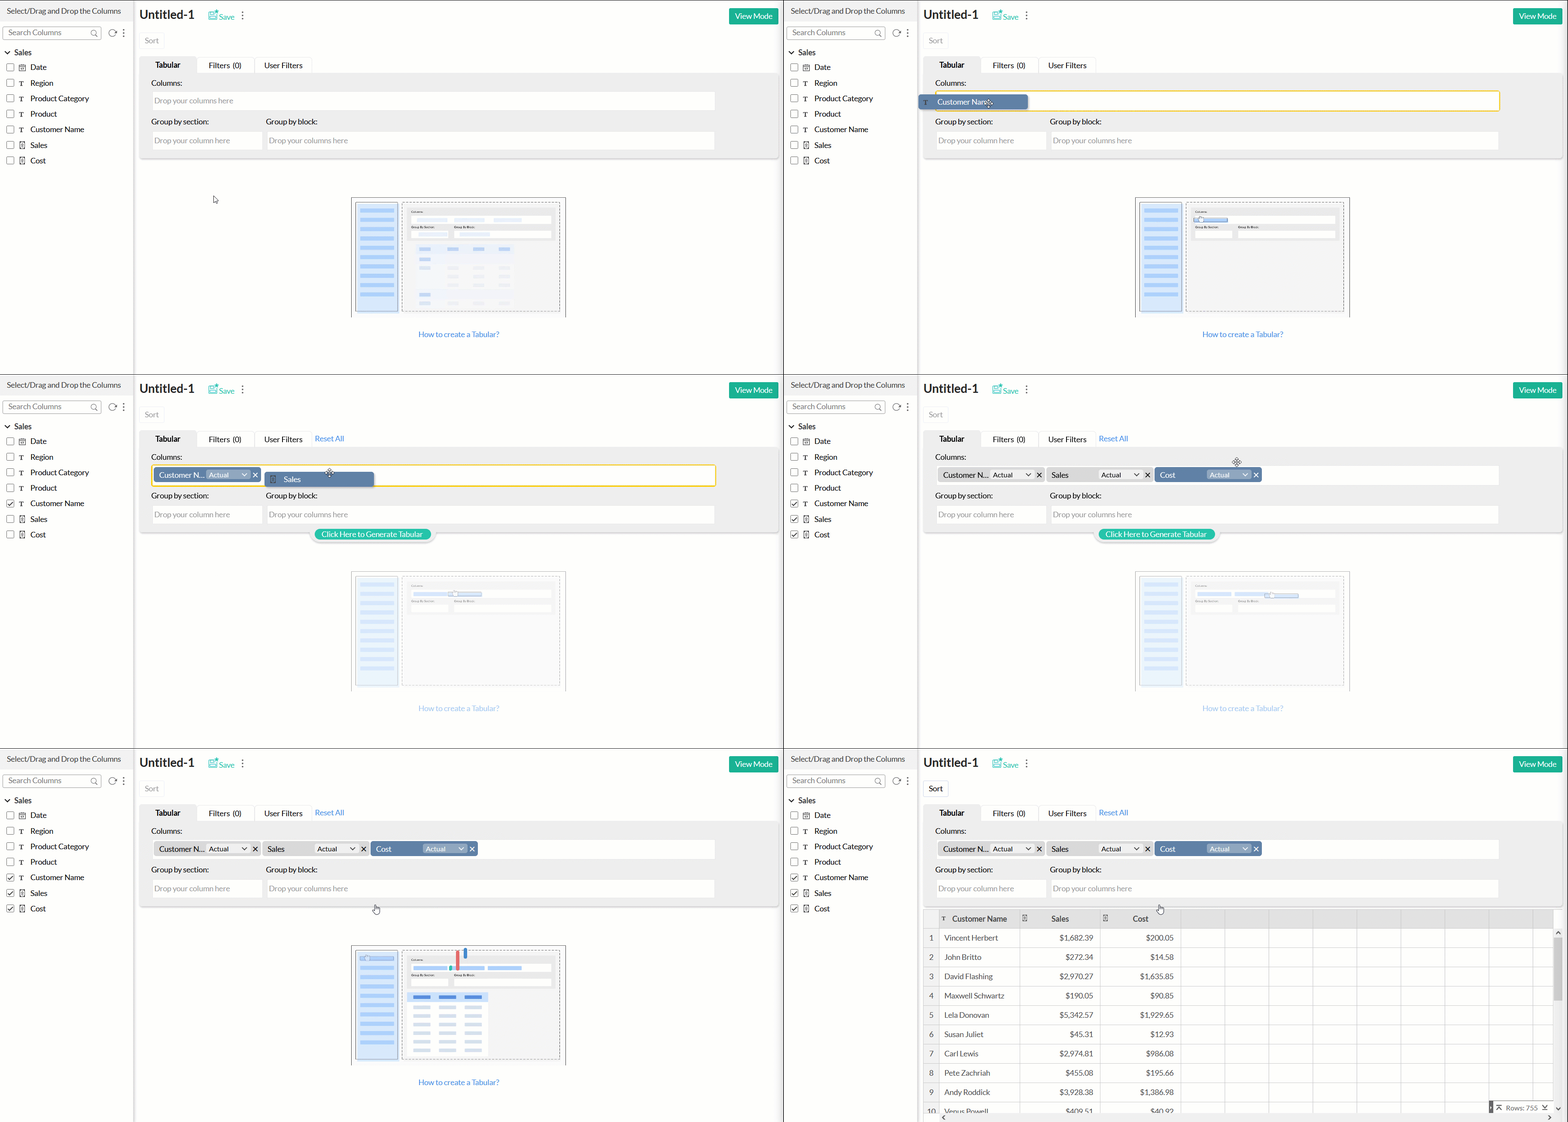
Let's create a tabular view that analyzes the Sales and Costs of products based on the Date and Customer Name.
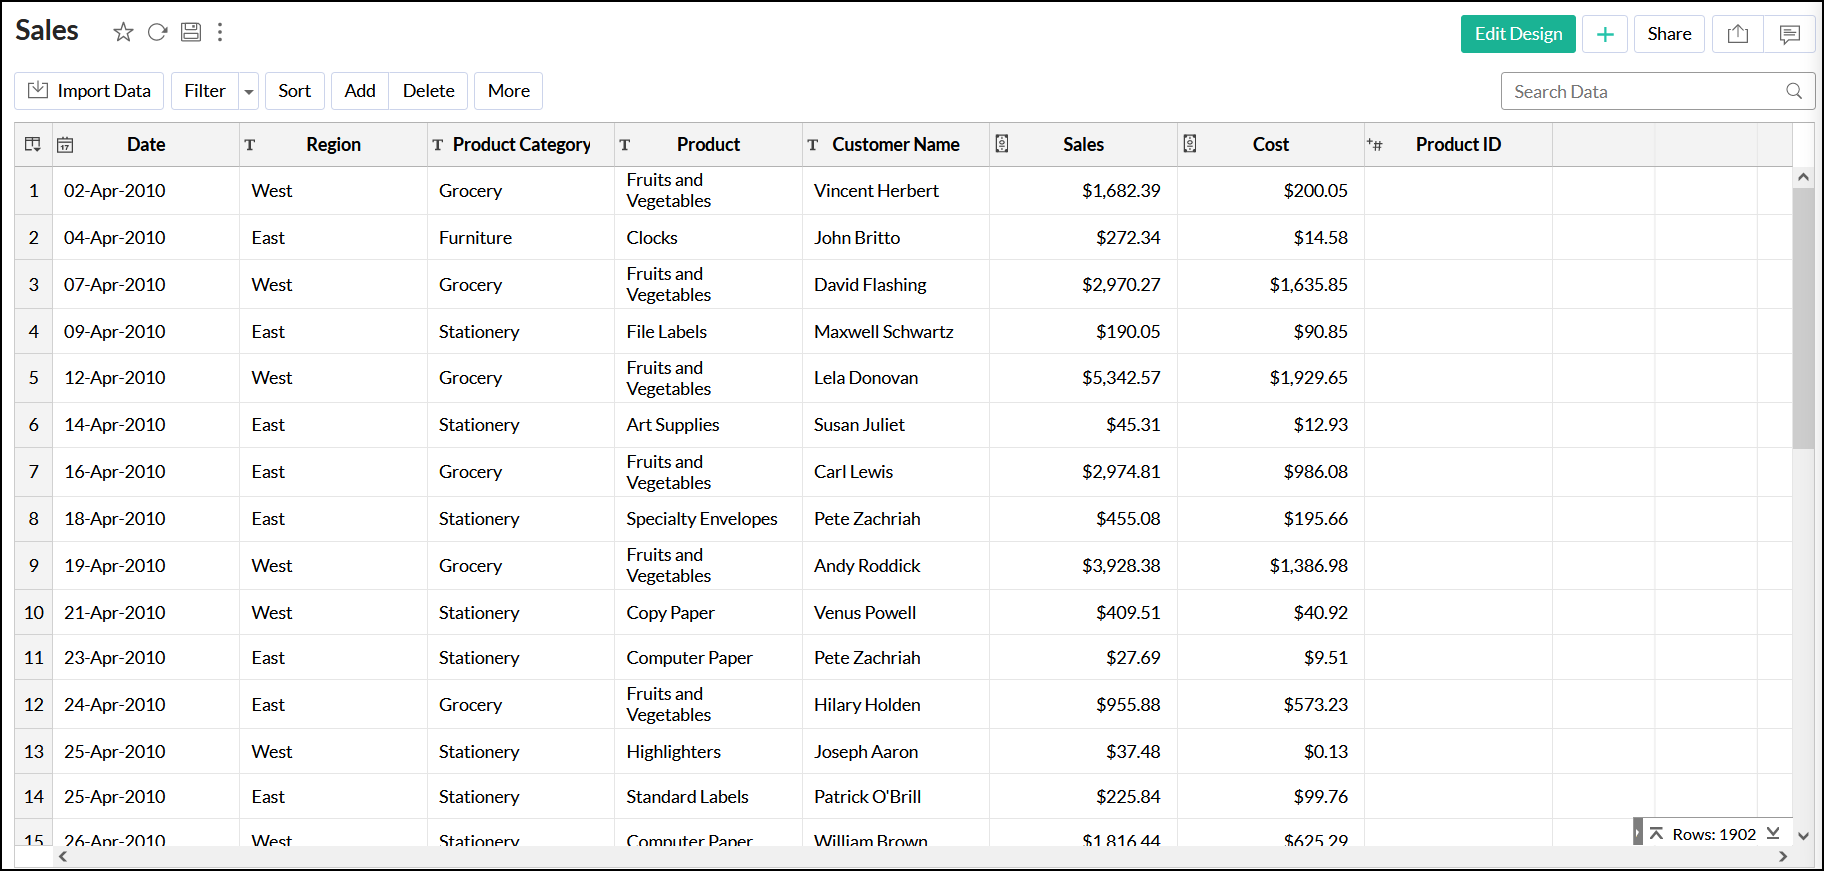
Add the Date, Customer Name, Sales, and Cost columns to the Columns shelf, Product Category column to the Group by section shelf, and the Region column to the Group by block shelf. Click the Click Here to Generate Tabular button to create the tabular view.

Applying summary functions on columns
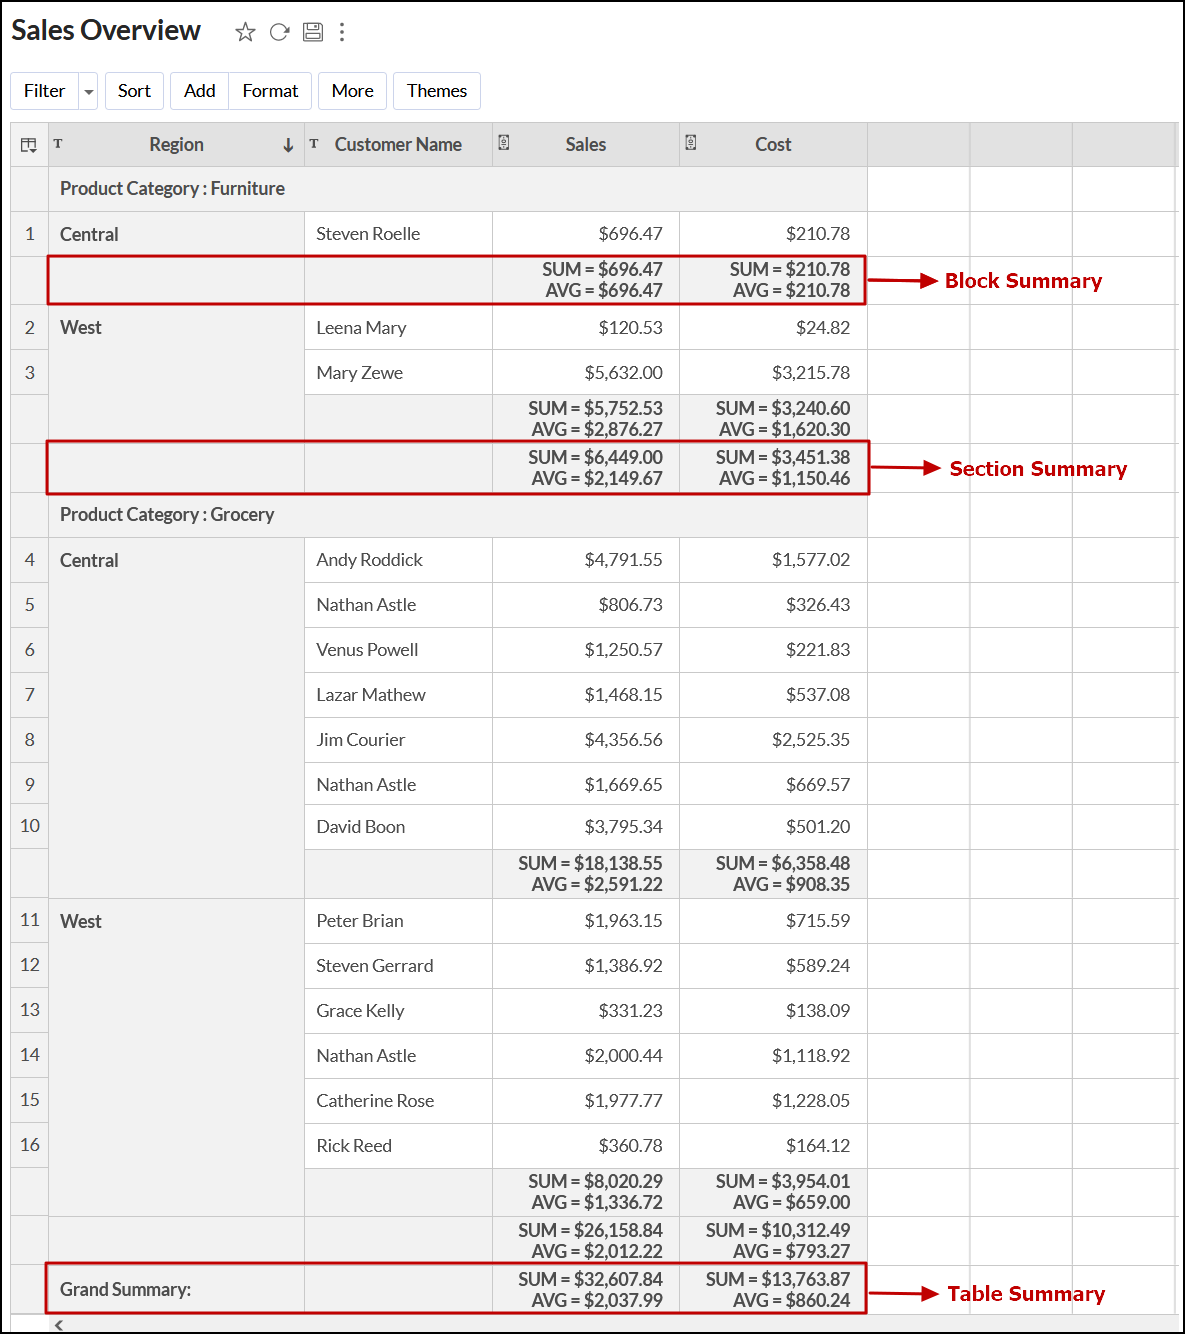
Analytics Plus allows you to apply one or more summary functions to the columns in a tabular view. On applying a summary function over a column, a summary row for each group (block and section), and a grand summary row for the view will be generated automatically.
The following is a list of the various summary functions available in a tabular view:
| Numeric and Currency | |
| Function | Description |
| Sum | This function returns the sum of all the values in a column. If column grouping is applied, then it returns the sum of the values at the group level. |
| Average | This function returns the arithmetic mean of all the values in a column. If column grouping is applied, it then displays the average value at the group level. |
| Count Records | This function returns a count of the total number of records in the column. If column grouping is applied, it then returns the record count at the group level. |
| Min | This function returns the minimum value in a column. If column grouping is applied, it returns the minimum value at the group level. |
| Max | This function returns the maximum value in a column. If column grouping is applied, it returns the maximum value at the group level. |
| Standard Deviation | This function returns the standard deviation of the column. If column grouping is applied, it returns the standard deviation at the group level. |
| Variance | This function returns the variance of the column. If column grouping is applied, it returns the variance of the column at the group level. |
| String | |
| Count Records | This function returns the total number of records in the column. If grouping is applied, it provides the total number of records at the group level. |
Follow the steps below to apply summary functions:
Drag and drop the required columns into either the Columns or the Group by block shelf.
Note: Summary functions can be applied only over the columns dropped in Columns and Group by block shelf.
Click the drop-down present in the column, and select the Show Summary option.
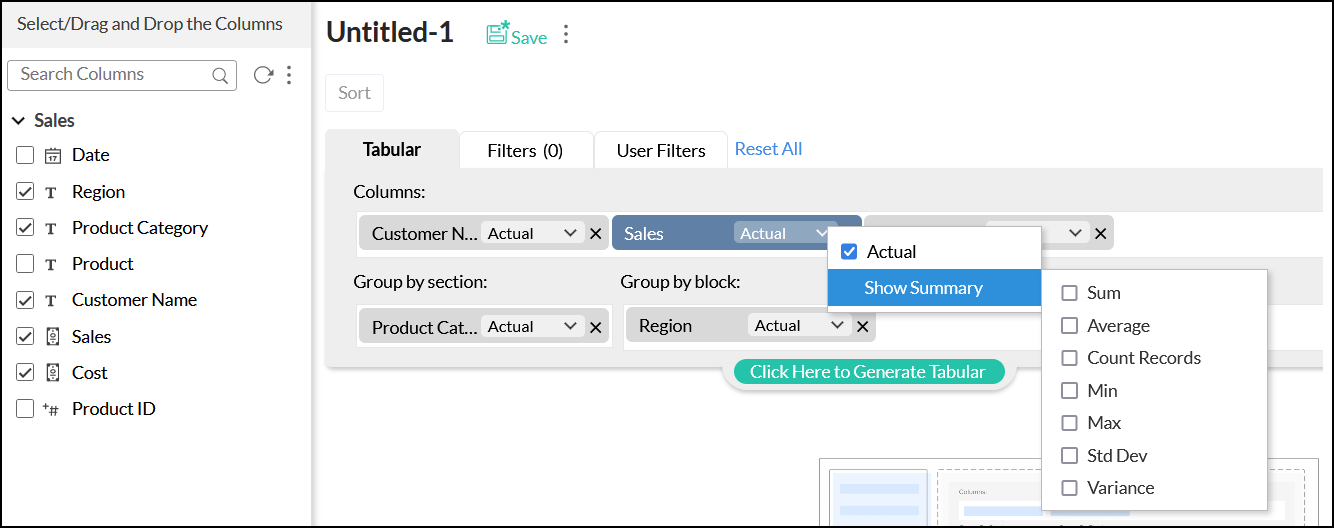
Choose the required summary function. You can also choose multiple summary functions for a column.
Click the Click here to Generate Tabular button to generate your report.
The following tabular view displays the sum and average values of sales and cost for each product category, grouped by region.
Applying filters
Analytics Plus allows you to filter columns based on specific ranges, individual values, date ranges, and more. You can also apply filters to multiple columns in a tabular view. Follow the steps below to do this.
Open the required tabular view in the Edit Design mode.
Navigate to the Filters tab and drag and drop the required column to apply the filter.

On adding a column to the Filters section, Analytics Plus displays a list of every option available for filtering the data. These options vary based on the data type of the added column.

Select one or more values to filter the data. The selected filter items will appear in the Include Items box.
Click the Click Here to Generate Report button to apply the filter.
The filtering options are the same across all types of reports in Analytics Plus. Click here to learn more about filters.
Applying user filters
Analytics Plus also allows you to apply dynamic filters to the report in the form of user filters. It also offers a variety of display components for filters such as drop-down boxes, sliders, and date range chooser.
Follow the steps below to apply a user filter to tabular views.
Open the required tabular view in the Edit Design mode.
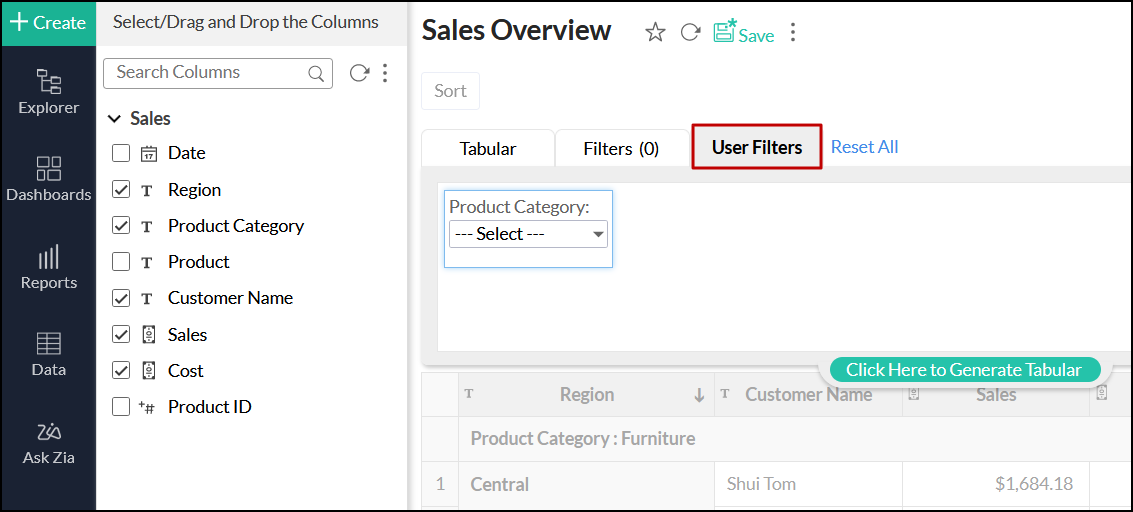
Navigate to the User Filters tab and drag and drop the required columns.
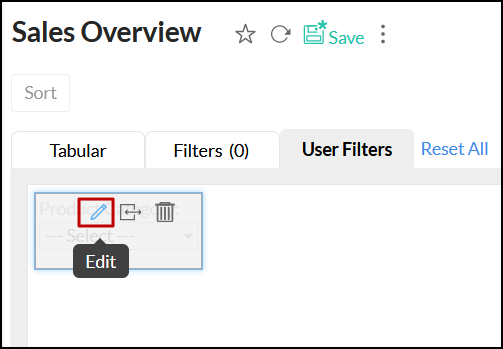
Click the Edit icon that appears on mouse over the added user filter.
In the dialog that appears, configure the required filter options and click OK. These options will vary based on the data type of the dropped column. Click here to learn more about the various user filter options in Analytics Plus.
Click the Click Here to Generate Tabular button to generate the report with the configured user filter.
Adding formulas
Analytics Plus allows you to define powerful mathematical formulas, varying from simple calculations such as addition and subtraction to complex calculations using built-in functions.
Follow the steps below to create a formula column:
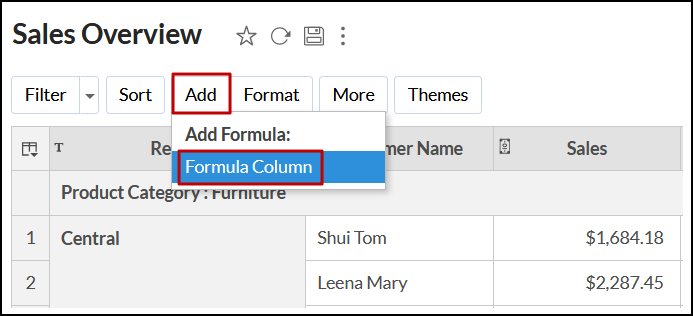
Open the required tabular view in View mode, and click Add > Formula Column.
In the dialog that appears, provide the required formula, and click Save.
A new column with the specified formula will be added to both the report and the underlying data table. Click here to learn more about adding formulas in Analytics Plus.