Configuring System Settings in OpManager
System settings in OpManager allows users to customize their monitoring efforts. Users can enable or disable RDP, restrict the data shared with OpManager, select their default authentication and perform much more operations. This helps them have a tailored monitoring approach for their needs.
To configure System settings, go to Settings-> General Settings -> System Settings.
The system settings comprises of the following four sections.
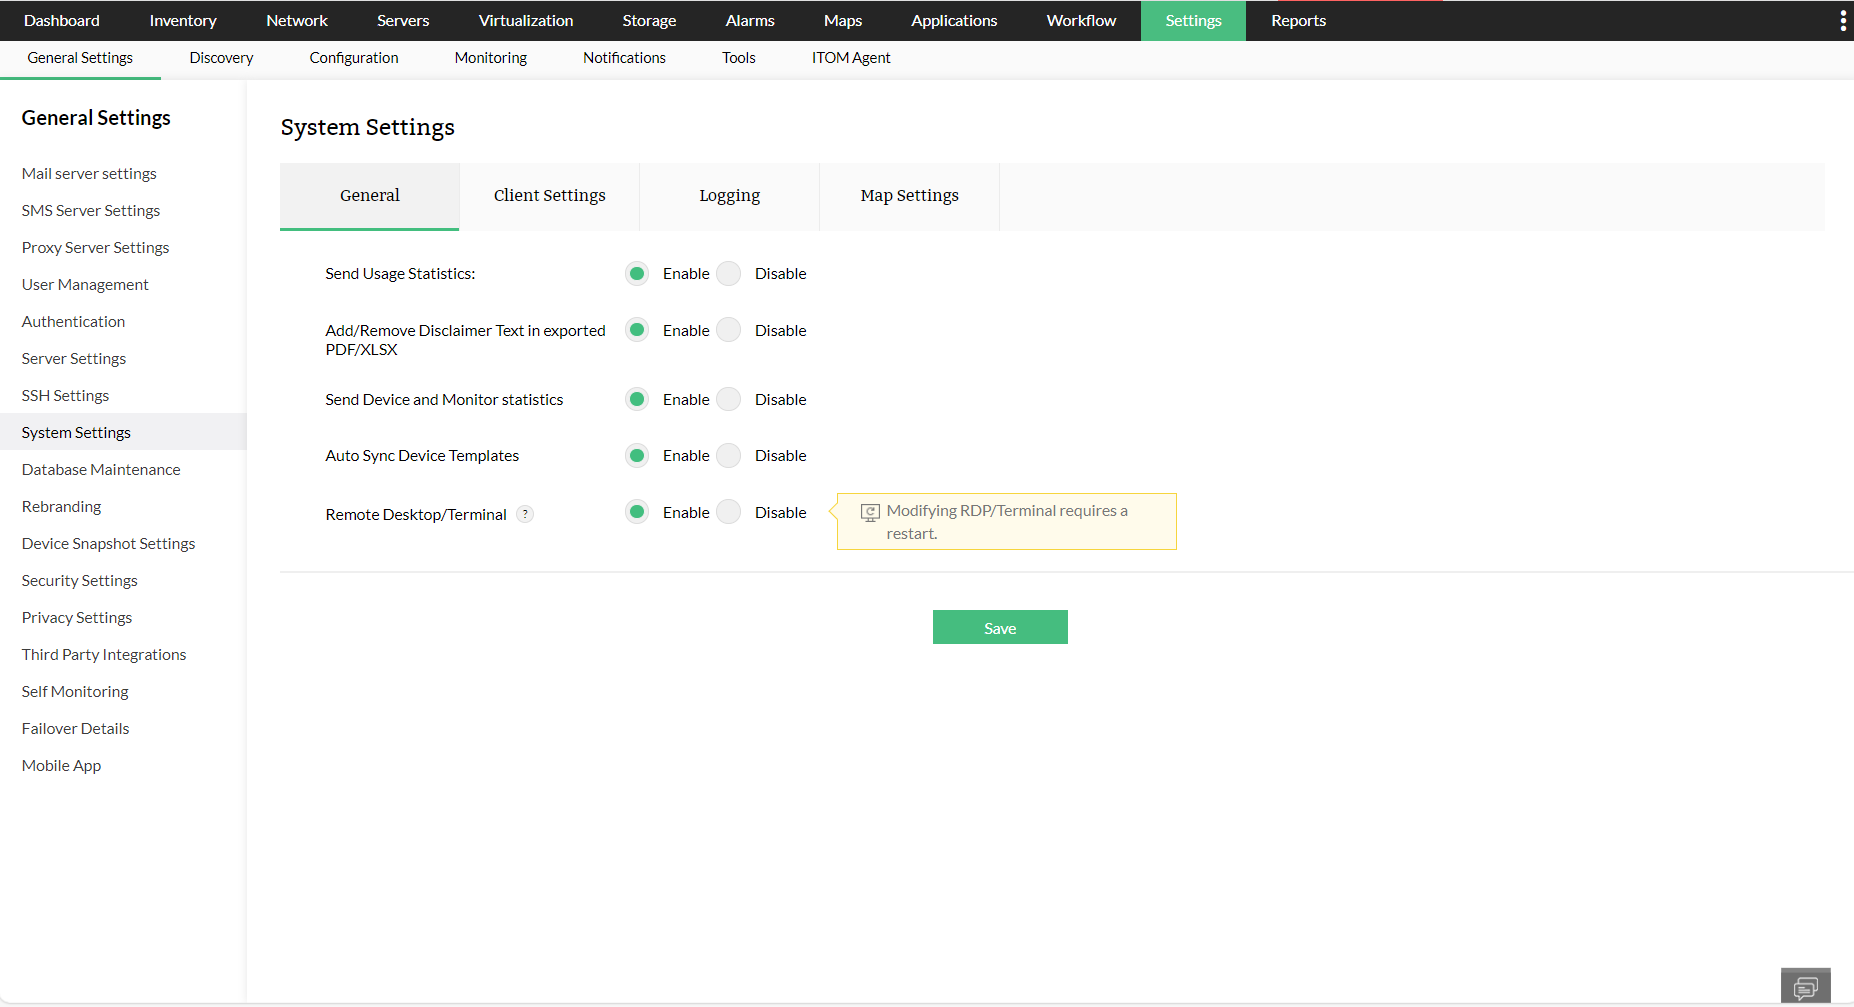
- Send Usage statistics: We collect benchmark and statistical data about quality, stability, and usability of the product from every installation with an intent to enhance the product quality. The collected data will be used as a whole during the analysis and we will not share this data with others. This feature is enabled by default. If you do not want your data to be collected, you can disable it any time.
- Add/Remove Disclaimer Text in exported PDF/XLSX: Enable this option to add or remove disclaimer in all your exported reports.
- Send Device and Monitor statistics: Enable this option to allow OpManager to send anonymous data from the devices and the monitors associated with it. This information will help in enhancing the Device Templates module.

- Auto Sync Device Templates: Enable this option to sync new device templates automatically and update existing device templates by verifying with the OpManager Shared Device Template repository. A device template is a set of predefined properties such as device type, vendor, monitors and the monitoring interval for a device. It lets you automatically classify and associate monitors across multiple devices.
- Remote Desktop/Terminal: Enable this option to allow users to connect to the device's terminal from the device snapshot page (navigate to Inventory → Devices and click on the device name). Additionally, it will also provide access to Remote Desktop Protocol (RDP) port from OpManager.
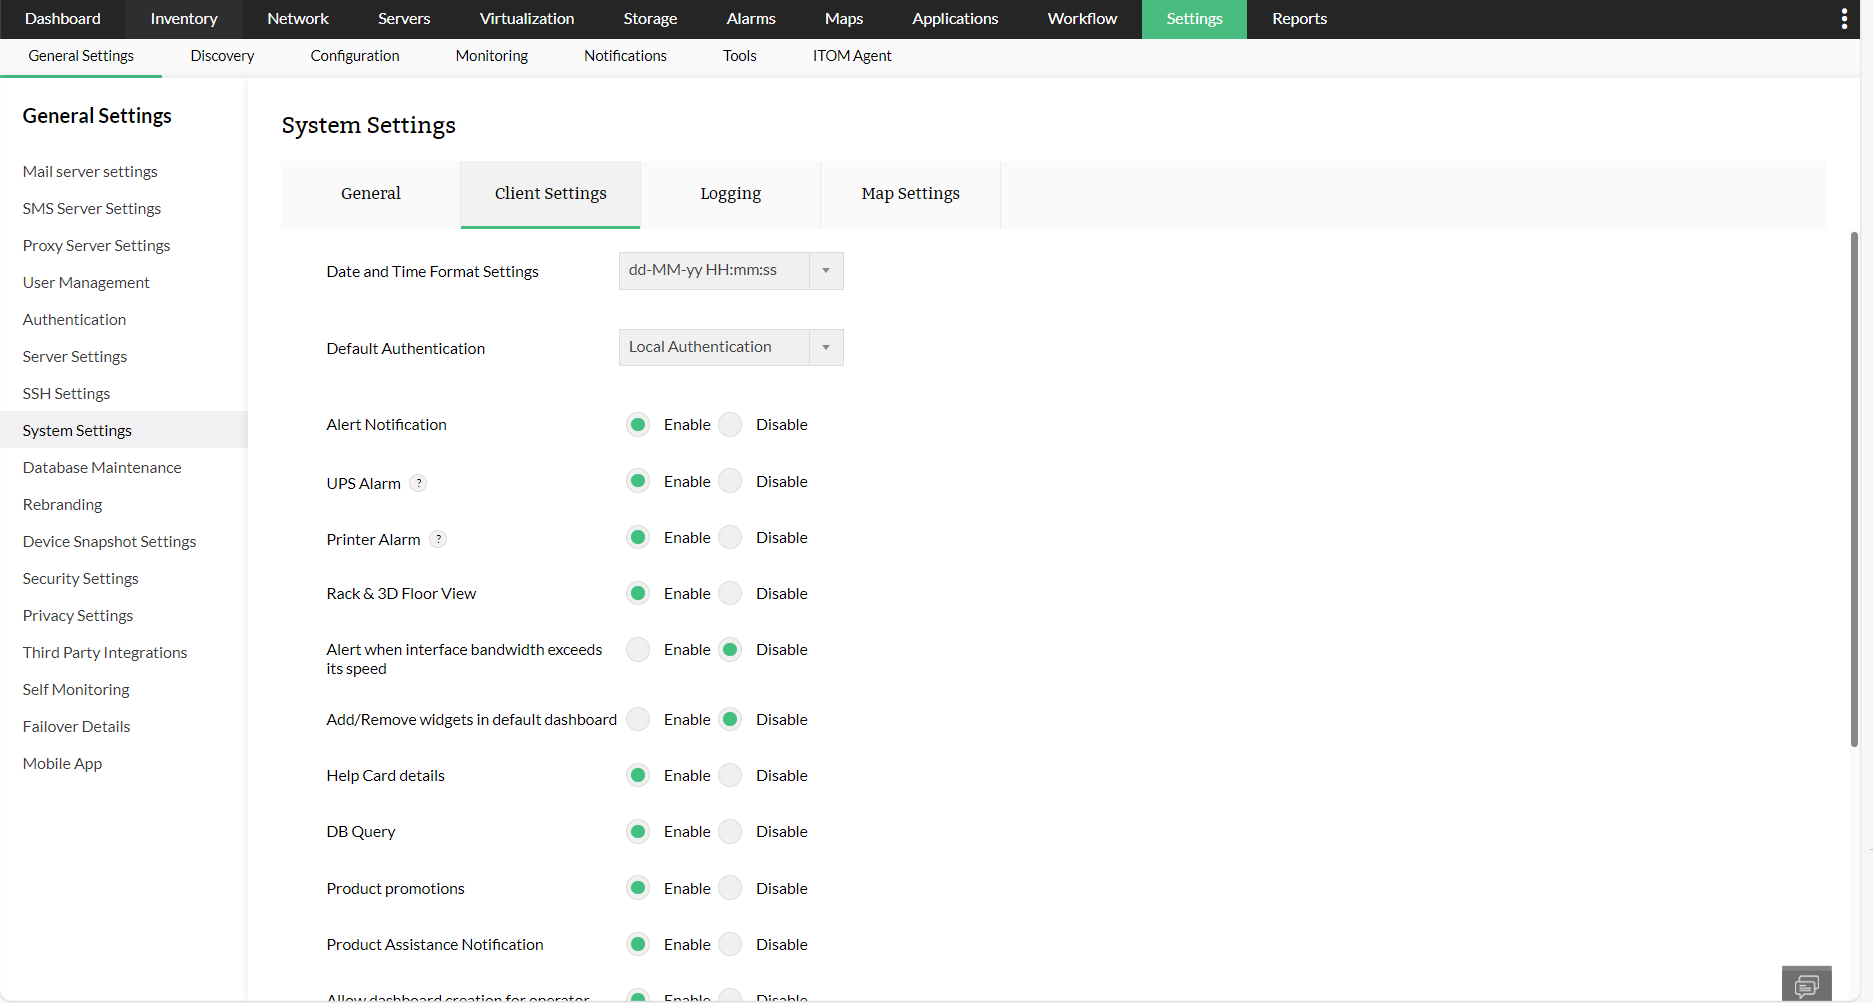
- Date and Time Format Settings: Select the required format for the date and time to be displayed in the OpManager web client. For exported reports, the report generated time will be based on the selected date and time format.
Default Authentication: Authentication mechanism to authorize access to OpManager. It can either be local or domain specific authentication. Authentication type chosen here will be displayed in the login page and will set as the default authentication mode for OpManager.
- Alert Notification: When an alarm or alert is triggered, a notification pops up at the bottom right corner of the client. This option can be used to show/hide the notification from popping up on your screen.
- UPS Alarm: This option allows you to view/hide the alarm notifications generated by UPS.
- Printer Alarm: This option allows you to view/hide the alarm notifications generated by printers.
- Rack & 3D Floor View: Enable or disable viewing the Rack & 3D Floor View in Maps.
- Alert when interface bandwidth exceeds its speed: To keep your interface bandwidth in check, enable this option. When the bandwidth of an interface exceeds its configured speed, an alert will be raised.
- Add/Remove widgets in default dashboard: To add/remove widgets on your default dashboard, enable this option.
- Help Card details: View the in-product How-to and FAQs by enabling this option.
- DB Query: Enabling the DB Query option allows you to execute all read-only queries in the Submit Query window (Eg: select * from <tablename>). To get to the Submit query window, 'Enable' the DB Query option, click on the support icon and select DB query in the support window, or alternatively press Alt+Q.
- Product promotions: Enable this option to receive in-product promotions and training announcements that includes helpful webinars and product training sessions.
- Product Assistance Notification: This option allows you to enable or disable the helpful information that appears in the product that helps you utilize our product better.
- Allow dashboard creation for operator: If enabled, the operator user will get access to create their own custom dashboard.
- Chat support: Enable this option to reach out to our support team via chat.
- Real Time Chart Rendering Mode: Toggle between SVG and Image option to view the real-time charts.
- Display product recommendations from ManageEngine: Allow ManageEngine OpManager to recommend you other solutions for your ITOM needs.

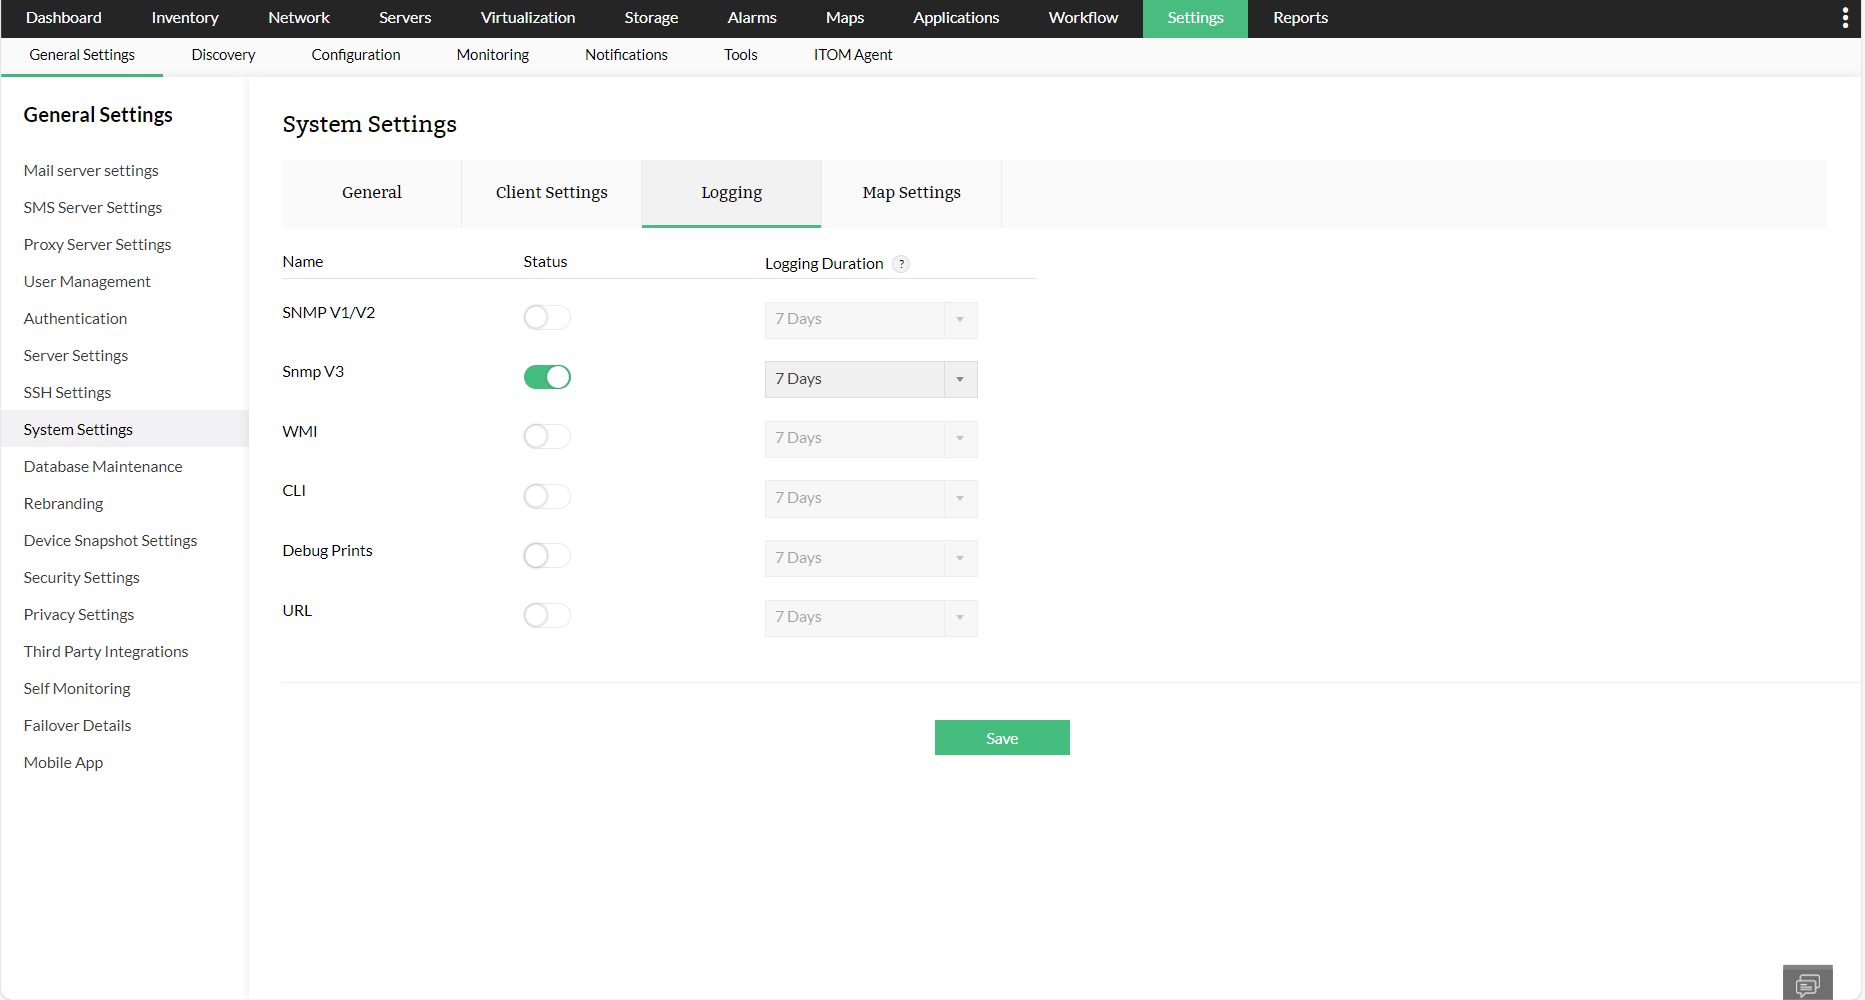
Users can enable or disable the status of SNMP v1/v2/v3, WMI, CLI, Debug Prints and URLs. Furthermore, users can also configure the duration to auto-disable logging, since logging for longer degradation might impact application performance.

OpManager allows users to customize the colour code, to visualize the traffic links between various devices in Business views.
