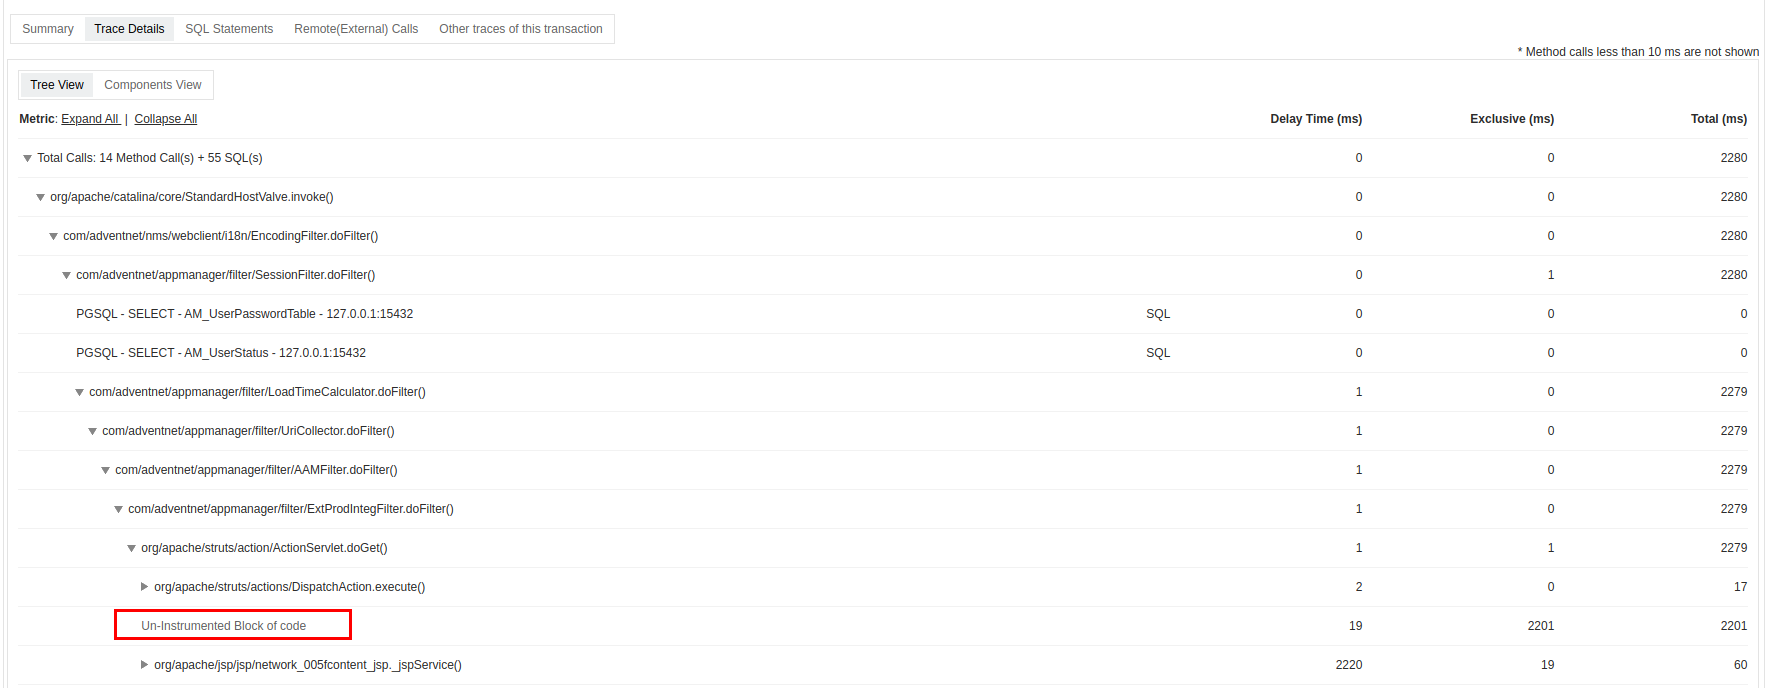
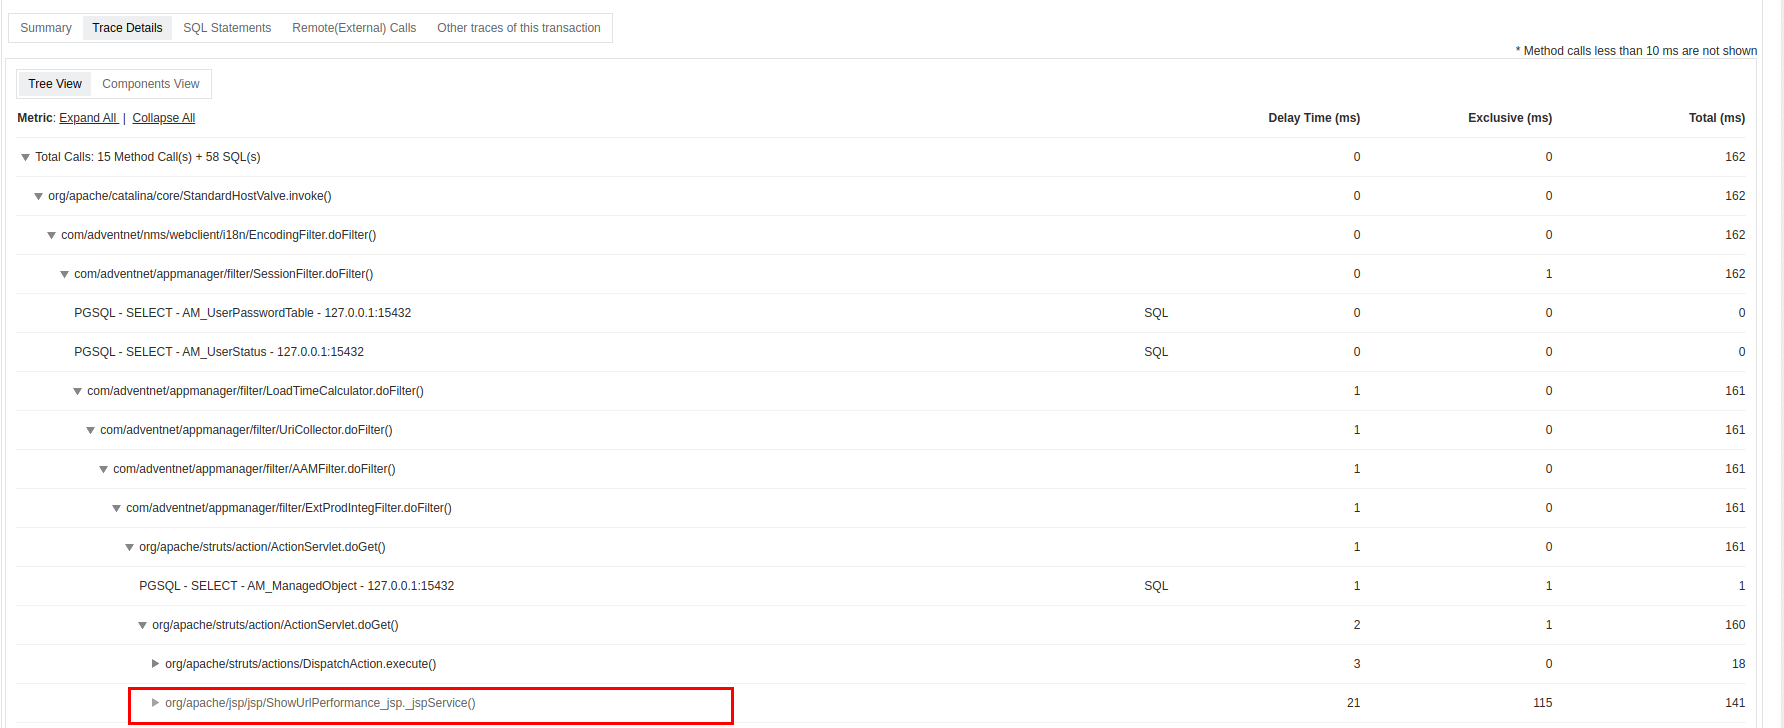
By default, APM Insight agent captures all your application transactions, known classes and methods, and web frameworks. In certain cases, methods or frameworks, apart from the default ones, are not captured, so as to minimize the agent overload on the application.
To view all your methods and frameworks and to obtain granularity in your debugging process, you can instrument your custom methods or frameworks - this process, is called as Custom instrumentation.
For the above mentioned circumstances, you can deploy custom instrumentation.
Note: This method is supported only for Java and .NET Core agents. You can custom instrument your Ruby and Node.js applications via agent APIs.
Also, these configurations are specific to APM Insight applications and this will be applied across all instances. For instance specific custom instrumentation, you can use Java agent API or .NET agent API, depending upon your application platform.
Follow the steps given below to perform custom instrumentation:
{"Fully qualified ClassName":{"MethodName1" : "ComponentName", "MethodName2" : "ComponentName" }}{
"com.sample.web.tasks.ModelUpdateHandler":
{
"doHandle": "MODEL_UPDATE",
"update": "MODEL_UPDATE"
}
}Fully qualified ClassName : methodNames separated by comma(,) : Component Namecom.sample.web.tasks.ModelUpdateHandler : doHandle,update : MODEL_UPDATE
com.sample.web.services.SystemCheck : doCheck, isHealthy :
com.sample.web.store.DataModifier : : MODIFIER
com.sample.web.utils.FileUtils : :Note: For both JSON and Text type, use the below format for specifying the fully qualified classname:
Java classes format - com/appmanager/apminsight/agent/JavaAgent
.NET Core classes format - Com.Appmanager.Apminsight.Agent.DotAgent


Thank you for your feedback!