Adding ManageEngine Applications
EventLog Analyzer can be integrated with various other ManageEngine Applications such as:
- ADAudit Plus
- ADManager Plus
- Endpoint Central
- ADSelf Service Plus
- ITOM Solution Products
- Password Manager Pro
- ServiceDesk Plus
These integrations help users receive debug, server, and security information, that can be analyzed and displayed as actionable reports on EventLog Analyzer. Apart from this, integration with applications like Password Manager Pro enables users to correlate activities that are tracked within Password Manager Pro like the sharing of passwords, and events within Windows environment, like starting a remote sessions. This ensures early threat detection, mitigation and response.
Through the integration with ManageEngine's Endpoint Central, IT teams can generate alerts from Endpoint Central logs such as information on software and patches installed, policy modifications, and remote actions performed by Endpoint Central administrators. The integration also facilitates administrators to conduct forensics, correlate logs from both products, detect patterns, and run a response workflow to mitigate identified threats.
Steps to configure ManageEngine applications
Import Configuration
Configuring ManageEngine EventLog Analyzer to import ManageEngine Products' Logs.
- Navigate to Settings tab and click Applications under Log Source Configuration menu.
- Select ME Applications tab under Application Source Management component.
- Click Add ME Application button.
- Select the required ManageEngine Application from the Application drop down box.
- Select or Add device from the Device modal.
- Check Import File Logs check box.
- Configure the following in the Import File Logs component.
- Protocol: select the desired protocol to import logs from the protocol dropdown box.
- Provide Port number to the protocol if required.
- Username: Enter the username of the selected device.
- Password: Enter the password associated with that protocol (Windows user password in case of SMB-Windows protocol).
- Log Folder: Click Browse button to browse and select the log folder of the selected Application.
- Monitor Schedule: Configure the required interval to import logs.
- Click Add button to configure the selected ManageEngine AD Application with the selected device
Note: Only access logs and debug logs are imported in import configuration
The supported products are:
- ADAudit Plus
- ADSelfServicePlus
- ADManager Plus
- OpManager
- OpManager Plus
- OpManager MSP
- Firewall Analyzer
- Netflow Analyzer
- Network Configuration Manager
- ServiceDesk Plus
Syslog Configuration
Configuring ManageEngine ADAudit Plus
- Log in to ADAudit Plus and navigate to the Admin tab.
- Under Configuration, click SIEM Integration.
- Check Enable Log forwarding of ADAudit Plus application logs check box.
- From the displayed component check EventLog Analyzer tab checkbox.
- Configure the following:
- Server where Eventlog Analyzer is running: Enter the machine name or IP where EventLog Analyzer has been installed.
- Eventlog Analyzer port number: Enter the port number where EventLog Analyzer is running.
- Username: Enter the user name of the EventLog Analyzer user with the admin privilege.
- Password: Enter the password of the EventLog Analyzer user with the admin privilege.
- Protocol Settings: Select the protocol used by EventLog Analyzer from the Protocol Settings radio buttons.
- Syslog Standard: Select the desired syslog standard to forward logs from the Syslog Standard radio buttons.
- Click Choose categories to forward button and select the logs to be forwarded to EventLog Analyzer from the Choose Application Log categories to forward modal.
Note: Only the ADAudit Plus user with admin tab and configuration setting privilege can enable integration with EventLog Analyzer.
Logs types description:
- Access Logs: ADAudit Plus web server access logs.
- Debug Logs: ADAudit Plus internal server operation logs : Server started, failed logons, successful logons and more.
Configuring ManageEngine ADManager Plus
- Log in to ADManager Plus and navigate to the Admin tab.
- Under System Settings, click Integrations.
- Under Log Forwarding, click EventLog Analyzer.
- Check the Enable Integration box to enable the integration.
- Configure the following:
- Server where Eventlog Analyzer is running: Enter the name of the machine where EventLog Analyzer has been installed.
- Eventlog Analyzer port number: Enter the port number where EventLog Analyzer service is running.
- Protocol Settings: Enter the protocol used by EventLog Analyzer service.
- Authentication: Enable this check box if EventLog Analyzer is hosted in a remote machine.
- Configure the following:
- Username: Enter the Super admin user name of EventLog Analyzer.
- Password: Enter the Super admin password.
- Log Type: Select the log category of the logs to be forwarded to EventLog Analyzer. You can find more details at the log types description section given below.
- Configure Syslog Port Manually: Check this option if the ports and protocol to forward the logs are to be changed manually. By default this information will be populated automatically based on the ports configured in EventLog Analyzer.
- Syslog Protocol: Protocol to which logs will be forwarded.
- Syslog Port: Destination EventLog Analyzer Port to which logs will be forwarded.
- Click 'Test Connection and Save' to establish connection and save the settings.
Note: For security reasons, only the ADManager Plus built-in admin can enable integration with EventLog Analyzer.
Logs types description:
- Access Logs: ADManager plus web server access logs.
- Debug Logs: ADManager plus internal server operation logs : Server started, failed logons,successful logons and more.
- User Activity Logs: Actions performed by users in ADManager plus will be forwarded in this category.
Configuring ManageEngine ADSelfServicePlus
- Log in to ADSelfService Plus and navigate to the Admin tab.
- Under Product Settings, click Integration Settings.
- Choose Log360 - EventLog Analyzer.
- Configure the following:
- Server where Eventlog Analyzer is running: Enter the name of the machine where EventLog Analyzer has been installed.
- Eventlog Analyzer port number: Enter the port number where EventLog Analyzer service is running.
- Protocol Settings: Enter the protocol used by EventLog Analyzer service.
- Username: Enter the Super admin user name of EventLog Analyzer.
- Password: Enter the Super admin password.
- Log Type: Select the log category of the logs to be forwarded to EventLog Analyzer. You can find more details at the log types description section given below.
Note: For security reasons, only the ADSelfService Plus built-in admin can enable integration with EventLog Analyzer.
Logs types description:
- Access Logs: ADSelfService plus web server access logs.
- Debug Logs: ADSelfService plus internal server operation logs : Server started, failed logons, successful logons and more.
Configuring ManageEngine ITOM solution products
Access logs and Debug logs Configuration for ITOM solution products
- Go to Settings -> General Settings -> Third Party Integrations.
- Now, click on the "Configure" button found at the bottom-right corner of the Log 360 - EventLog Analyzer section.
- Now, fill in the following details:
- Server IP/DNS Name: Enter the IP address or the DNS name of the EventLog Analyzer-installed server, along with the port and the protocol.
- Username: Enter the user name of the EventLog Analyzer user with the admin privilege.
- Password: Enter the password of the EventLog Analyzer user with the admin privilege.
- Select Log File: Select the logs to be forwarded to EventLog Analyzer, from the Select Log File drop down box.
- Access logs: Logs that contain requests made to a web server, capturing information like the IP address, timestamp, requested resources, and outcomes of each request
- Debug logs: Logs that are generated by OpManager during its operation, containing information used for diagnosing and troubleshooting issues.
Note: The following products from ManageEngine ITOM Solution support syslog integration with EventLog Analyzer:
- OpManager
- OpManager Plus
- OpManager MSP
- Firewall Analyzer
- Netflow Analyzer
- Network Configuration Manager
Alarms Configuration for ITOM Solution products
The following are the steps to configure ManageEngine ITOM Solution applications.
- Login to the ITOM Solution application.
- Navigate to Settings -> Notifications.
- Click Add.
Profile Type
Select Syslog Profile and enter the following details.
- Destination Host - EventLog Analyzer server name or IP address.
- Destination Port - Any port that the EventLog Analyzer instance is listening to.
- Severity and Facility must be the default values i.e. $severity and kernel.
For EventLog Analyzer to parse logs from OpManager, the message variables in the syslog profile of OpManager should be entered in the following format:
Mandatory message variables
- ALARM_MESSAGE:$message
- ALARM_ID:$alarmid
- ALARM_CODE:$alarmid
Other important message variables
- ALARM_SOURCE:$displayName
- ALARM_CATEGORY:$category
- ALARM_SEVERITY:$stringseverity
- ALARM_TRIGGER_TIME:$strModTime
- ALARM_EVENT_TYPE:$eventType
- Entity: $entity
- Last Polled Value: $lastPolledValue
- Click Next.
Criteria
- Click on the Criteria check-box.
- Enable the notification for all severities and click Next.
Device Selection
- Select the By Device option and select all the devices listed under Remaining Devices and click Next.
Schedule
- You don't have to configure anything in this section. Click Next.
Preview
- Enter a profile name and click Save.
Note: If the same machine is running two or more ManageEngine products, ensure the following:
- The ports used by the products are unique.
- The EventLog Analyzer port receiving logs from OpManager and Password Manager Pro is not used by other ManageEngine products.
Note: The following products from ManageEngine ITOM Solution Support Alarms Configuration:
- OpManager
- OpManager Plus
- OpManager MSP
Configuring ManageEngine Password Manager Pro
Here are the steps to configure Password Manager Pro.
- Login to Password Manager Pro.
- Navigate to Audit -> Resource Audit -> Audit Actions -> Configure Resource Audit. Enable the Generate Syslog option for all operations and click Save.
- Navigate to Audit -> User Audit -> Audit Actions -> Configure User Audit. Enable the Generate Syslog option for all operations and click Save.
- Navigate to Admin -> Integration -> SNMP Traps / Syslog Settings and click Syslog Collector.
- Enter the EventLog Server name and a port that the EventLog Analyzer instance is listening to.
- Select the protocol (UDP/TCP) and a facility name. Click Save.
HTTPs Action Log Collection Configuration
Configuring ManageEngine Endpoint Central
- Log in to Endpoint Central and navigate to the Admin tab.
- Under Integrations tab, click Log360 - EventLog Analyzer.
- Configure the following:
- Server name where Eventlog Analyzer is running: Enter the machine name or IP where EventLog Analyzer has been installed.
- Server Port: Enter the port number where EventLog Analyzer is running.
- API Token: Find the steps to generate AuthToken here.
- Component: EventLog Analyzer
- Required scope : "http_listen"
- Protocol: By default, HTTPS has been set to ensure secure communication. Since protocol is restricted to HTTPS, EventLog Analyzer should be configured to the same. Find the steps to enforce HTTPS here.
- Data Transfer Interval: Select the interval in which the collective action logs have to be synced.
Note:
- Only Endpoint Central users with admin tab and integrations setting privilege can enable the integration with EventLog Analyzer.
- If EventLog Analyzer using self signed SSL certificate, follow these steps to extract and import the SSL certificate used in EventLog Analyzer into Endpoint Central.
Data Enrichment Configuration for ManageEngine Endpoint Central and Vulnerability Manager Plus
By combining security data points from ManageEngine Endpoint Central or Vulnerability Manager Plus and advanced threat detection in Log360, you can quickly and effectively investigate and respond to security incidents.
Configuring ManageEngine Endpoint Central and Vulnerability Manager Plus On-Premises Version
To configure,
- Navigate to the Settings tab and click Applications under the Log Source Configuration menu.
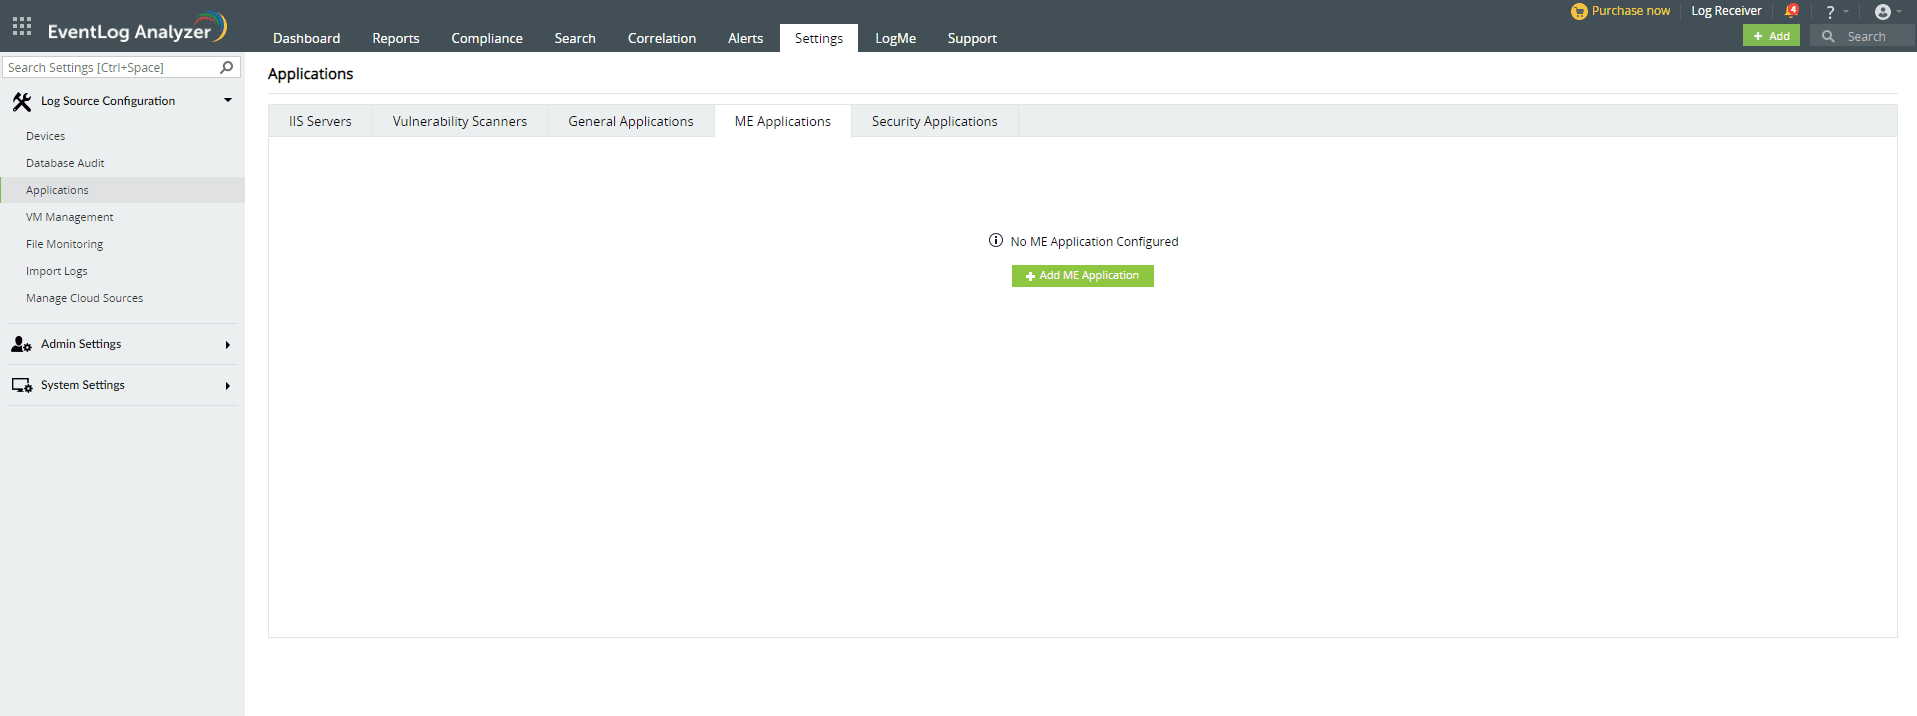
- Select ME Applications tab under Applications component.

- Click the Add ME Application button.
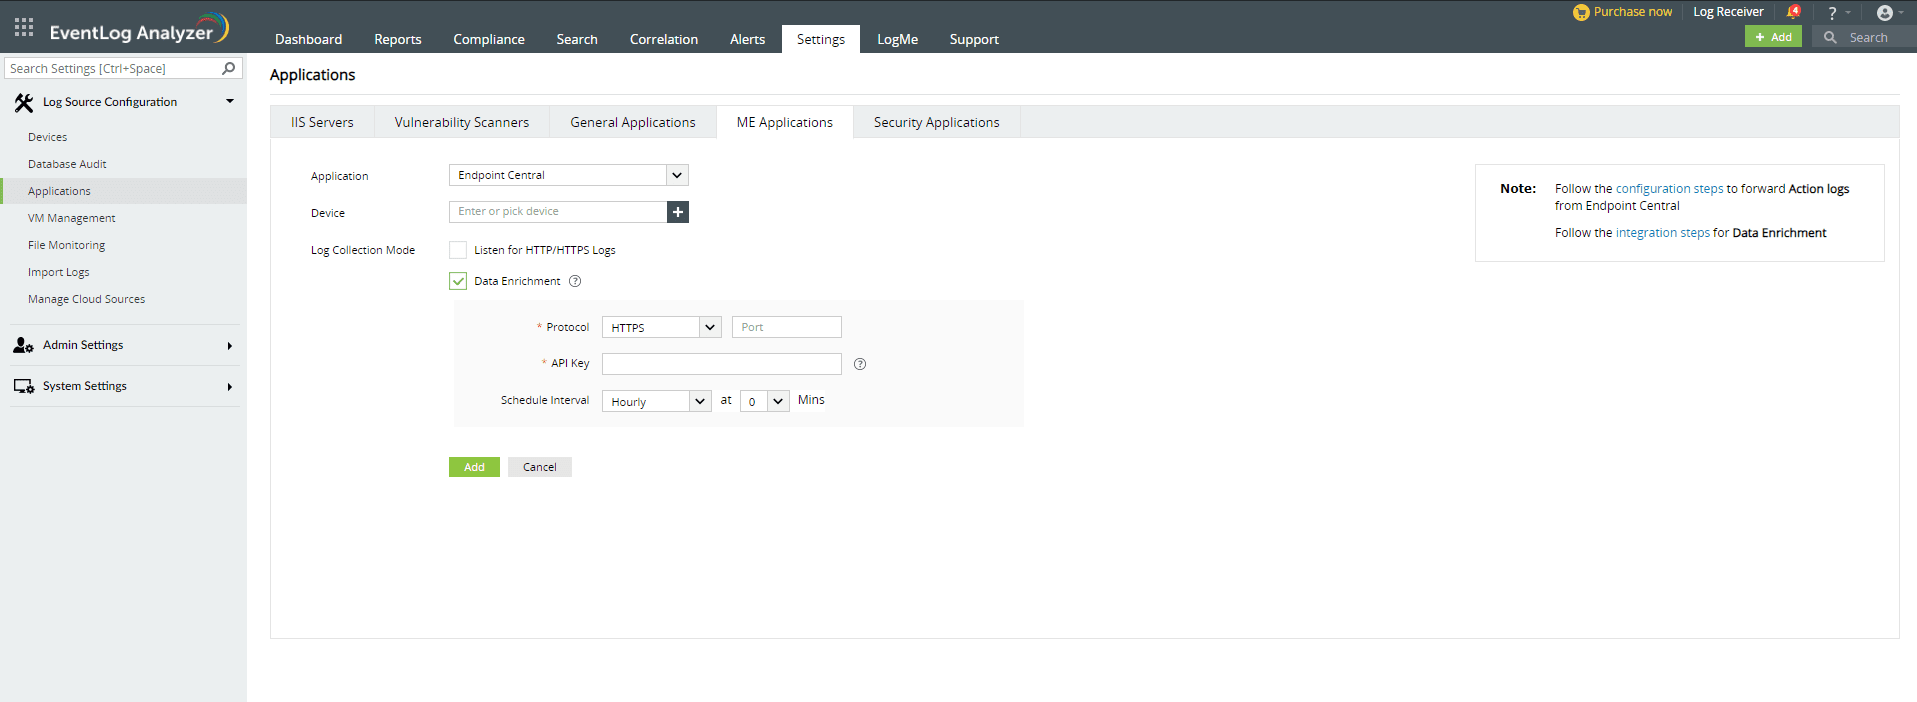
- Select Endpoint Central from the Application drop-down box.
- Enter or pick a device from the Device list. (Note: The device on which the Endpoint Central server runs.)
- Check the Data Enrichment box.
- Configure the following in the Data Enrichment component.
- Protocol: Select the desired protocol to fetch data from the protocol dropdown box.
- Provide a Port number to the protocol (Default port number for HTTP: 8020 & HTTPS: 8383)
- Provide the API key generated from the Endpoint Central API Explorer. (Visit the API Explorer in Endpoint Central -> Admin tab & follow the steps given for authentication in this help document)
- Note: Kindly make sure the user have following permissions [VulnerabilityMgmt_Read, PatchMgmt_Read, PatchMgmt_Write]
- Click Add to configure the chosen Endpoint Central application with the selected device. Note: Ensure the credentials have sufficient permissions to access APIs.
Note:
- Kindly enable predefined alert profiles and correlation rules to use Data Enrichment.
- To ensure seamless integration between EventLog Analyzer and Endpoint Central, follow these steps to import the SSL certificate of Endpoint Central (/webapps/DesktopCentral/client-data/server-certificates/DMRootCA.crt) into EventLog Analyzer.
- You can follow the same steps mentioned above to integrate with Vulnerability Manager Plus as well.
Configuring ManageEngine Endpoint Central Cloud Version
To configure,
- Navigate to the Settings tab and click Applications under the Log Source Configuration menu.
- Select ME Applications tab under Applications component.
- Click the Add ME Application button.
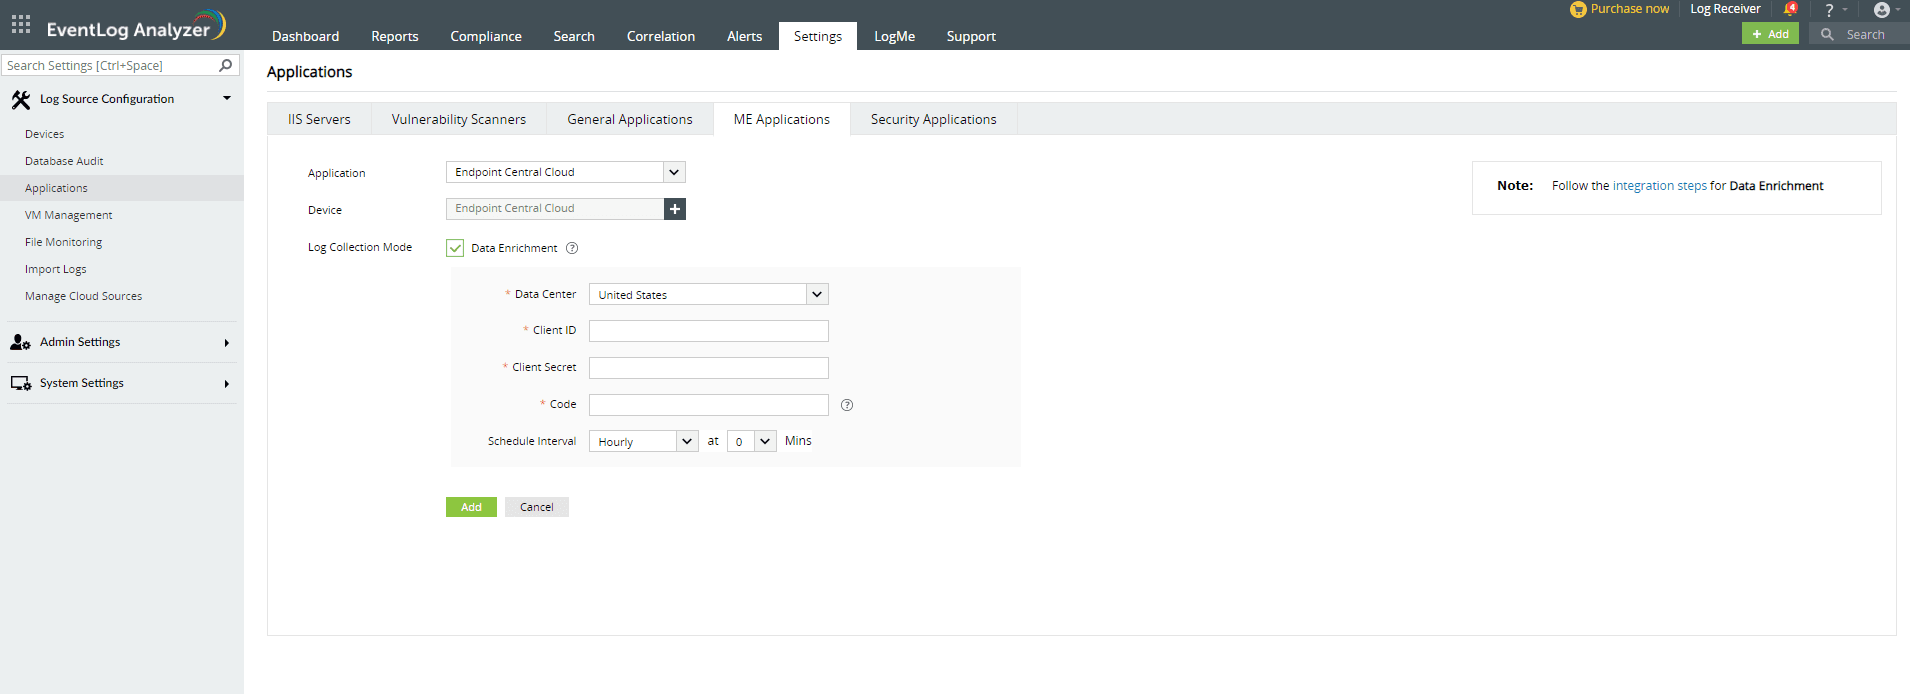
- Select Endpoint Central Cloud from the Application drop-down box.
- Check the Data Enrichment box (will be checked by default).
- Configure the following in the Data Enrichment component.
- Data Center: Choose the data center where Endpoint Central Cloud is hosted.
- Visit the respective Developer Console and follow the steps for authentication (Self Client Method) provided in this help document to obtain the following credentials:
- Client ID: Paste the copied client ID under the Client Secret tab.
- Client Secret: Paste the copied client secret under the Client Secret tab.
- Code: Provide generated code.
- Scopes to be considered while generating code.
DesktopCentralCloud.PatchMgmt.UPDATE,DesktopCentralCloud.PatchMgmt.read,DesktopCentralCloud.Common.read,DesktopCentralCloud.VulnerabilityMgmt.READ
- Schedule the required interval to sync data.
- Click Add to configure the chosen Endpoint Central Cloud application. Note: Ensure the credentials have sufficient permissions to access APIs.
Note: Kindly enable predefined alert profiles and correlation rules to use Data Enrichment.
This integration enhances your security posture by leveraging data from Endpoint Central. Here's what's new:
- Vulnerability and misconfiguration comparators: Identify devices with vulnerabilities or misconfigurations using custom correlation rules and alerts.
- Streamlined patch management: Approve and install patches directly through incident workflows.
Using vulnerability and misconfiguration comparators:
These comparators are available only after successful integration and can be used with device fields.
- Is Vulnerable: Check if a device is tagged as vulnerable in Endpoint Central.
- Vulnerable To: Identify devices vulnerable to specific attacks (e.g., CVE-2023-38831).
- Misconfigured For: Detect devices with misconfigurations identified by Endpoint Central (e.g., Windows Credential Guard disabled).
Creating custom correlation rules:
Click here to learn how to create custom correlation rules using vulnerability and misconfiguration comparators.
Creating custom alert profiles:
Click here to learn how to create custom alert profiles using vulnerability and misconfiguration comparators.
Managing patches with workflows:
This integration introduces two new workflow actions:
- Approve Patches
- Install Patches
Click here to learn how to create incident workflows utilizing these actions.
Configuring ManageEngine ServiceDesk Plus
Prerequisite: ServiceDesk Plus built-in admin privilege is necessary to enable integration with EventLog Analyzer.
- Login to ServiceDesk Plus and navigate to the Admin tab.
- In the Admin Settings, select Integrations under Apps & Add-ons.
- Select ManageEngine SIEM under the ManageEngine tab.
- Check the Enable EventLog Analyzer box to enable the integration and configure the following:
- Hosted URL: Enter the full URL where the EventLog Analyzer service is hosted. The URL should include the protocol (http or https), the host name or IP address, and the port number.
- Username: Enter the Super Admin user name of EventLog Analyzer.
- Password: Enter the Super Admin password.
- Log Type: Select the category of logs to be forwarded to EventLog Analyzer. You can find more details in the log type description section given below.
Logs types description:
- Access Logs: ServiceDesk Plus web server access logs.
- Debug Logs: ServiceDesk Plus internal server operation logs—Server started, failed logons, successful logons and more.
 Click here to expand