- Related Products
- Log360
- AD360
- ADManager Plus
- ADAudit Plus
- ADSelfService Plus
- Exchange Reporter Plus
 Click here to expand
EventLog Analyzer drills down to the raw logs when retrieving results for your search query. The results can be saved, or used to create report and alert profiles.


After clicking on Edit Widget, you can choose Graph Type, Chart Type, and Graph Color, and the changes will be reflected accordingly.

To drill down to a specific time range, simply click on a point on the graph. When you do this, the calendar will automatically adjust to display the corresponding time period. Both the table and the graph will also dynamically update to reflect the selected time range.
When you choose a specific section of the graph by dragging the cursor, the table will automatically adjust to show data within that time range, and the graph will be highlighted according to its chart type. You'll also notice an option to clear the selection becomes available. It's important to note that in this case, the chosen time range will not be updated in the calendar.

As you drag your cursor over a specific area of the graph, that portion will be highlighted, and the logs within that time range will be displayed.
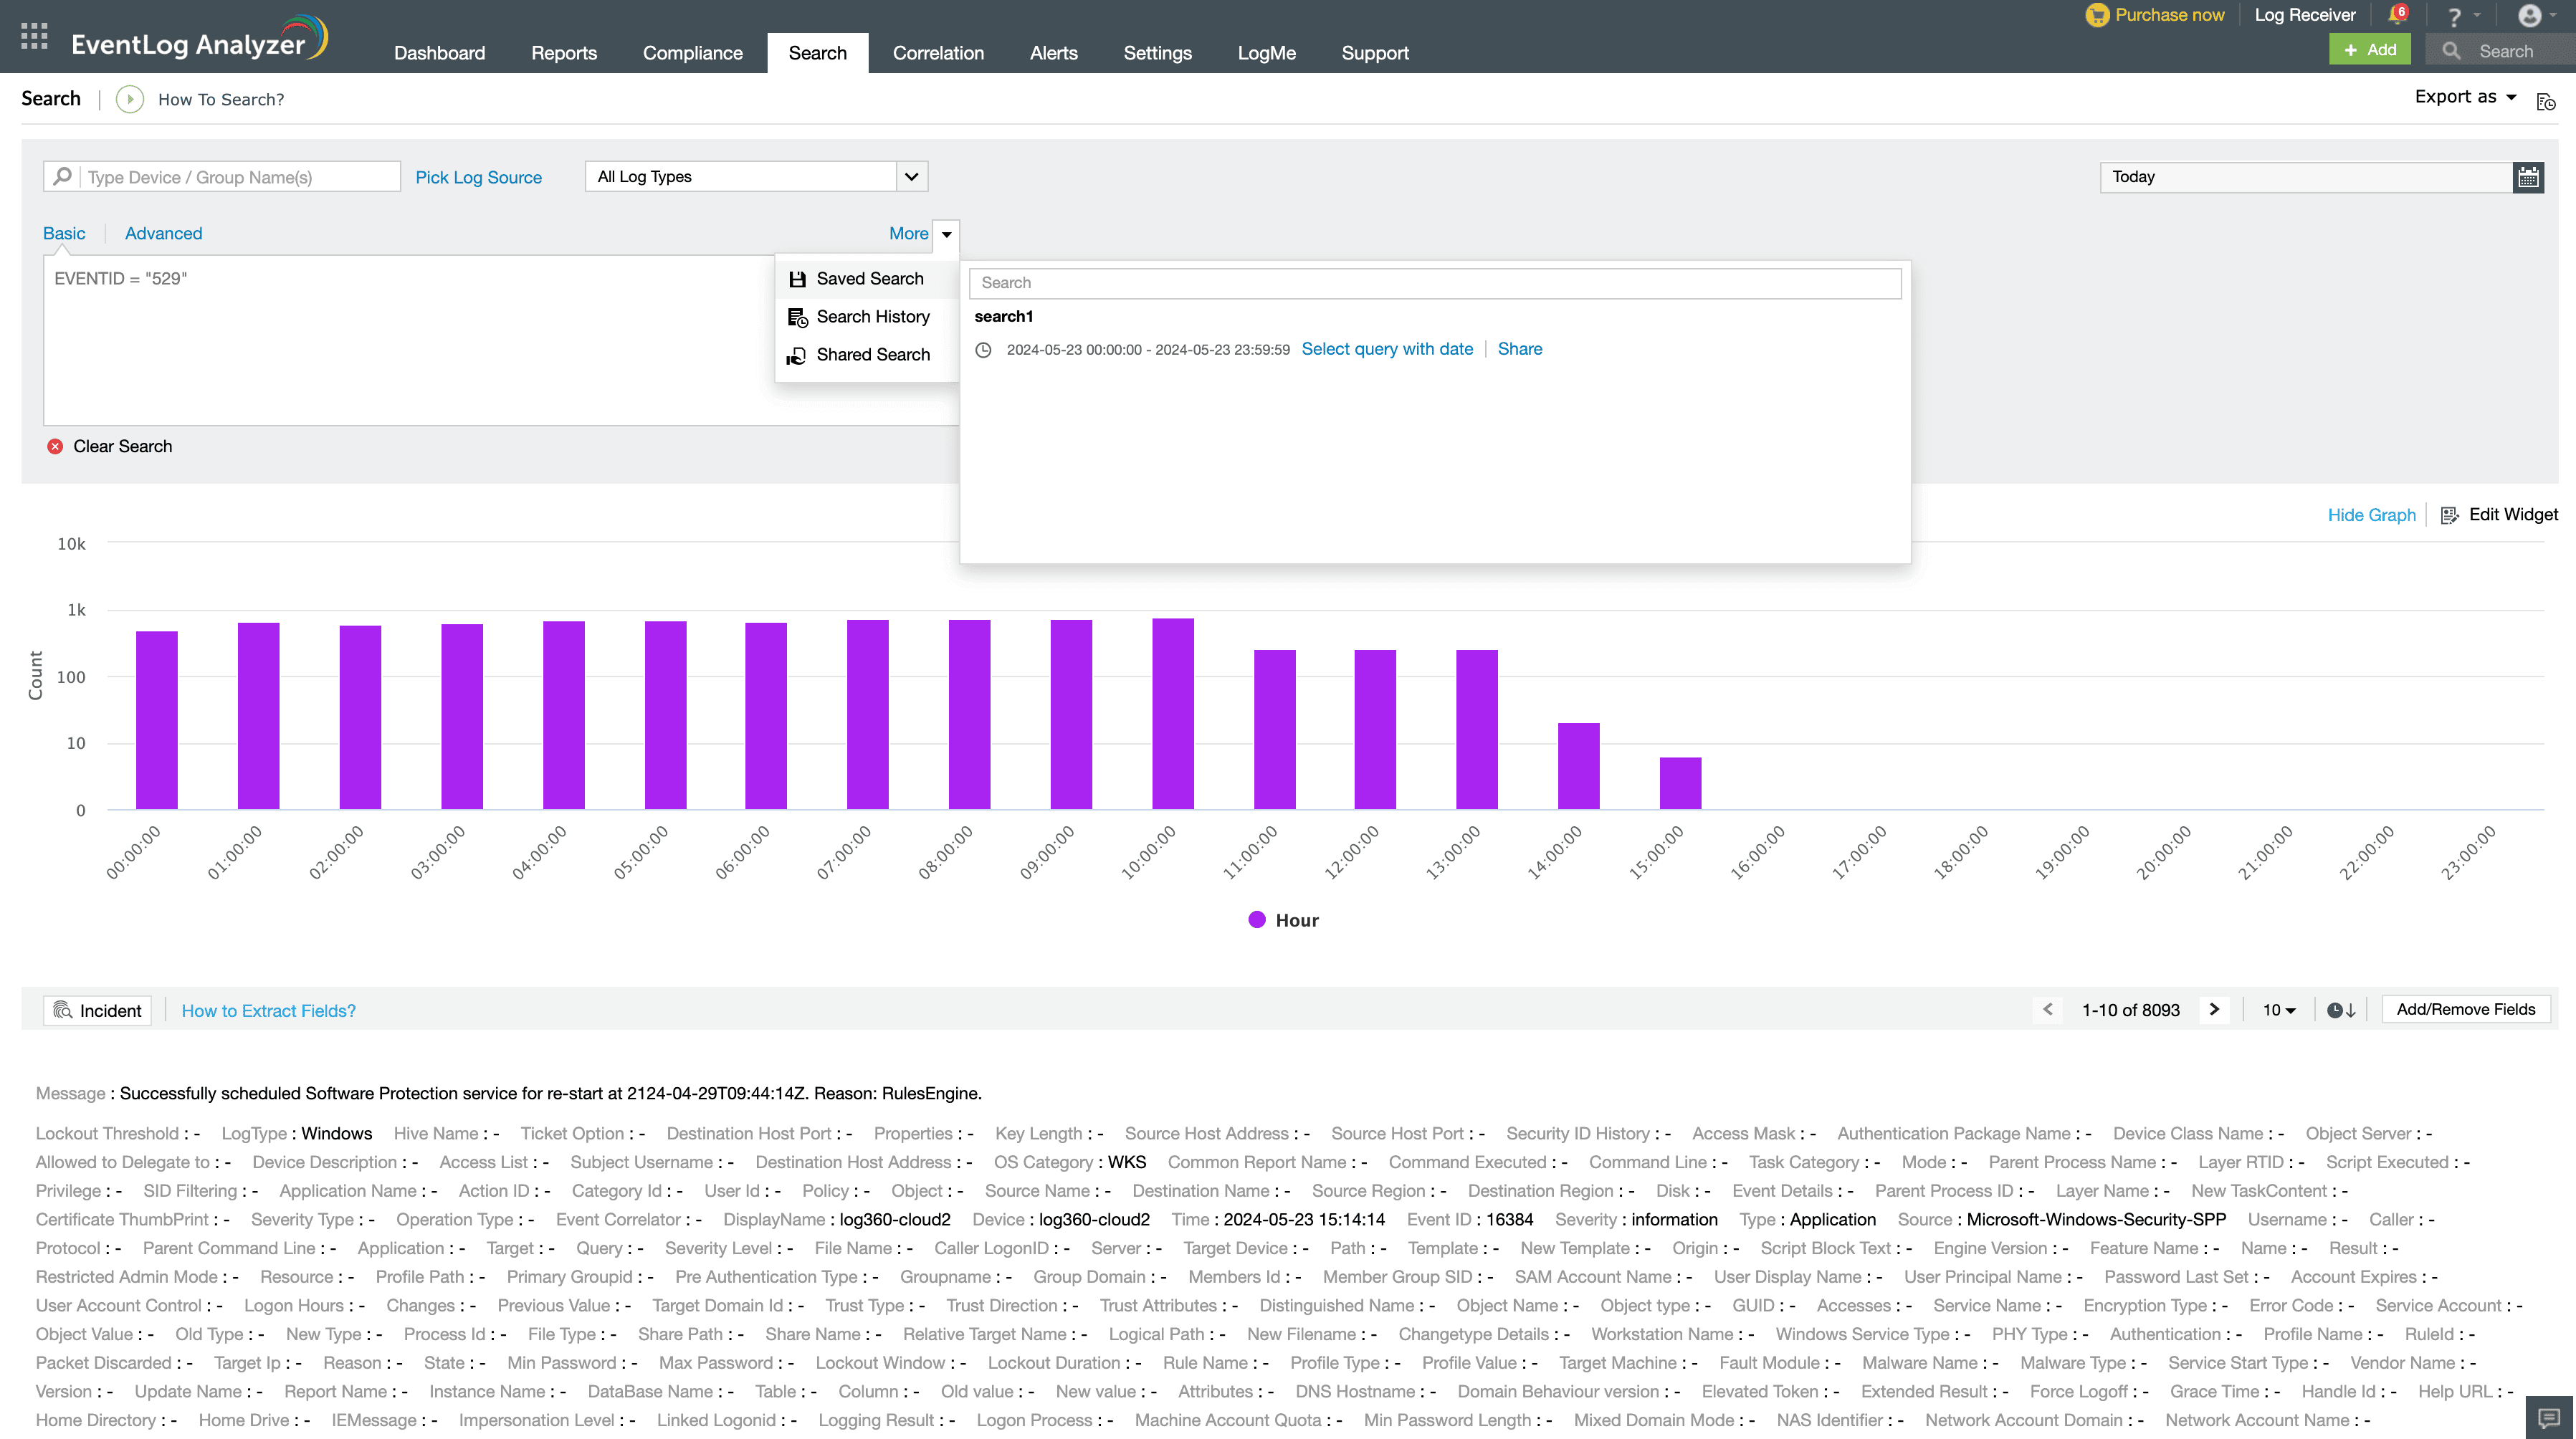
After your search parameters have been successfully saved, if you ever need to reuse the same parameters for a future search, simply follow these steps:
If you require an exact time range, you can utilize the Select query with date option.

Search requests will be saved in your browser's local storage and displayed as a Search History list. This list can contain up to 50 entries. When the limit is reached, older entries will be deleted to accommodate new ones. If you perform a search with the same criteria as an existing entry in the search history, the new query will replace the previous one.

You can share saved searches with other technicians within your organization. When you share a saved search, all the associated data will be accessible to the shared user.

To share a search with other technicians, select the Saved Search option from the More dropdown menu and then click Share.

After clicking the Share option, you can select technicians to notify via email by toggling the Notify recipients via mail button.

Alternatively, you can also click on Choose, which will redirect you to the following page where all the technician names along with their role can be seen.

After sharing a search, you can modify the list of technicians or withdraw the shared search from selected technicians. To make changes, select the Edit Share button. To remove all technicians, use the Revoke button.
Copyright © 2020, ZOHO Corp. All Rights Reserved.