Malwarebytes Reports

EventLog Analyzer collects log data from Malwarebytes and presents it in the form of graphical reports. For the solution to start collecting this log data, the device has to be added as a threat source.
Adding Malwarebytes as a threat source:
To add a Malwarebytes as a threat source, the syslog service has to be configured.
- Log into the Management console of the Malwarebytes device.
- Navigate to the Admin pane and open the Syslog Settings tab.
- Click Change and tick the Enable Syslog check box.
- To export traffic monitoring logs to the EventLog Analyzer server, enter the following details in the space provided:
- Address <EventLog Analyzer server IP address>
- Port <513/514>
- Protocol
- Payload format <CEF>
- Click on OK to save.

Once the threat source is added, EventLog Analyzer will start parsing the fields in the logs. This log data can now be viewed in the form of reports.
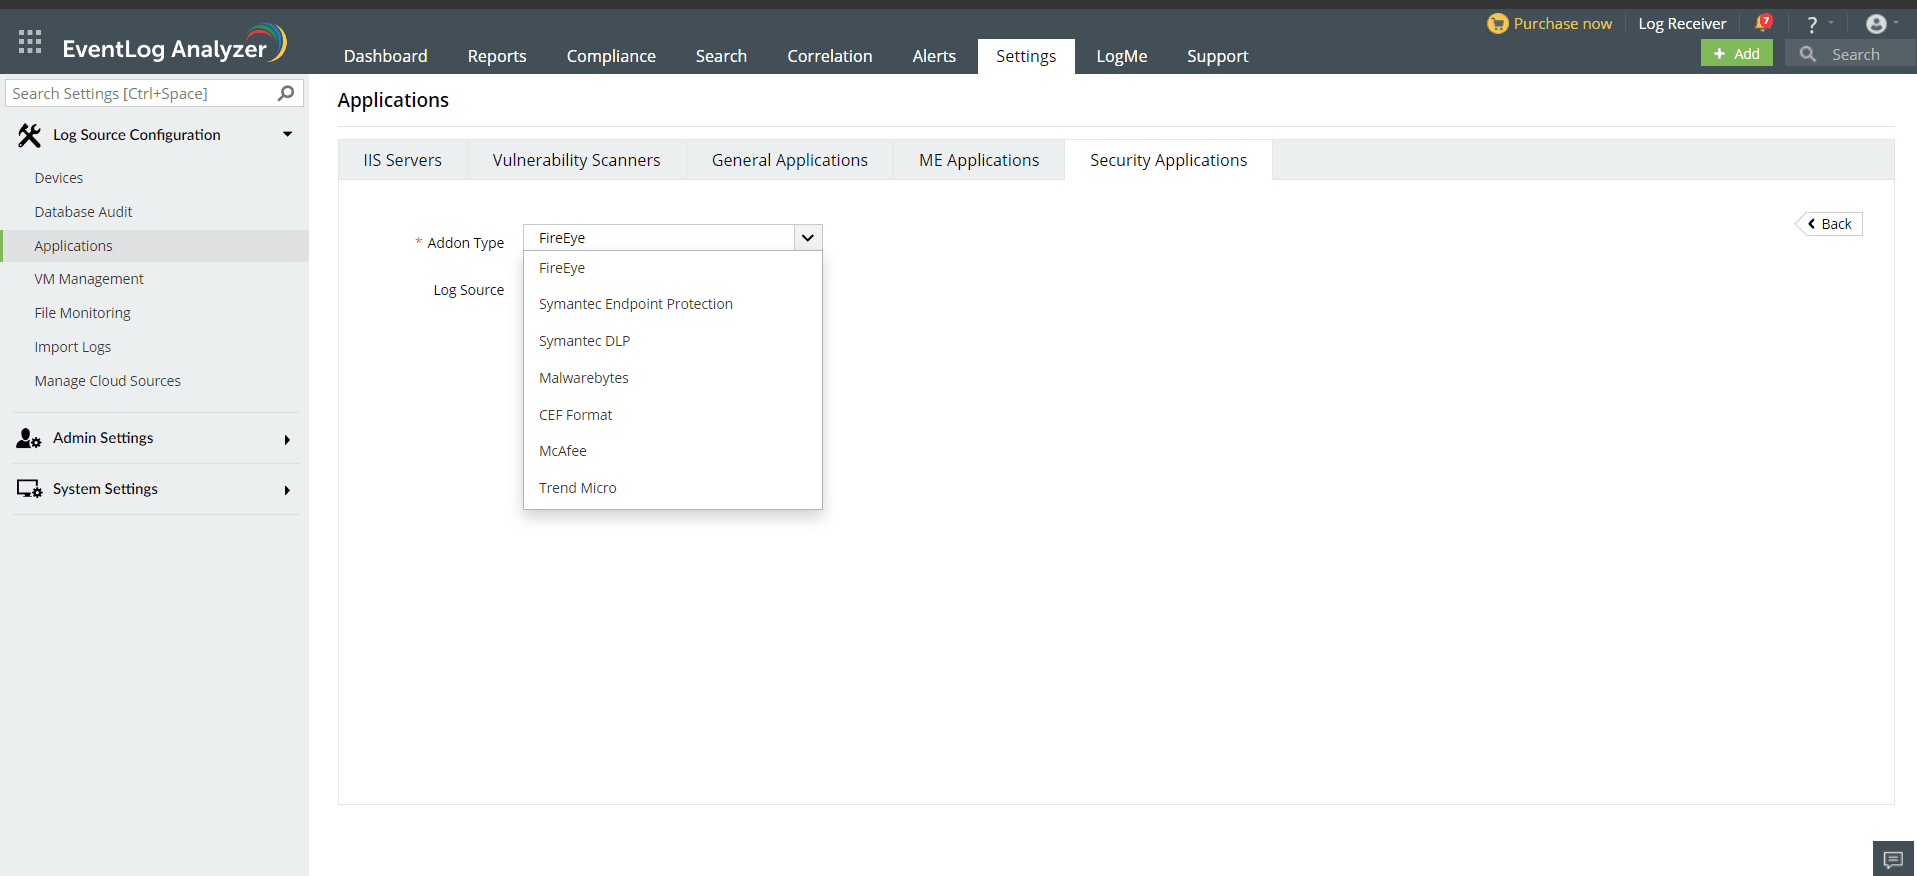
- In the EventLog Analyzer console, navigate to Settings > Log Source Configurations > Applications > Security Applications > Add Security Applications
- Select Add-on type as Malwarebytes
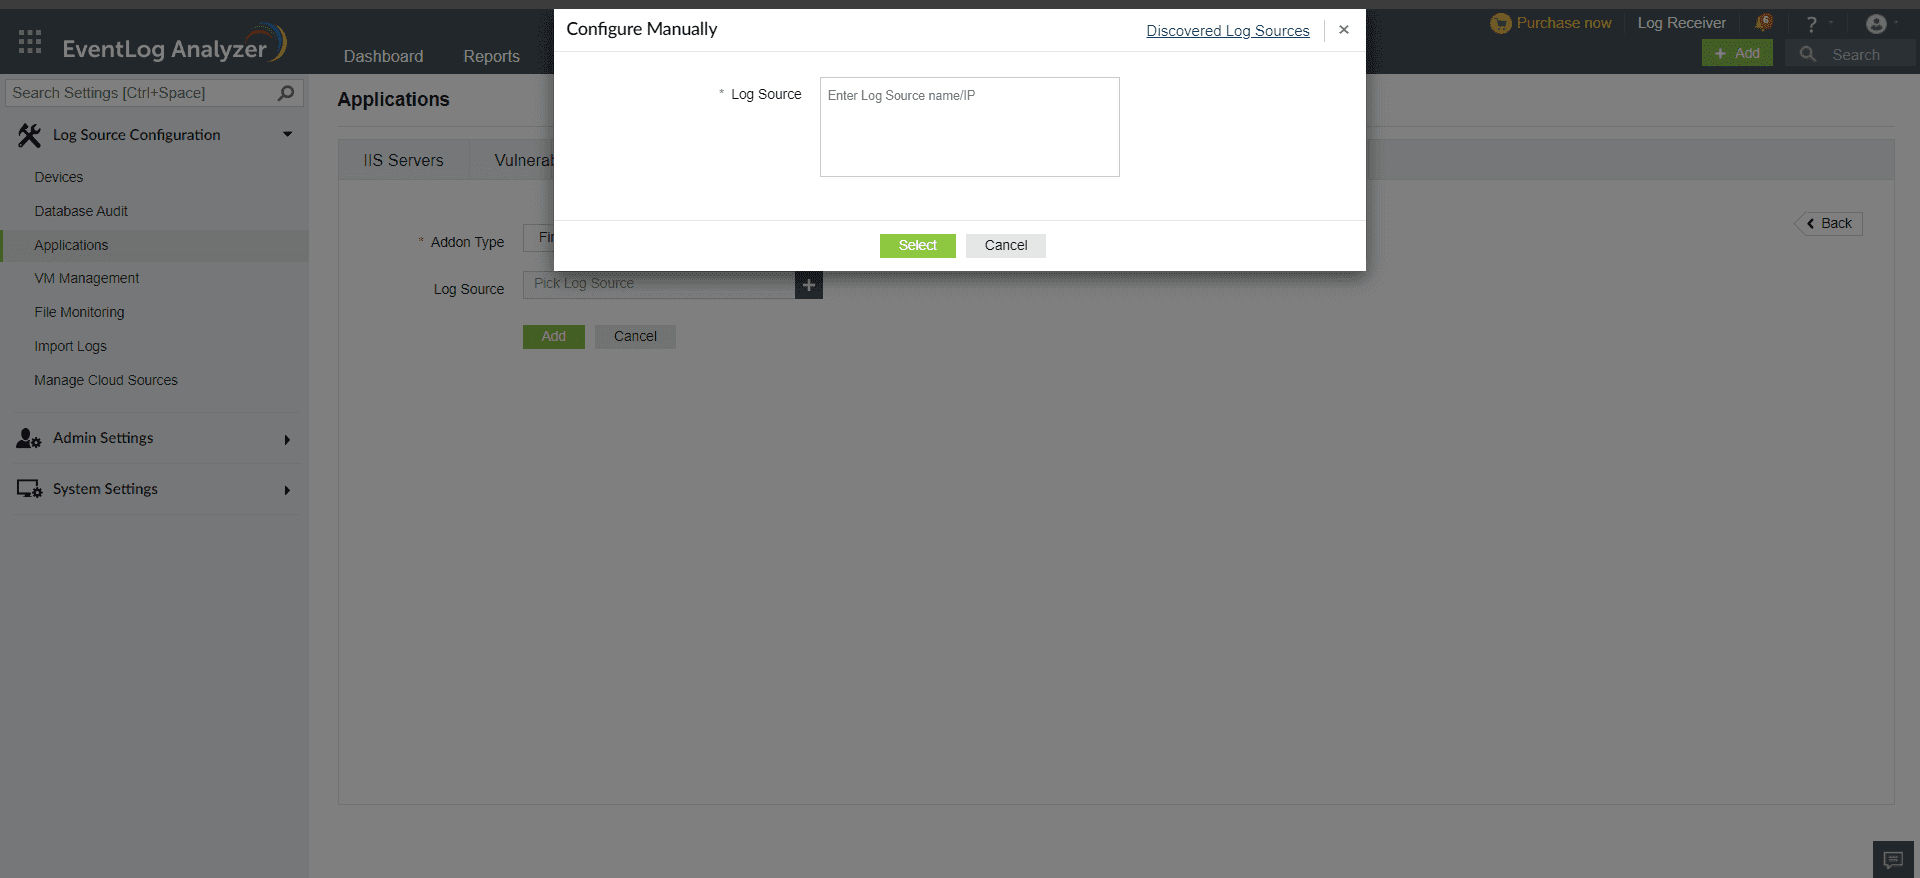
- Expand the list by clicking the "+" icon to add a new device.
- Choose from the drop-down menu to add Configured devices, Workgroup devices, domain devices, etc.
- To add new devices manually, click on Configure Manually and enter Log Source >Select and click on Add.

The available reports are:
- Detected Threats
- Quarantined Threats
- Allowed Threats
- Top Threats based on source
- Top Threats based on user
- Top Threats Types
- Top Websites blocked based on source
- Detected Exploits
- Blocked Exploits
- Allowed Exploits
- Top Exploits based on source
- Top Exploits based on user
- Top Exploits types
- Malicious Websites Blocked
- Top Websites Blocked
 Click here to expand


