Log Receiver
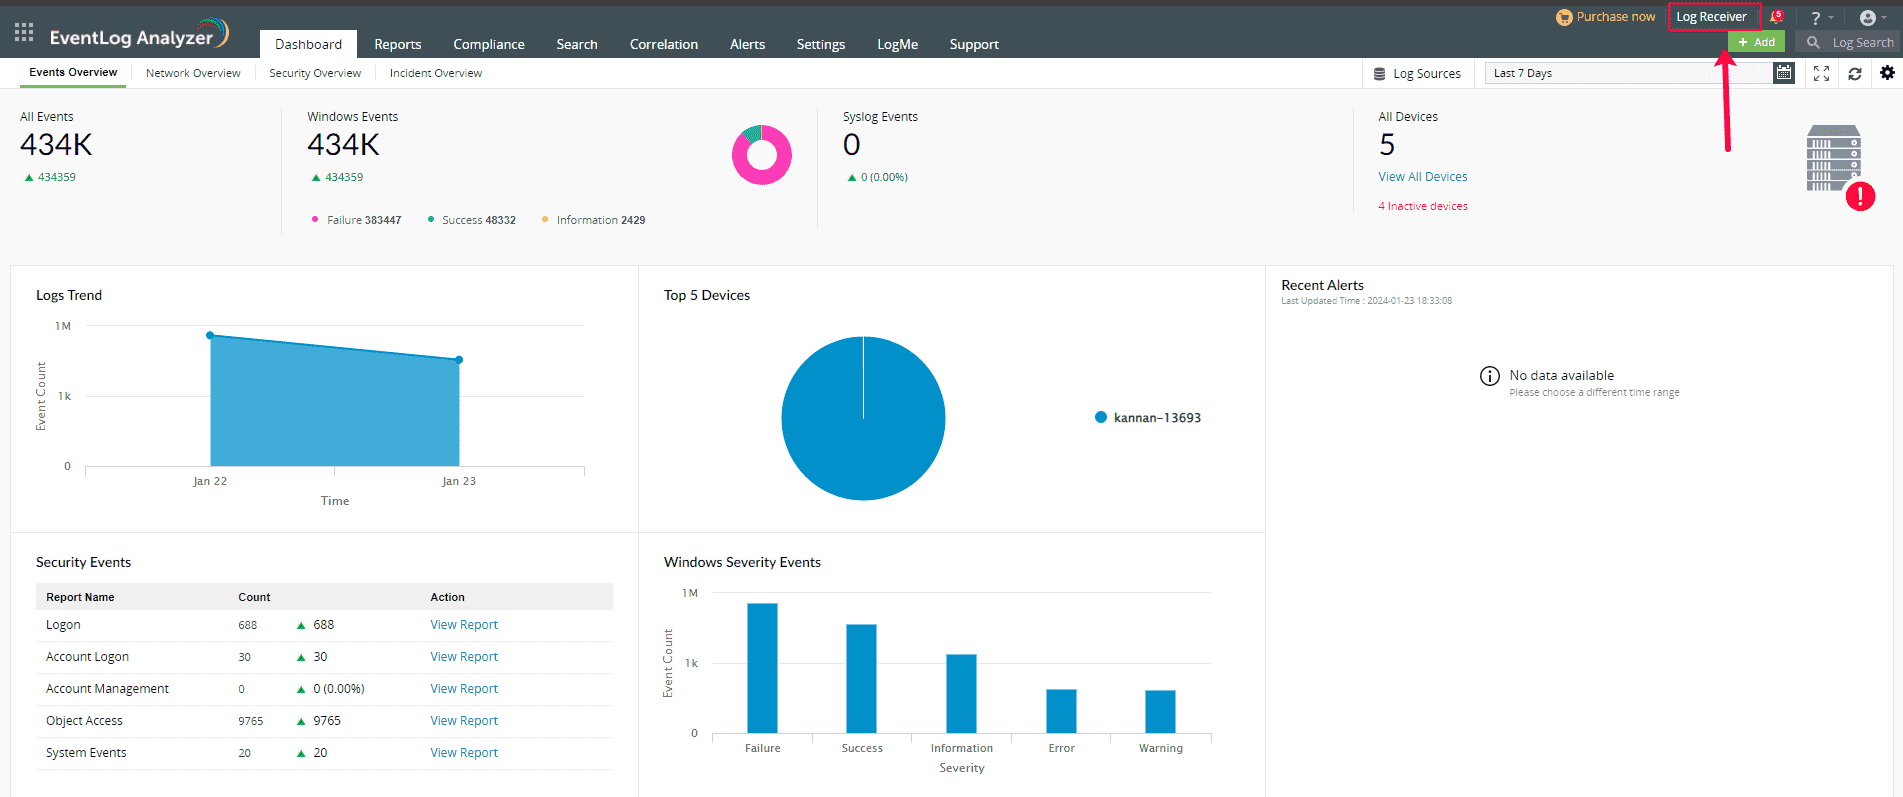
EventLog Analyzer includes a functionality called Log Receiver which is a packet capturing tool that displays real-time packets being received at a specified port.
It helps the security analysts by providing supplementary information like live logs being received, and the details related to the server such as server-name,TCP ports and IP address where EventLog Analyzer is set up. (Refer Fig 1)
 Fig 1 EventLog Analyzer- Log Receiver
The Log Receiver tab comes with two default sub-tabs:
- Syslog Viewer
- Server Details
Syslog Viewer
The Syslog Viewer tab showcases real-time logs that are currently being forwarded to the EventLog Analyzer server through the default ports (513, 514).
Note:-
- The list shows the live packets being received at the specified port in your machine. This does not guarantee that EventLog Analyzer has received the Syslog packets.
- The Log Receiver will listen for logs for up to three minutes or until 1000 packets are received. After reaching this limit, the Log Receiver requires a manual restart to resume listening. Click on Start Listening to resume the process. The option to restart is available under the Syslog Viewer tab.
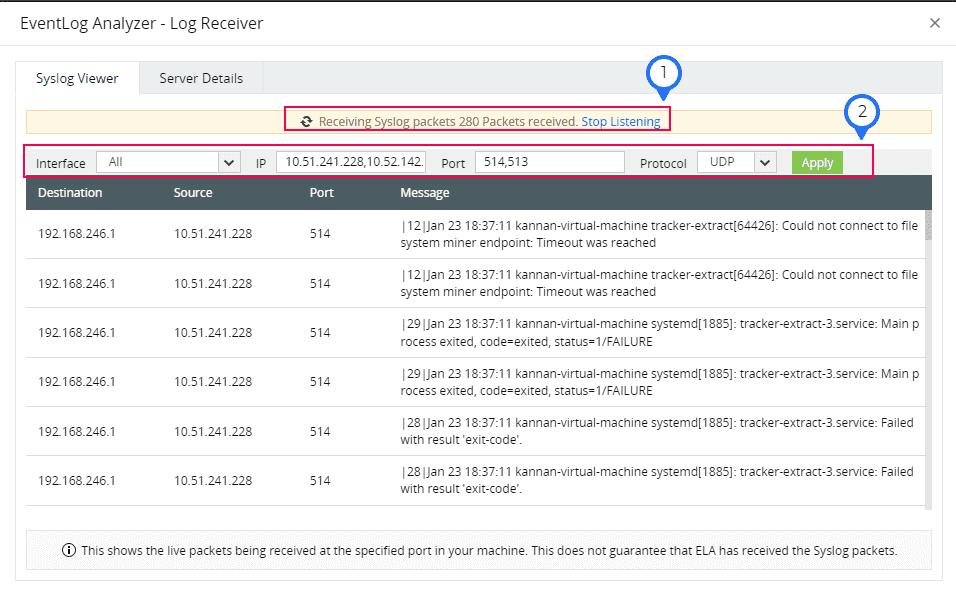
Point 1: Receiving Syslog packets 280 Packets received. Stop Listening-
It indicates the log count received and the status, specifying whether the product is actively listening to the logs or not. It can be halted and restarted as needed. (Refer Fig 2)
Point 2 - Apply
It indicates the configurations that can be adjusted to display the live logs received on the server. You can find the associated details below:
- Interface - It showcases all available network interfaces on the EventLog Analyzer server machine. To examine live logs for a specific interface, you can choose it from the dropdown box. Otherwise, it can be left as "All."
- IP - To verify whether logs from a specific device are received on the server machine, enter the IP address of the machines forwarding logs to EventLog Analyzer. For multiple devices, input their IP addresses with comma-separated values. To check for all devices, leave the field blank.
- Port - Specify the ports to which the logs are being forwarded to the EventLog Analyzer Server.The logs are forwarded to the EventLog Analyzer Server by default on ports 513 or 514.
- Protocol - You can specify the protocol as either UDP or TCP.
Click "Apply" to verify the logs received by the EventLog Analyzer server. The logs will be presented with details such as source IP, destination IP, port, and accompanied by the respective messages.
 Fig 2 Syslog Viewer Tab
Server Details
Server Details displays comprehensive information regarding EventLog Analyzer, including server name, IP, Access URL, Port details, Log flow, and more. The details regarding the mentioned fields are provided below. (Refer Fig 3)
 Fig 3 Server Tab
- Server Name - The name of the current server or machine where EventLog Analyzer is installed.
- Server IP Address - It indicates the network adapter linked to EventLog Analyzer; if none is specified, it displays "All Interface."
- Application Access URL - The URL utilized for accessing the EventLog Analyzer application.
- UDP ports - The UDP ports configured in EventLog Analyzer that are either in a listening state or have encountered failures.
- TCP ports - The TCP ports configured in EventLog Analyzer that are either in a listening state or have encountered failures.
- TLS ports - The TLS ports configured in EventLog Analyzer that are either in a listening state or have encountered failures.
- SNMP Traps Port - The SNMP Trap ports configured in EventLog Analyzer that are either in a listening state or have encountered failures.
- Server Status - The current status of EventLog Analyzer
- Flow Rate - The log flow per second for the past hour.
- Received - The log flow for the previous hour.
- Current hour log rate - Displays the log flow per second for the current hour.
- Total Packets Received - Total logs received for the current hour
 Click here to expand
 Fig 1 EventLog Analyzer- Log Receiver
 Fig 2 Syslog Viewer Tab
 Fig 3 Server Tab