Active Directory monitoring in OpManager
Active directory monitoring feature takes OpManager a step further in proactive monitoring of Windows environment. The system resources of the Domain Controllers where the Active Directory(AD) database resides, and few critical Active Directory Services are monitored in OpManager.
To make AD monitoring more simple and easily accessible, The Domain Controllers are classified under a separate category under Infrastructure Views. The categorization of the device as a Domain Controller is done automatically if SNMP is enabled. The system resources of the device and the AD services are monitored using WMI. Kindly note that users can monitor AD services with the privileges needed for WMI and don't need any separate privileges for the same.
Following are the AD service monitors that are associated by default.
- Windows Time service : The service synchronizes the time between domain controllers, which prevents time skews from occurring.
- DNS Client Service : This service resolves and caches (Domain Name Server) DNS names.
- File Replication Service : This service maintains file synchronization of file directory contents amongst multiple servers.
- Intersite Messaging Service : This service is used for mail-based replication between sites. Active Directory includes support for replication between sites by using SMTP over IP transport.
- Kerberos Key Distribution Center Service : This service enables users to log on to the network using the Kerberos version 5 authentication protocol.
- Security Accounts Manager Service : This service signals other services that the Security Accounts Manager subsystem is ready to accept requests.
- Server Service : This service enables the computer to connect to other computers on the network based on the SMB protocol.
- Workstation Service : This service provides network connections and communications.
- Remote Procedure Call (RPC) Service : This service provides the name services for RPC clients.
- Net Logon Service : This service supports pass-through authentication of account logon events for computers in a domain.
Configuring monitors for AD services
Device level configuration
- Open the "Device snapshot" page by navigating to "Inventory -> Devices" and then clicking on a device.

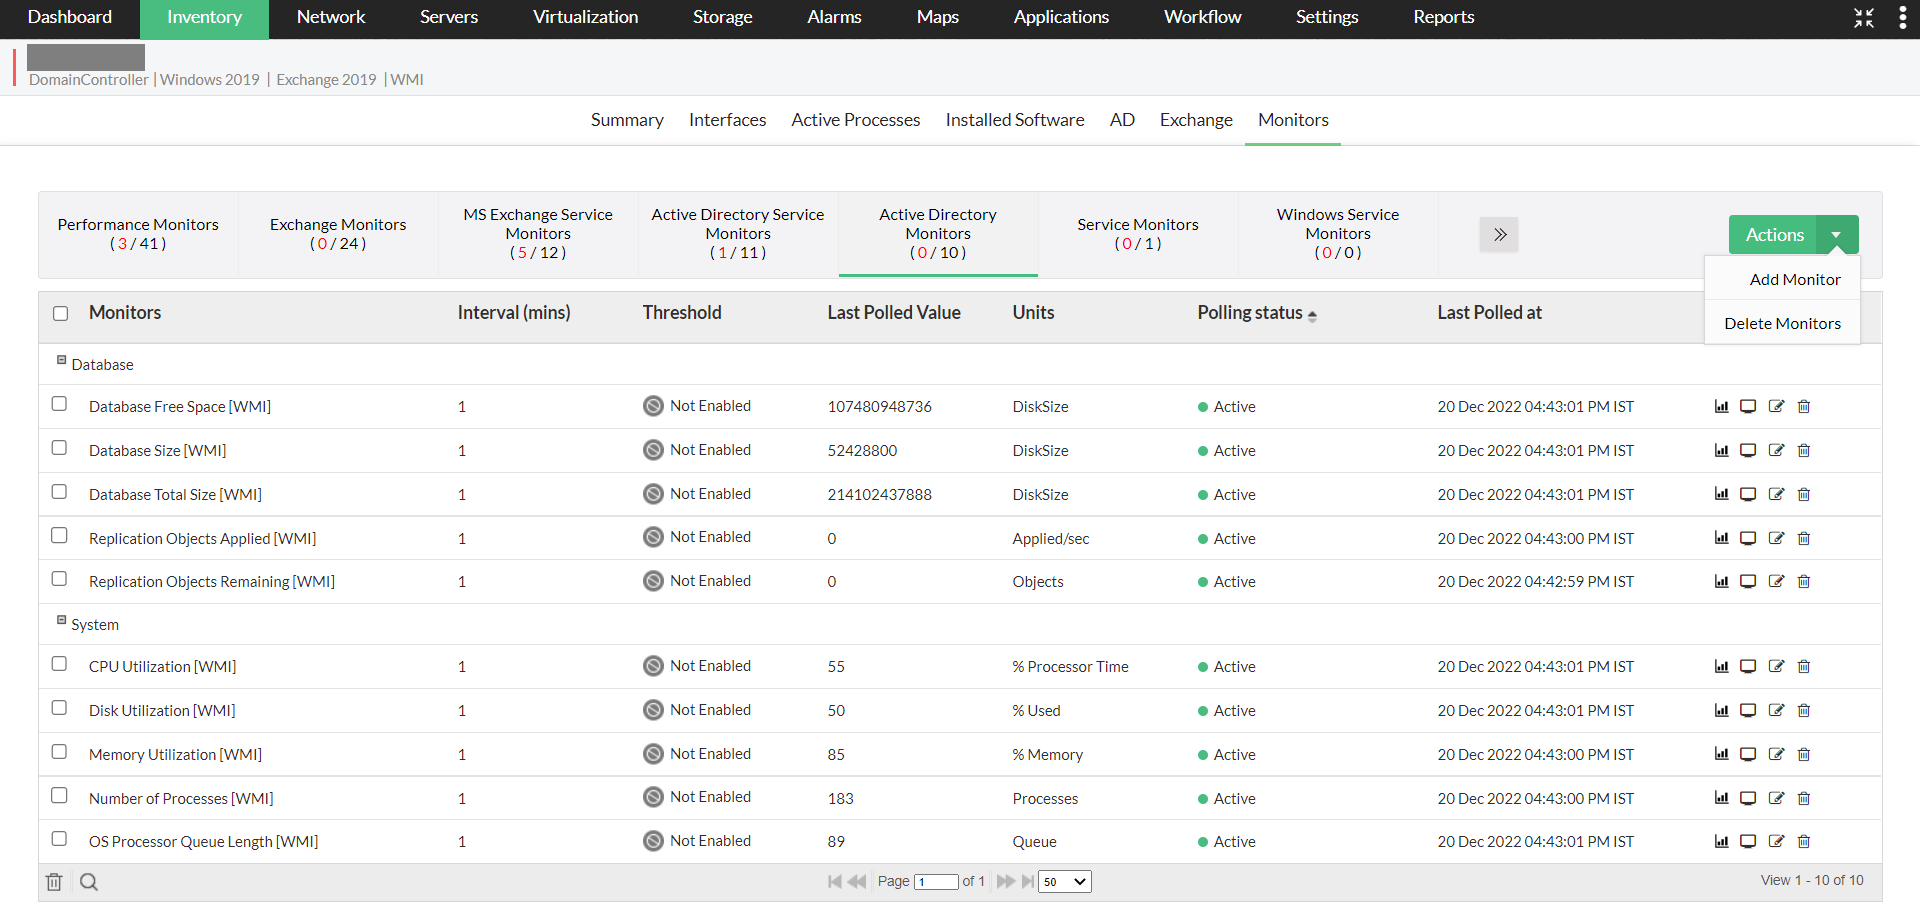
- Head to the "Monitors" tab and under the "Active Directory Monitors".
- A list of all AD monitors available will now be listed down.
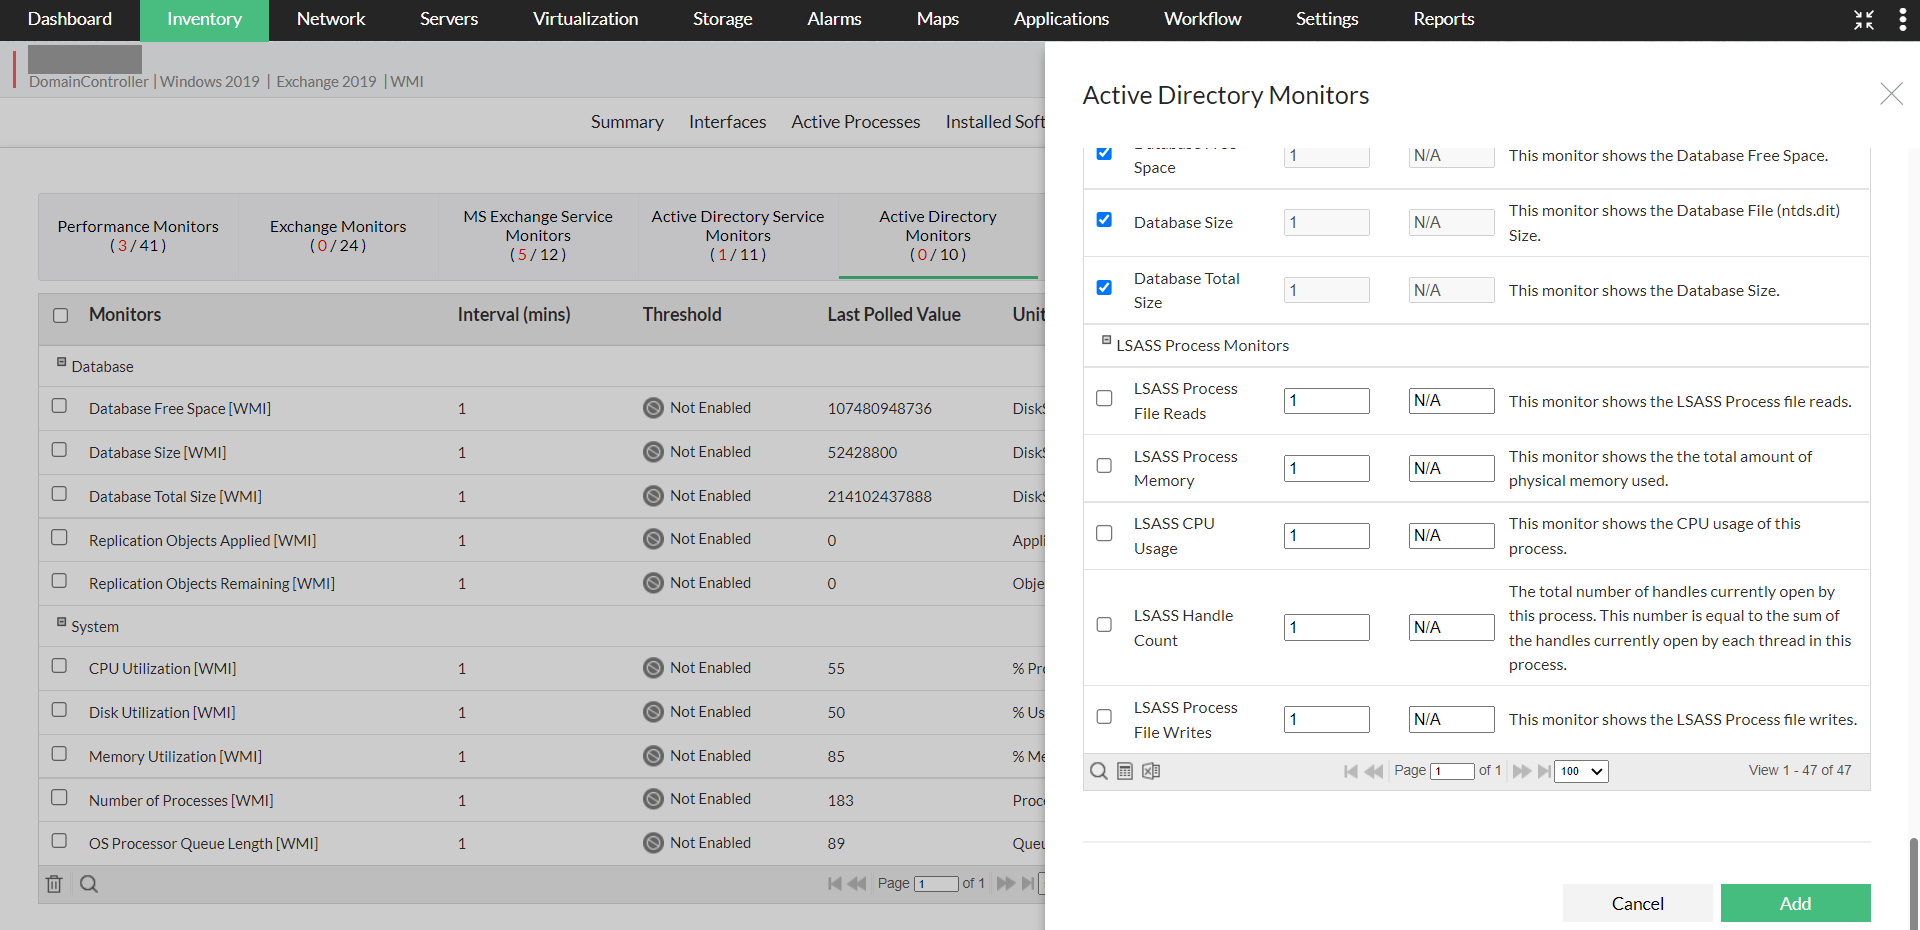
- Now, click on the "Actions" button at the top-right corner of the page, and then select "Add Monitor".

- Now select the relevant monitors and click on the "Add" button at the bottom.

The monitors are now successfully associated to the device. Ensure that you have used the right WMI credentials for the device association, since OpManager uses these credentials to communicate with devices.
Bulk Configuration
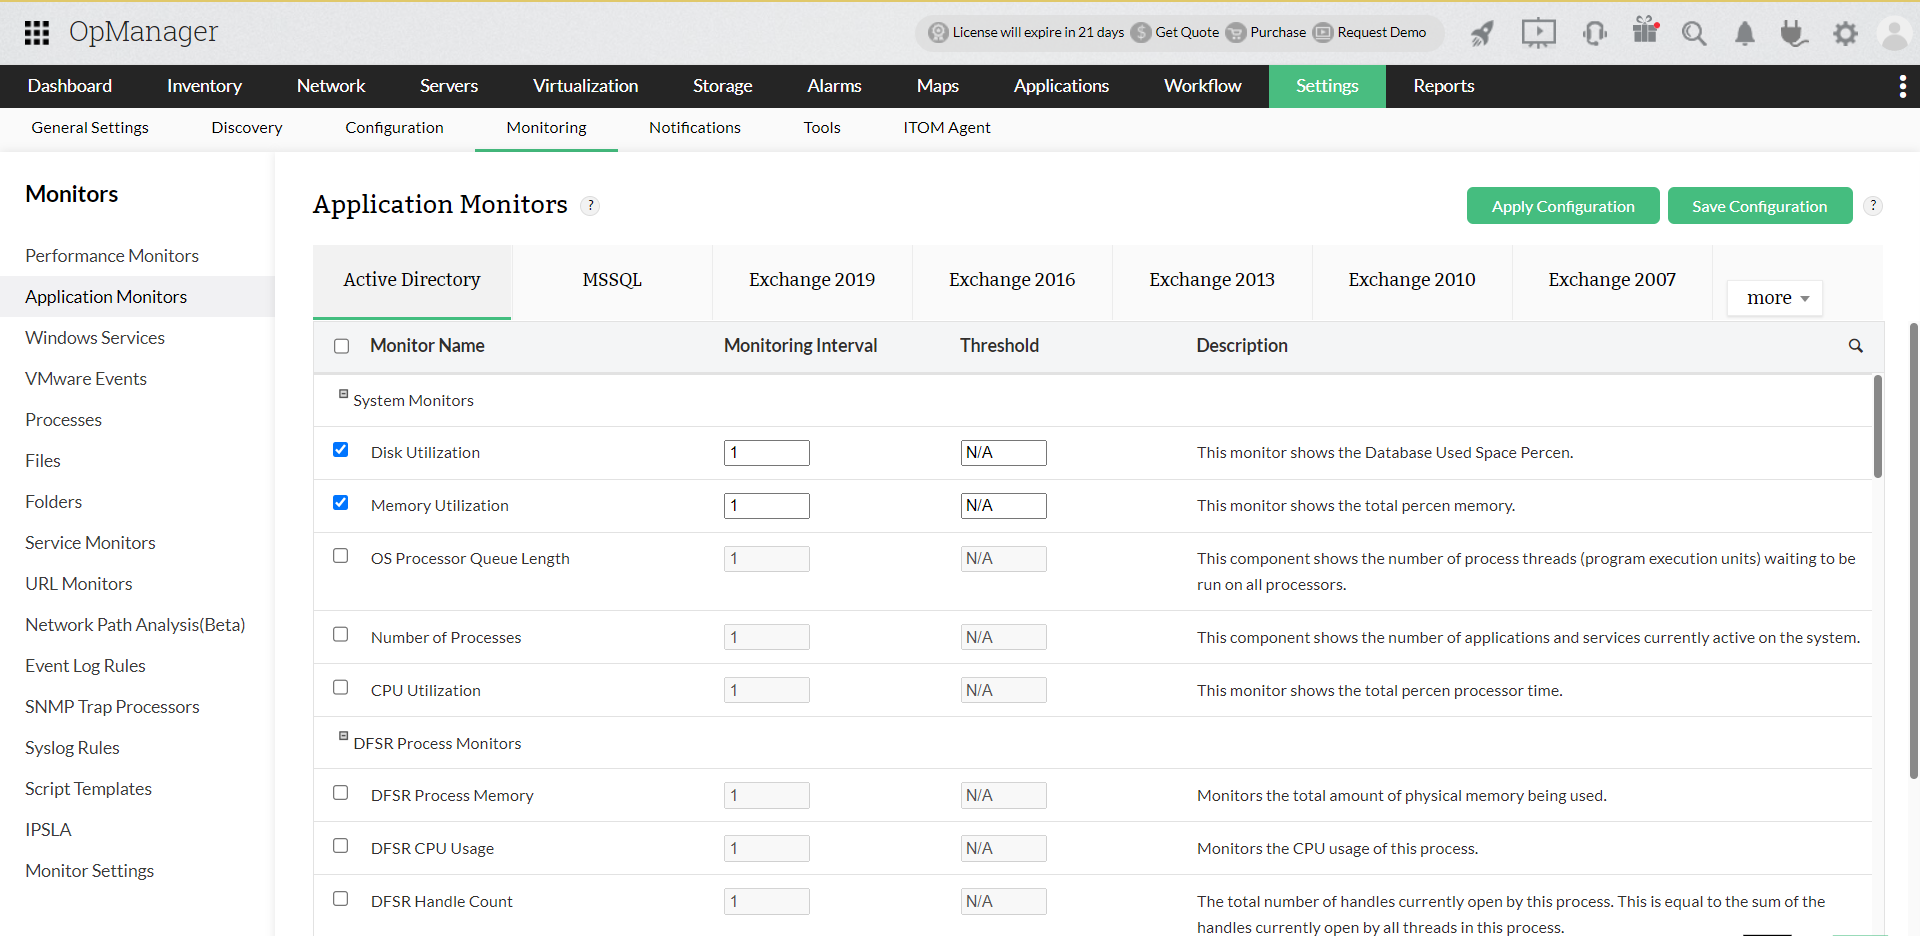
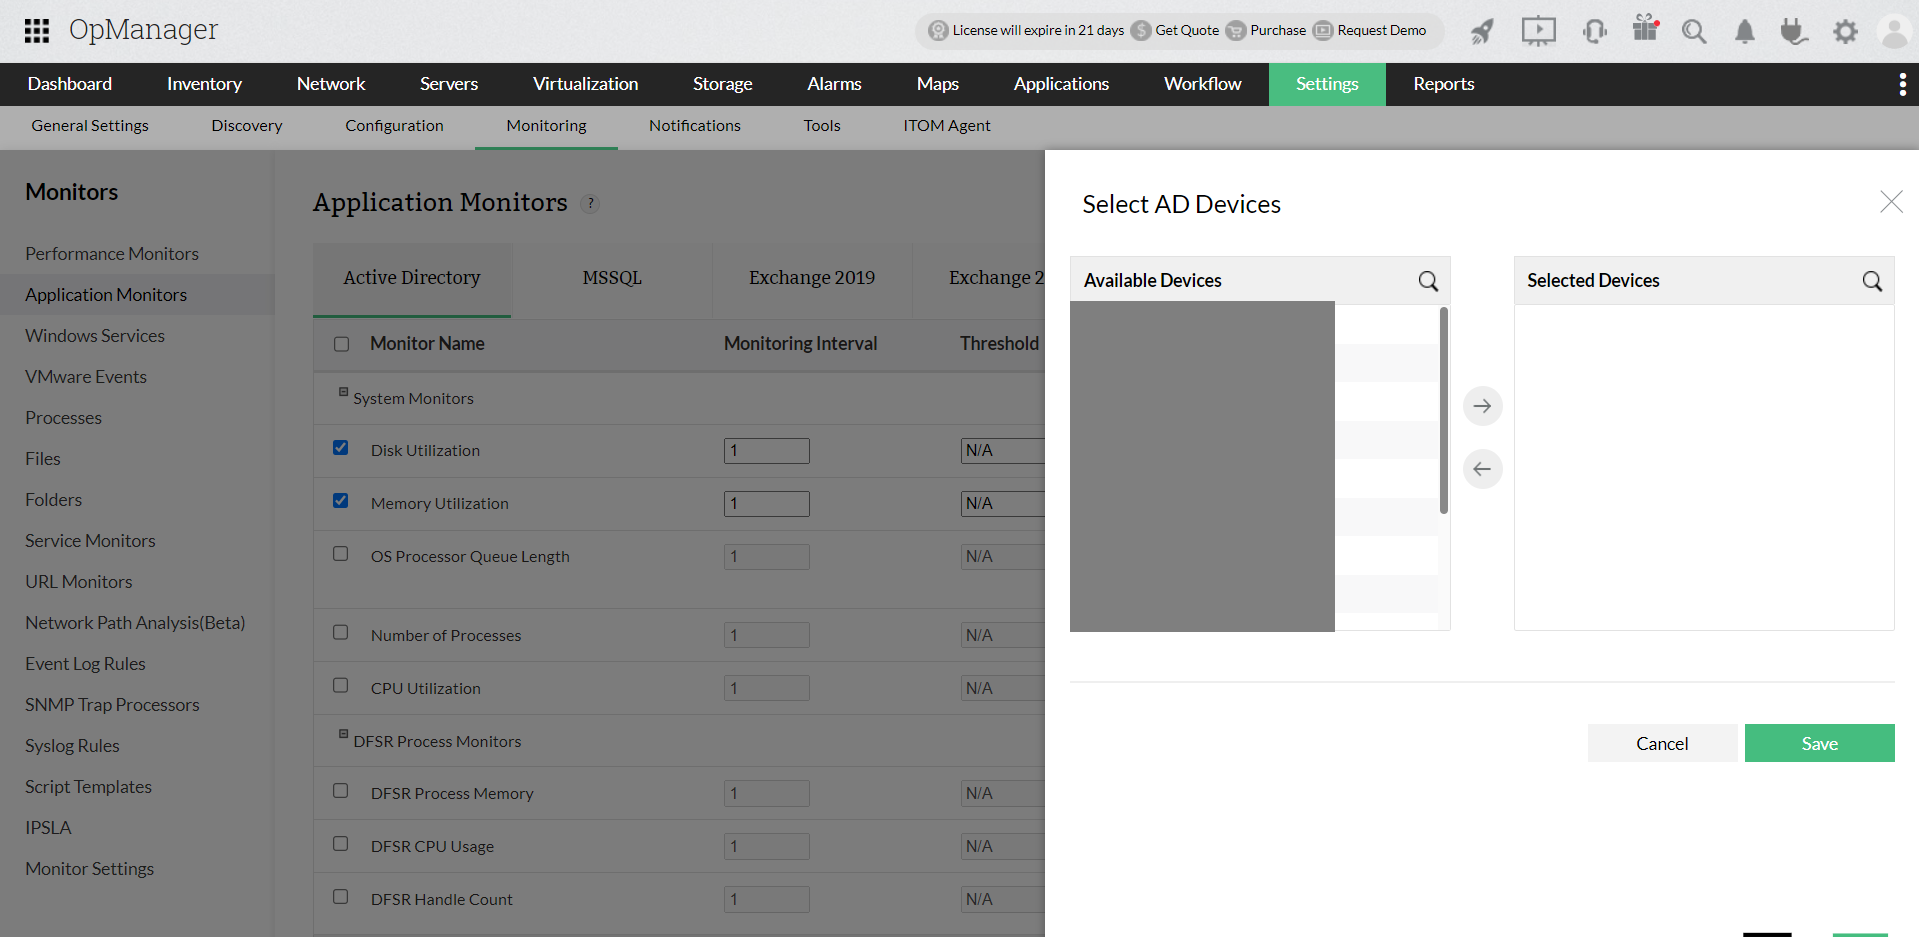
- To associate monitors to multiple devices at a time, navigate to "Settings -> Monitoring -> Application Monitors".
- Under the "Active Directory", select the monitors you want to associate. You can even modify the monitoring interval and thresholds under the respective columns.
- Select the devices you want to associate from the "Available Devices" section and then move them to the "Selected Devices" section.
- Click on "Save".
- Once the monitors are selected, click on "Apply Configuration" at the top right corner.

Proactively monitor your active directory by setting suitable thresholds
You can monitor the active directories in your domain controller by configuring thresholds. In case of threshold violation, alerts will be generated. By configuring relevant notification profiles and associating them with the respective devices, alerts will be sent out to the corresponding person at the earliest. Furthermore, users can also automate the discovery process by using the discovery rule engine feature.
Visualize your Active Directory monitoring efforts
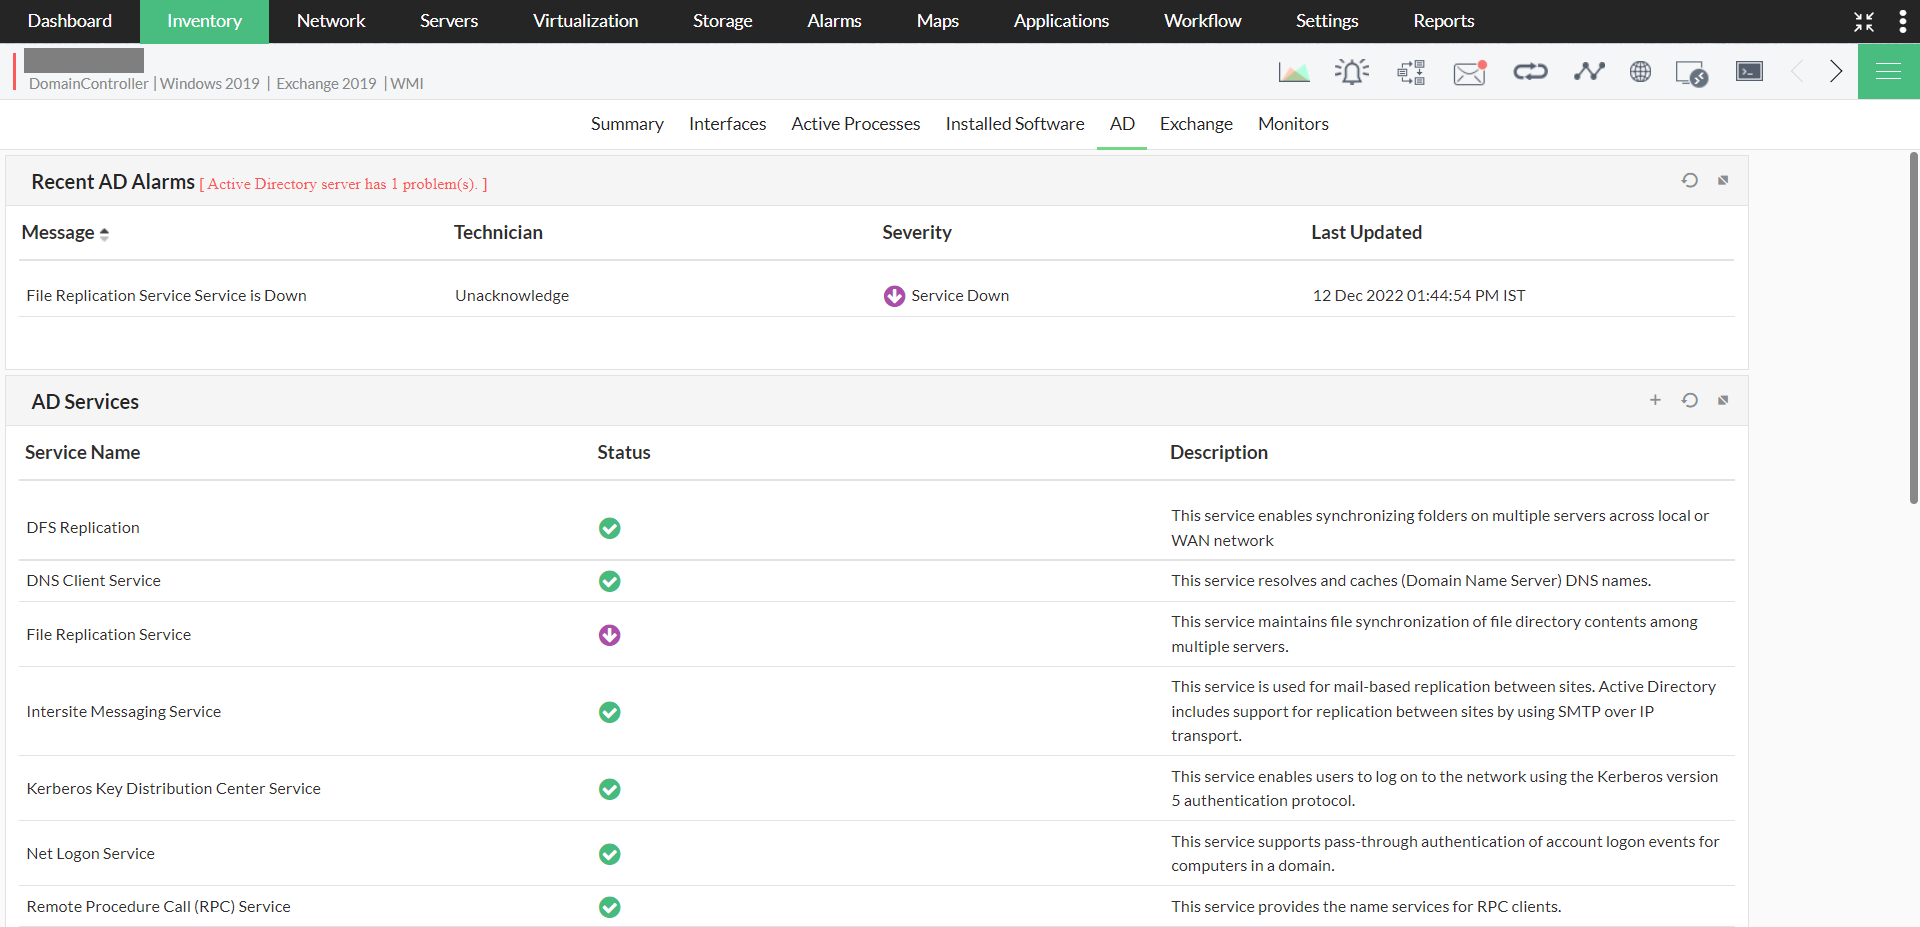
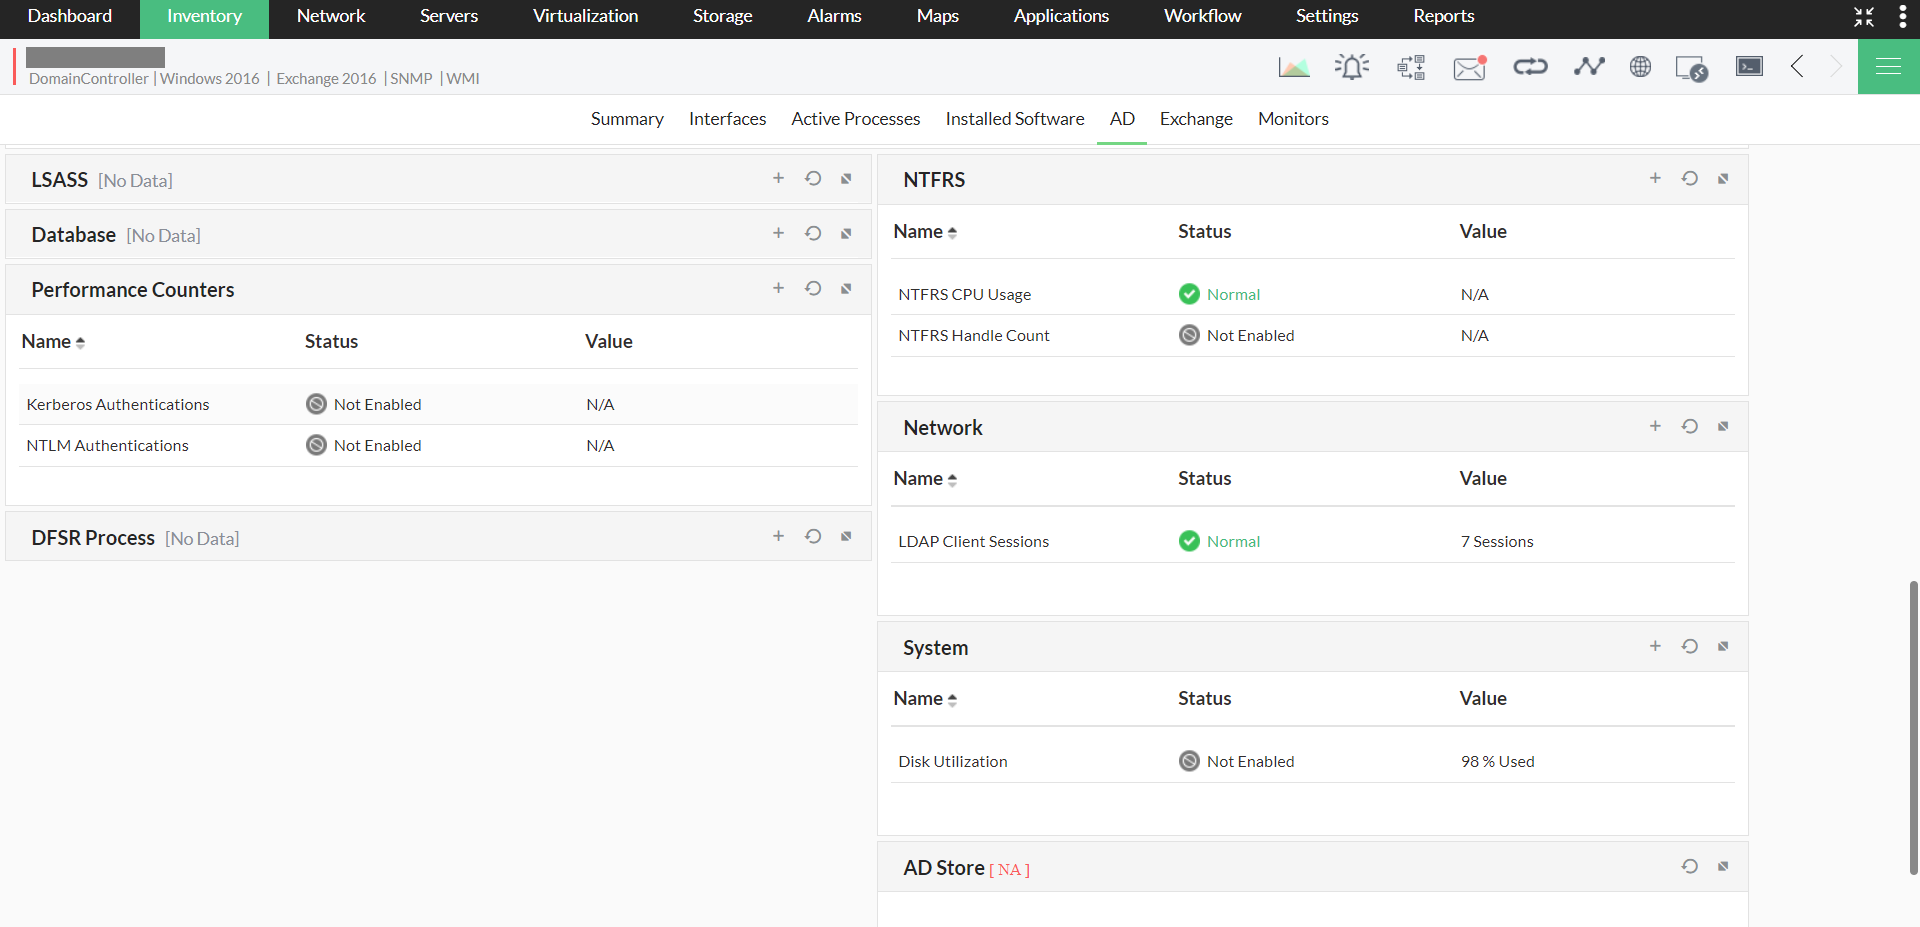
Under the "AD" tab in the "Device snapshot" page, users can now see all the data pertaining to Active Directory monitoring. This tab serves as a dashboard where you can get insights about your recent alarms, the AD services being monitored, the status of the AD services, and etc.


Thank you for your feedback!
