The Perf Group refers to a set of common performance monitors that are grouped together. It can be useful to generate custom reports using the Advanced reports feature. This help page covers the following:
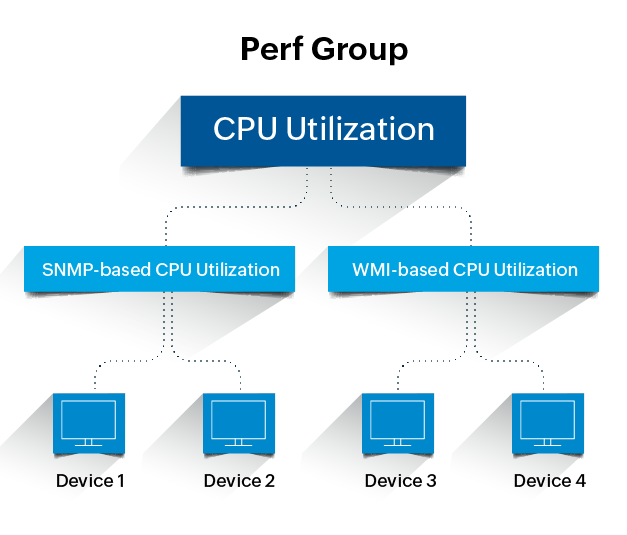
To understand how it works, let us consider an example. You monitor CPU usage for 5 devices in your network. The CPU Utilization metric associated to each of these devices may be different in terms of the protocol, for example CPU usage for a Windows device will be monitored using WMI, for other devices CPU usage maybe monitored using SNMP.
Both the SNMP-based CPU metric and WMI-based metric are grouped together into one Perf Group namely CPU Utilization.

So, effectively those 5 devices are somehow connected to each other by the CPU Utilization metrics categorized into a Perf Group.
When creating a custom report using the Advanced report feature, you can select a Perf Group and a report will be created for all the devices to which that metric is associated.
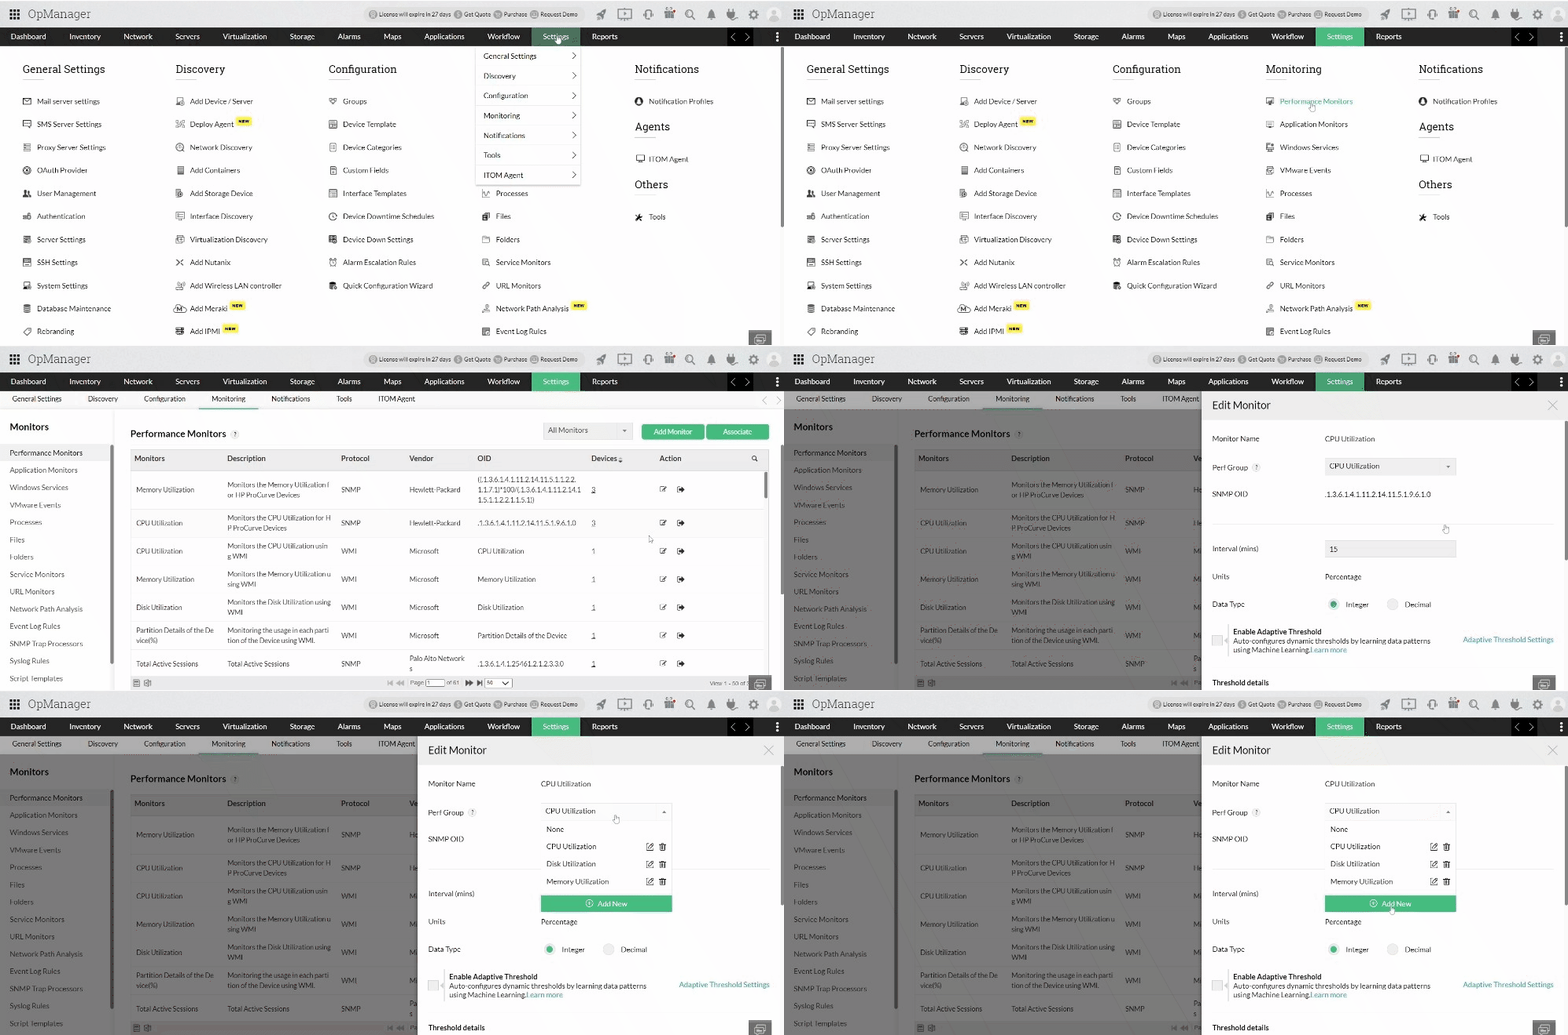
By default, OpManager has 64 Perf Group categories, such as CPU utilization, Memory utilization, Disk utilization, etc. Apart from this, you can also create custom Perf Groups for other monitors as per your preferences. To Create a new Perf Group, follow the steps below.

You can also add a new custom monitor to a Perf Group while creating a new SNMP monitor.
To view Perf Groups, navigate to Settings > Performance Monitors and select Perf Groups from the dropdown in the top-right corner.
The Perf Groups page displays the following details:

Thank you for your feedback!