Report builder
Reports in OpManager contain monitoring information of the network devices. Reading these intuitive, historical reports gives insights in to network availability and performance trends.
There are 100+ inbuilt reports in OpManager which are categorized to access the needed data easily. For example, Forecast reports, Availability and Performance reports.
Apart from this, users can create customized reports as per their monitoring preferences.
Users can also generate reports particularly for devices or interfaces monitored by OpManager. The inventory page lists down all the devices/interfaces that are a part of the monitoring network. Users can simply create a report for a specific set of devices or interfaces from the inventory page.
How to generate a new report?
- Navigate to Inventory-->Devices.
- Select the devices (or interfaces).
- Click on Generate Report in the top right corner.
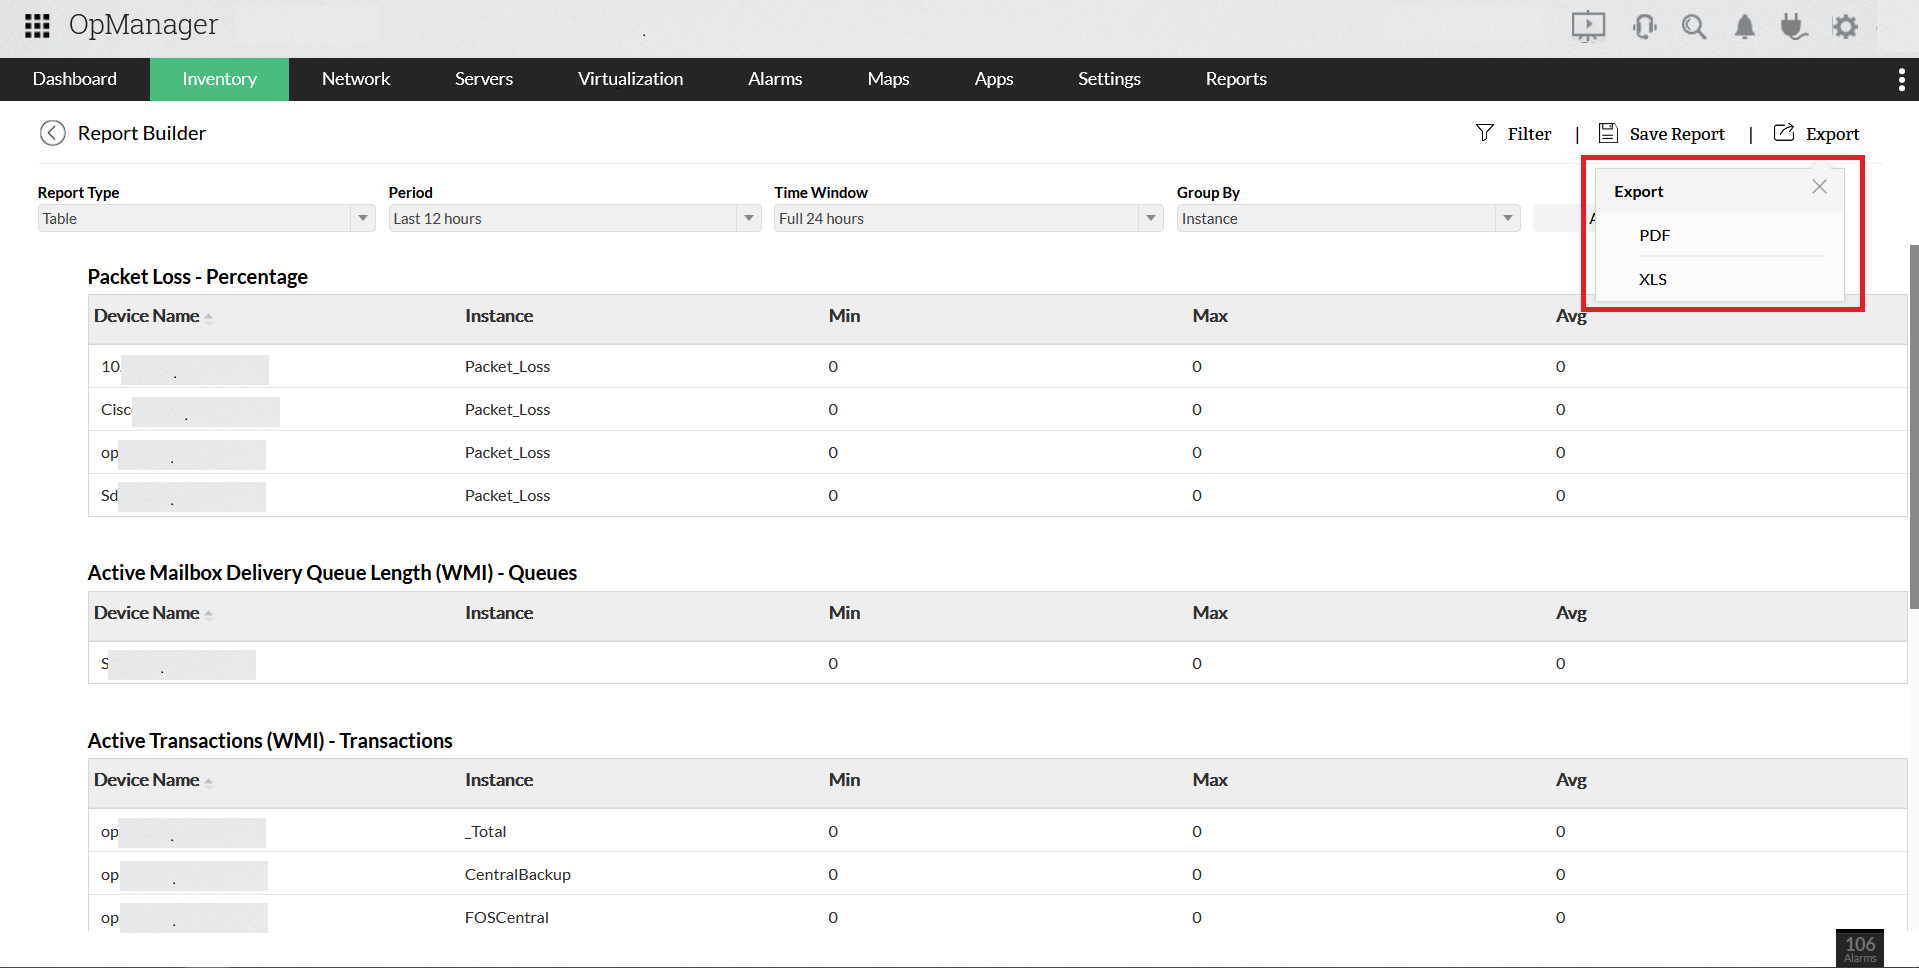
- Specify the Report type - Graph View or Table View.
- Specify the Time Period. (Only the monitoring information of the mentioned period will be generated as a report.)
- Choose the Monitors.

- Click on Generate Report. A preview of the report will be displayed. (You can export the reports in PDF/XLS format. The XLS format is available only for reports generated in Table View.)
- Click on Export as PDF to download the report. (or)
- Click on Save Report.
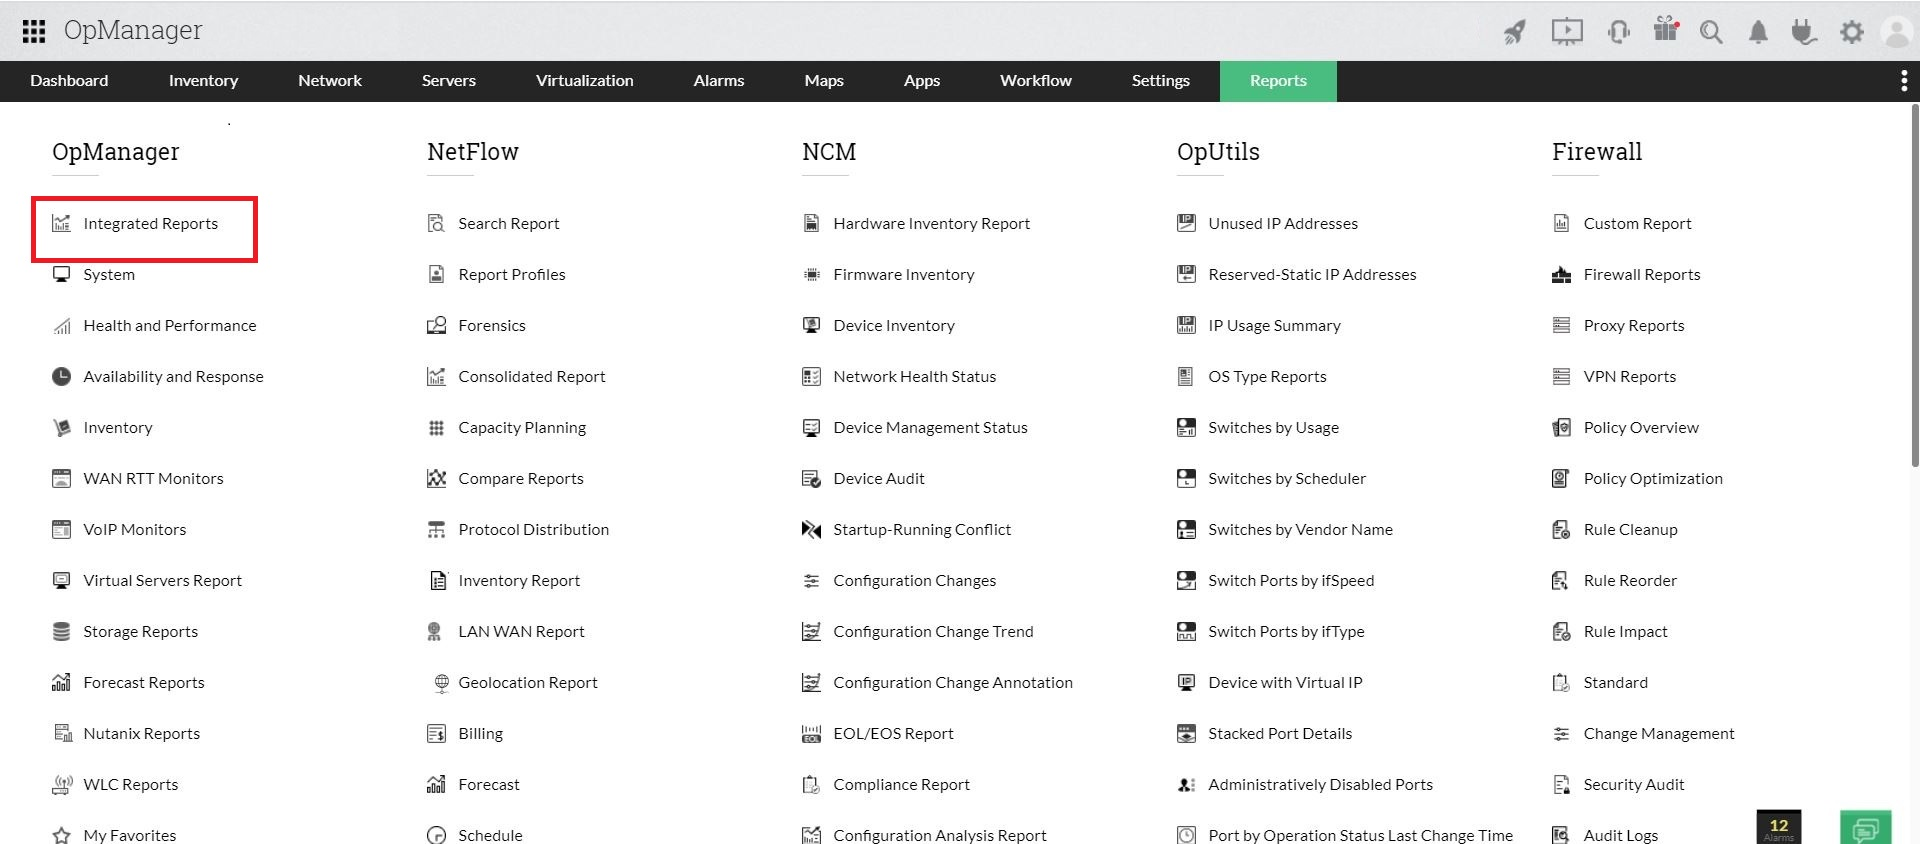
- To access the saved report navigate to Reports-->Integrated Reports.

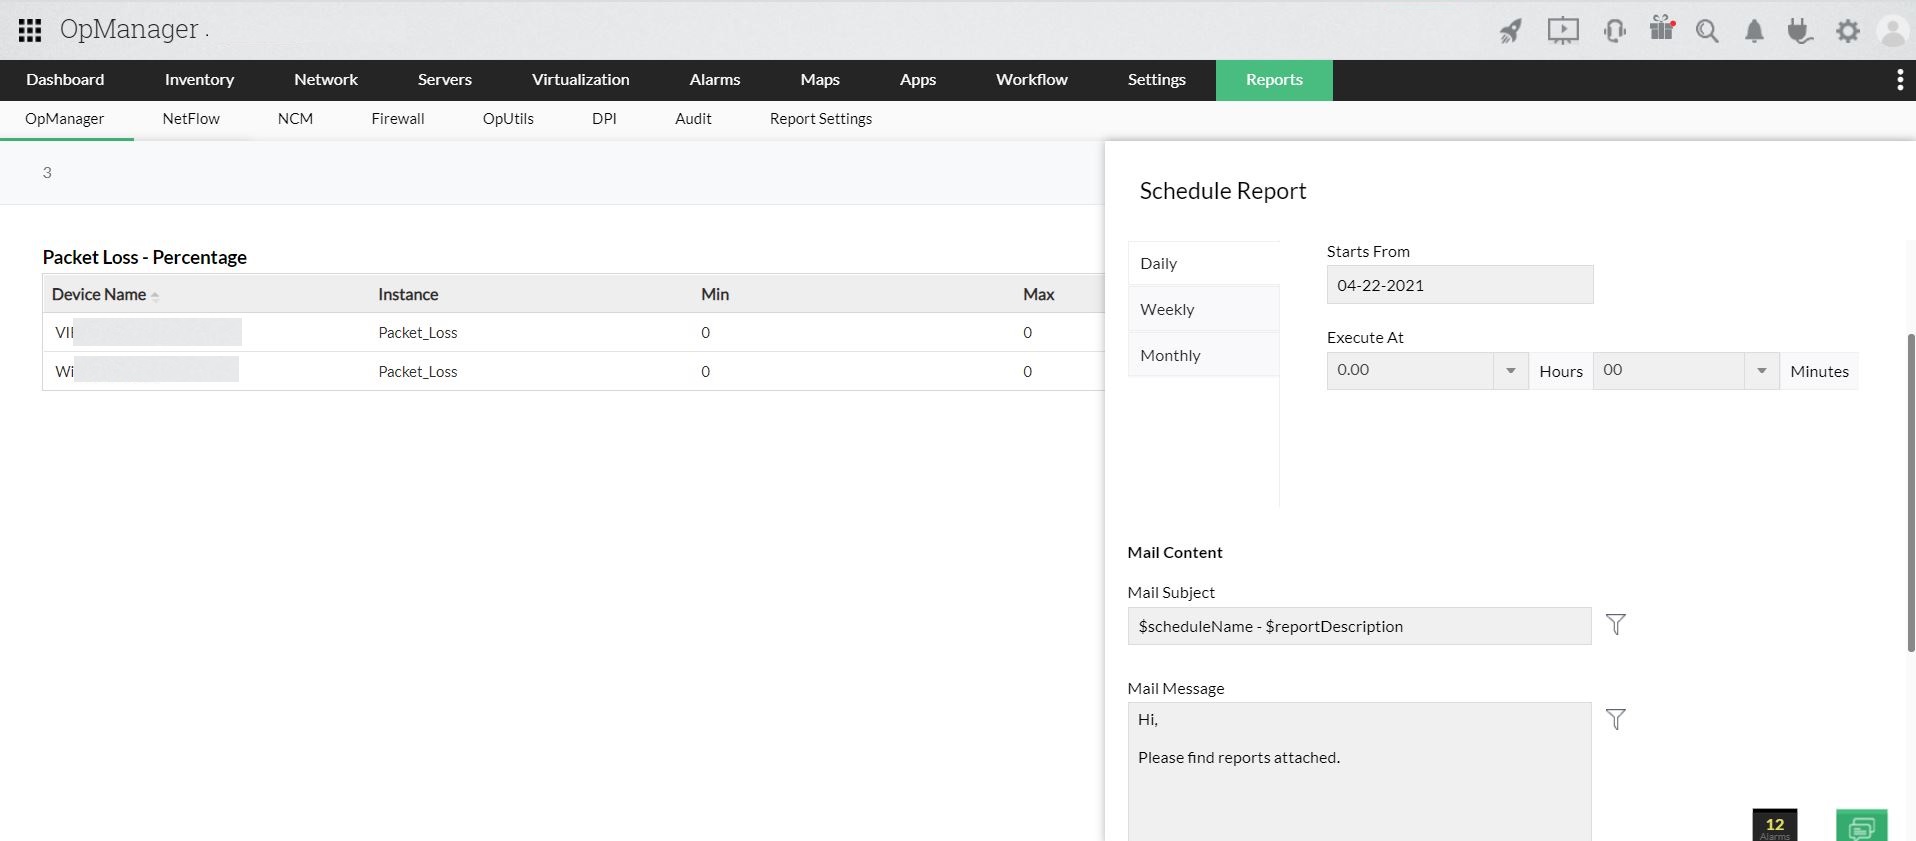
- To schedule the report, click on the report and click on Schedule on the top right corner.

Note: These reports will be stored and can be accessed by navigating to Reports > OpManager > Integrated Reports.

