Add style to chart
The Style tab allows you to add customization to the charts by applying different chart themes, setting legend position and adding a background color. You can also change the chart type from the slider pane on the left.
To apply style to a chart
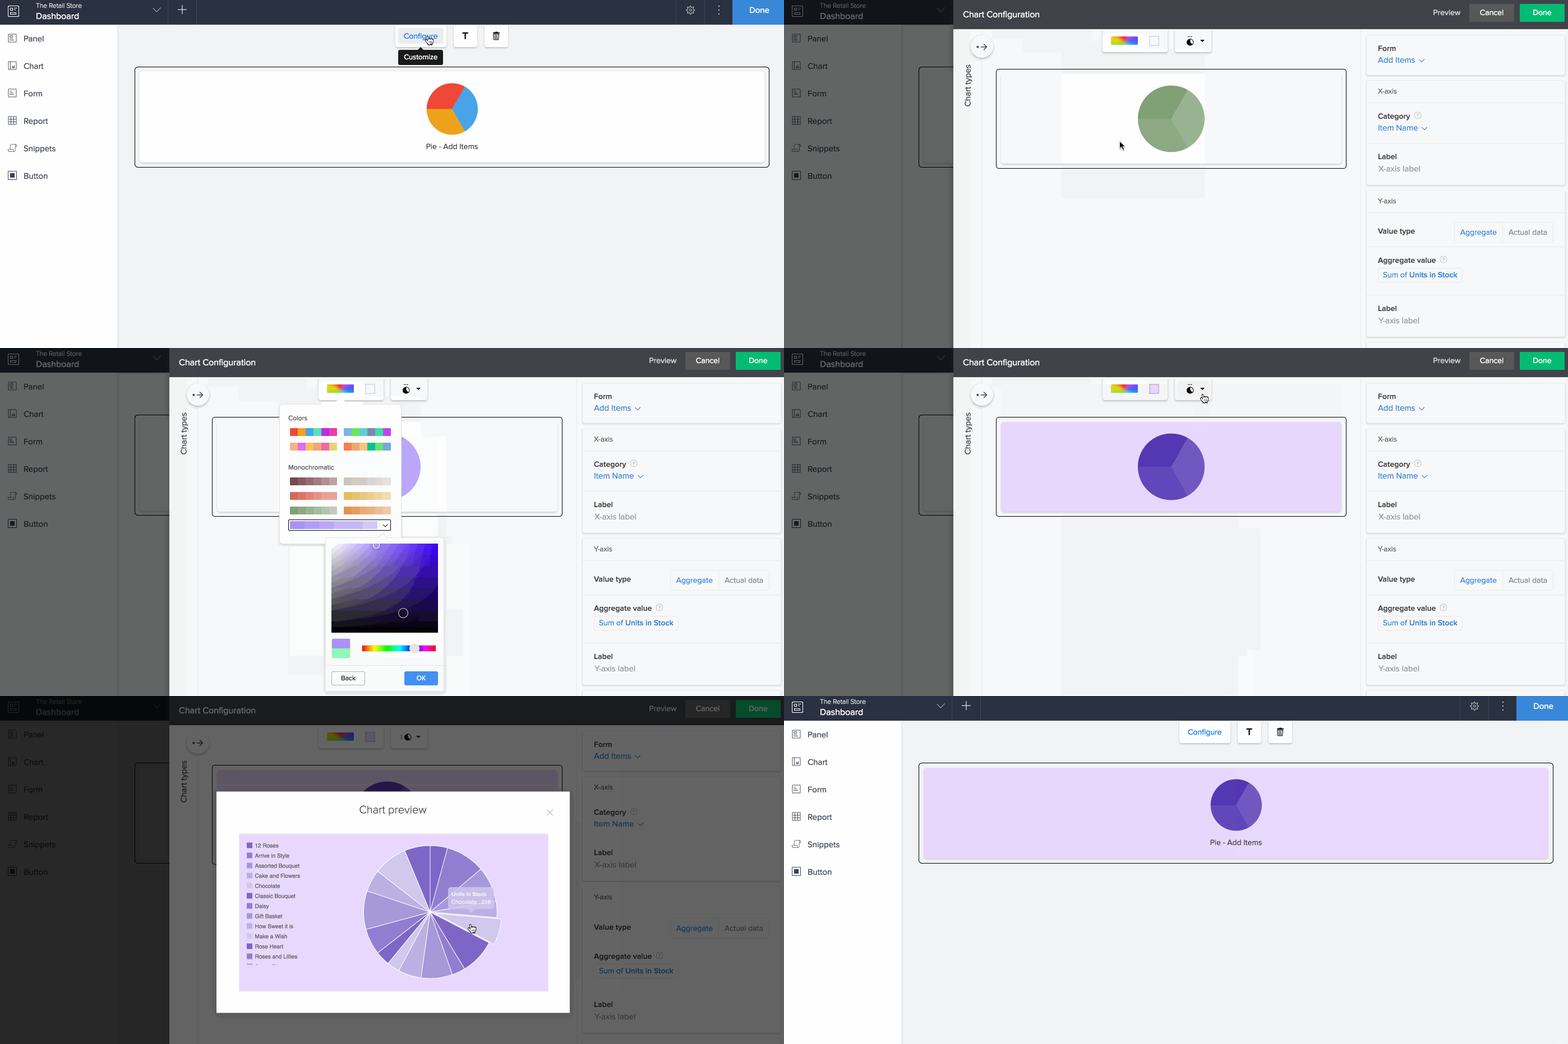
- Double click the chart to add style to it or single click to select the chart and then click the Configure option in the toolbar at the top center of the page builder.
- Using the chart styling toolbar present at the top, apply following styles to the chart:
- Chart Theme: Use the color pallette, to set a theme for the chart. You can chose from the pre-defined themes or pick your own theme.
- Chart Background color: Using the background color icon, add a background color to the chart.
- Legend Position: Using the Legend position drop down, choose a position to place the chart legends.
- Click the Preview button on the top right, to preview the added styling.
- Click Done at the top right of the Configuration pane to save the changes.
 Note: Preview option will be made available only after the chart has been configured.
Change chart type
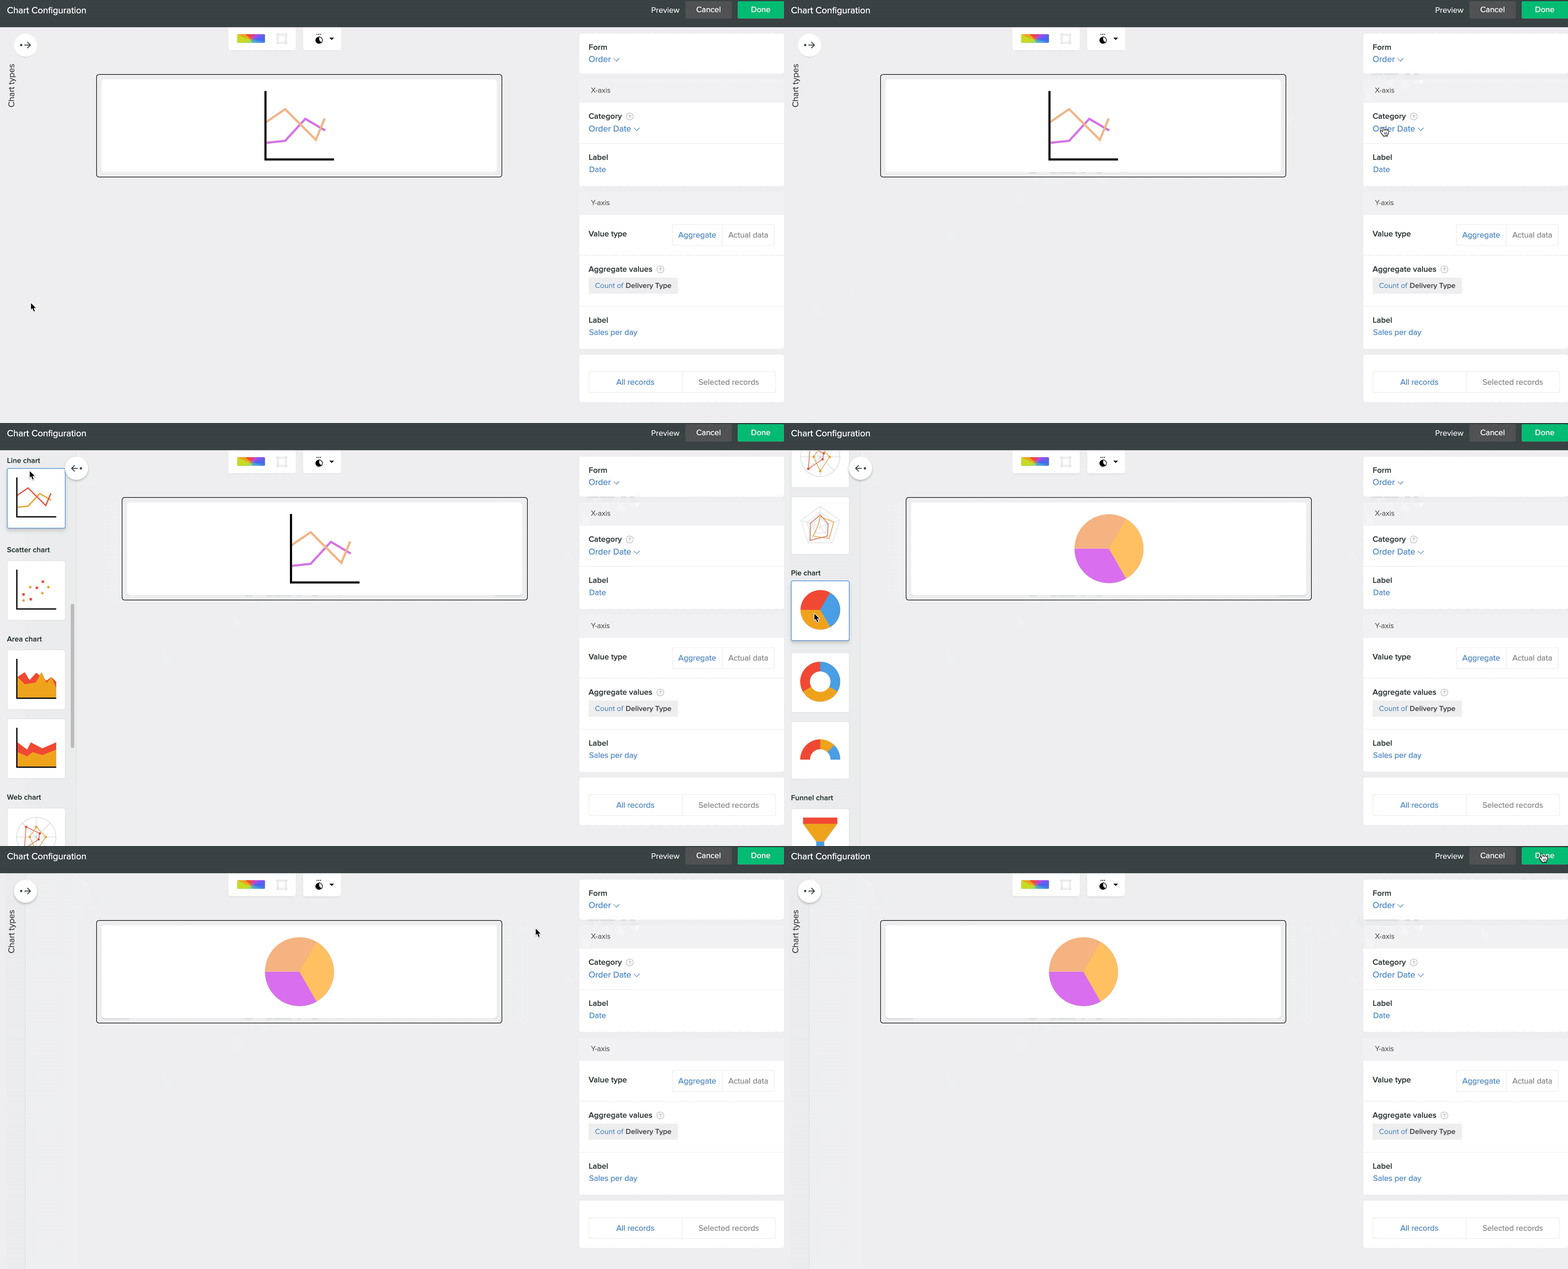
- Double click the chart or single click to select the chart and then click the Configure option in the toolbar at the top center of the page builder.
- The Chart Configuration pane slides in from the right.
- Click the arrow beside Chart types on the left of the pane. You can view and change the chart type from here.
 Note: The option to change the chart type will be made available only after the chart has been configured. The change of chart type will not affect your saved configurations.