Data Collection Manager
The new Data Collection Manager feature in OpManager aids in viewing all monitor/interface/credential related issues in a single pane, so that any monitors/interfaces without ongoing data collection can be easily identified. Furthermore, users can also view the polling status of the monitors.
From the performance aspect, DCM also lets you improve the efficiency of polling and reduce unnecessary polling load on the server. It improves the overall data collection performance in the OpManager server and helps streamline the server's resources to reduce unnecessary load.
To access the Data Collection Manager, users can go to Support → Diagnostics → Settings and enable it.
How does Data Collection Manager work?
DCM basically monitors issues in data collection based on three criteria:
- Failed Monitors: Monitors with issues in data collection
- Failed Interfaces: Interfaces with issues in data collection
- Failed Credentials: Credentials that are invalid/incorrect and therefore causing issues in data collection.
The functionality of Data Collection Manager can be summarised as follows:
- Once enabled, DCM constantly monitors the polling activity of each monitor/interface/credential in OpManager.
- If the data collection of a monitor continuously fails for 6 hours or more, it is moved to a 'Delayed Polling' state in DCM. Note that 6 hours is the default value, and the user can configure this value to be anywhere between 3-12 hours.
- In the Delayed Polling state, the polling interval of the monitor is increased to 6 hours irrespective of the interval already provided in the monitor. The user can configure this interval to be anywhere between 3-12 hours.
- During this Delayed Polling state, if the monitor starts responding again, and the data collection resumes, it will be moved back to the normal state.
- If a monitor continues to fail beyond a set number of days (configurable between 3 to 7 days), users can either configure OpManager to automatically retry polling after the specified number of hours/days, or disable polling entirely.
- Users can enable alerts for failed credentials and performance monitors under the Alert section in the DCM settings. Alerts can be configured for performance monitor failures after a set number of consecutive failures.
- Once alerting is enabled for performance monitors, and a monitor fails the configured number of times, it transitions to the Failed Polling state. In this state, the monitor continues to poll at its original polling interval.
- Failure notifications for performance monitors can be sent via email by adding multiple email addresses (separated by commas).
- The details about these failed monitors/interfaces/credentials can be sent as reports to the user on a daily basis. Details to be sent and all other settings related to DCM can be configured under the Settings tab in the Diagnostics page.
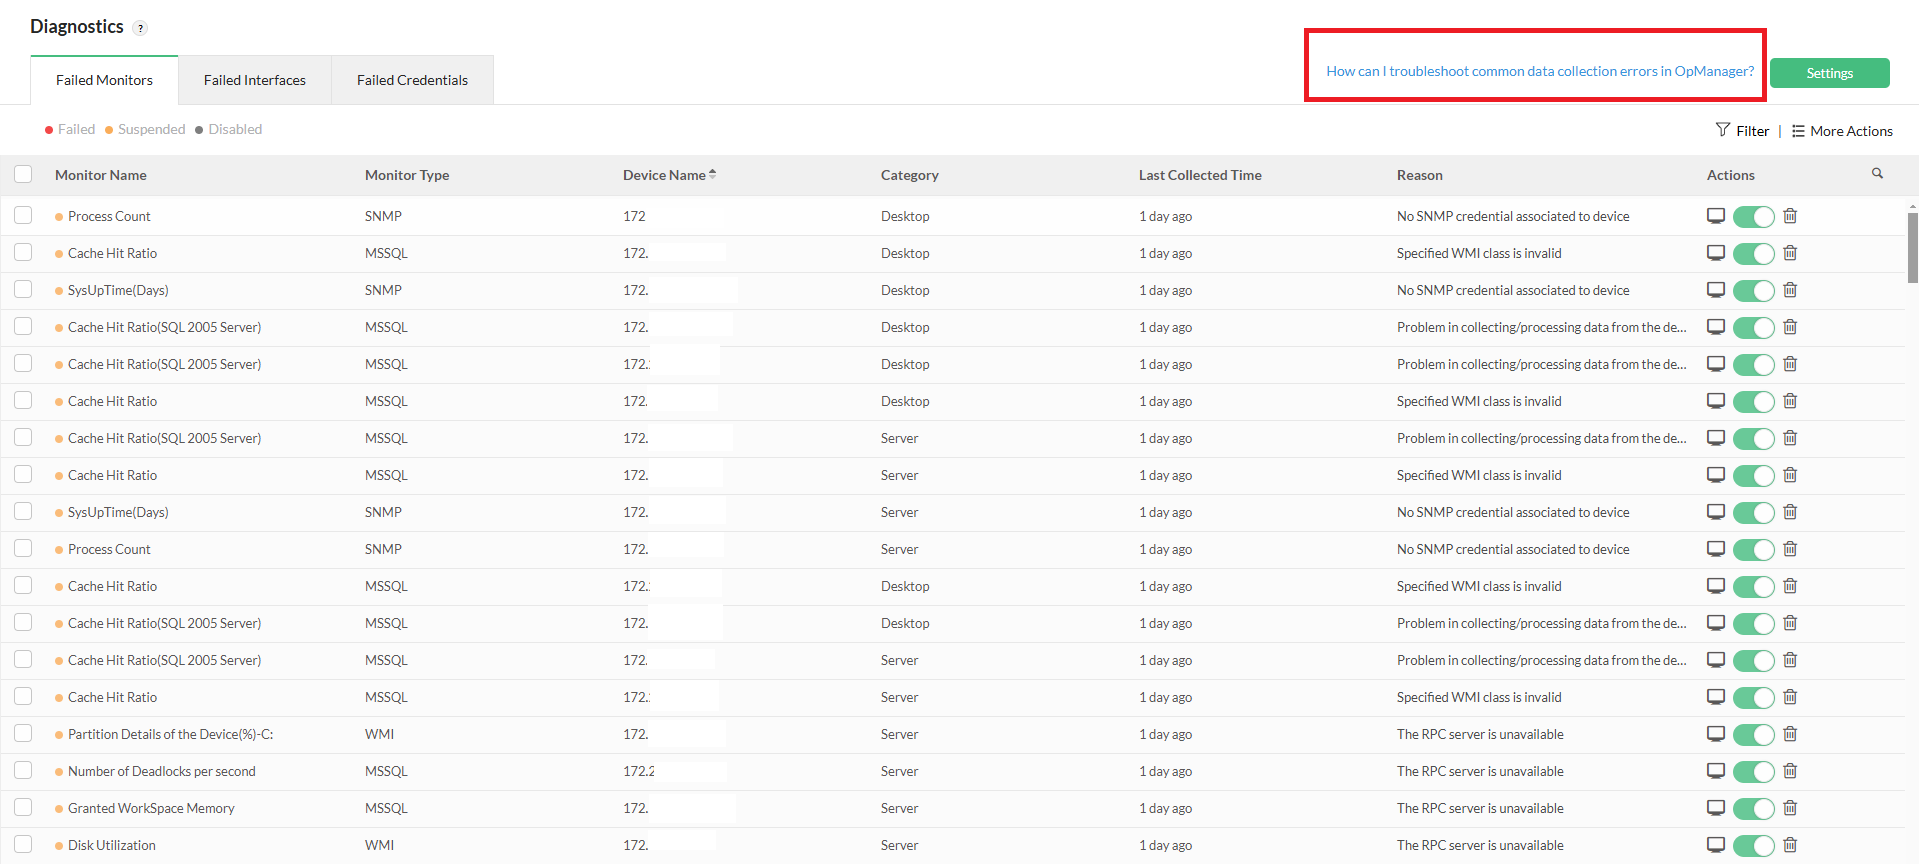
Where can I find the details about failed monitors/interfaces/credentials?
- Details about the data collection issues can be found in the Diagnostics page, that can be accessed from Support → Diagnostics.
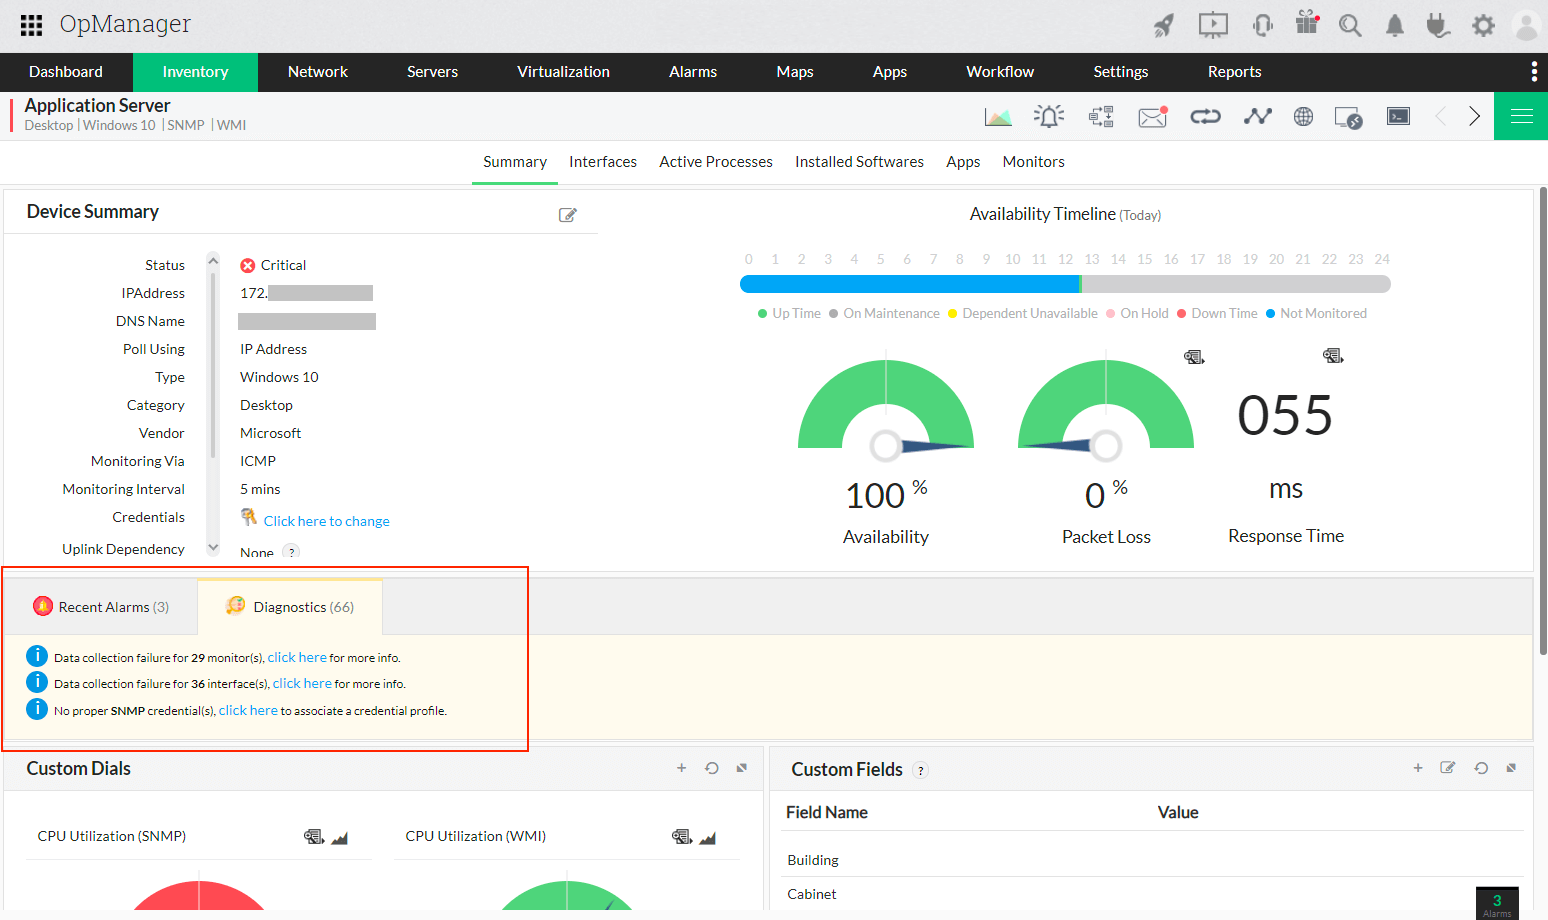
- The failed monitor/interface/credential details are also displayed in the Snapshot page of the respective device.
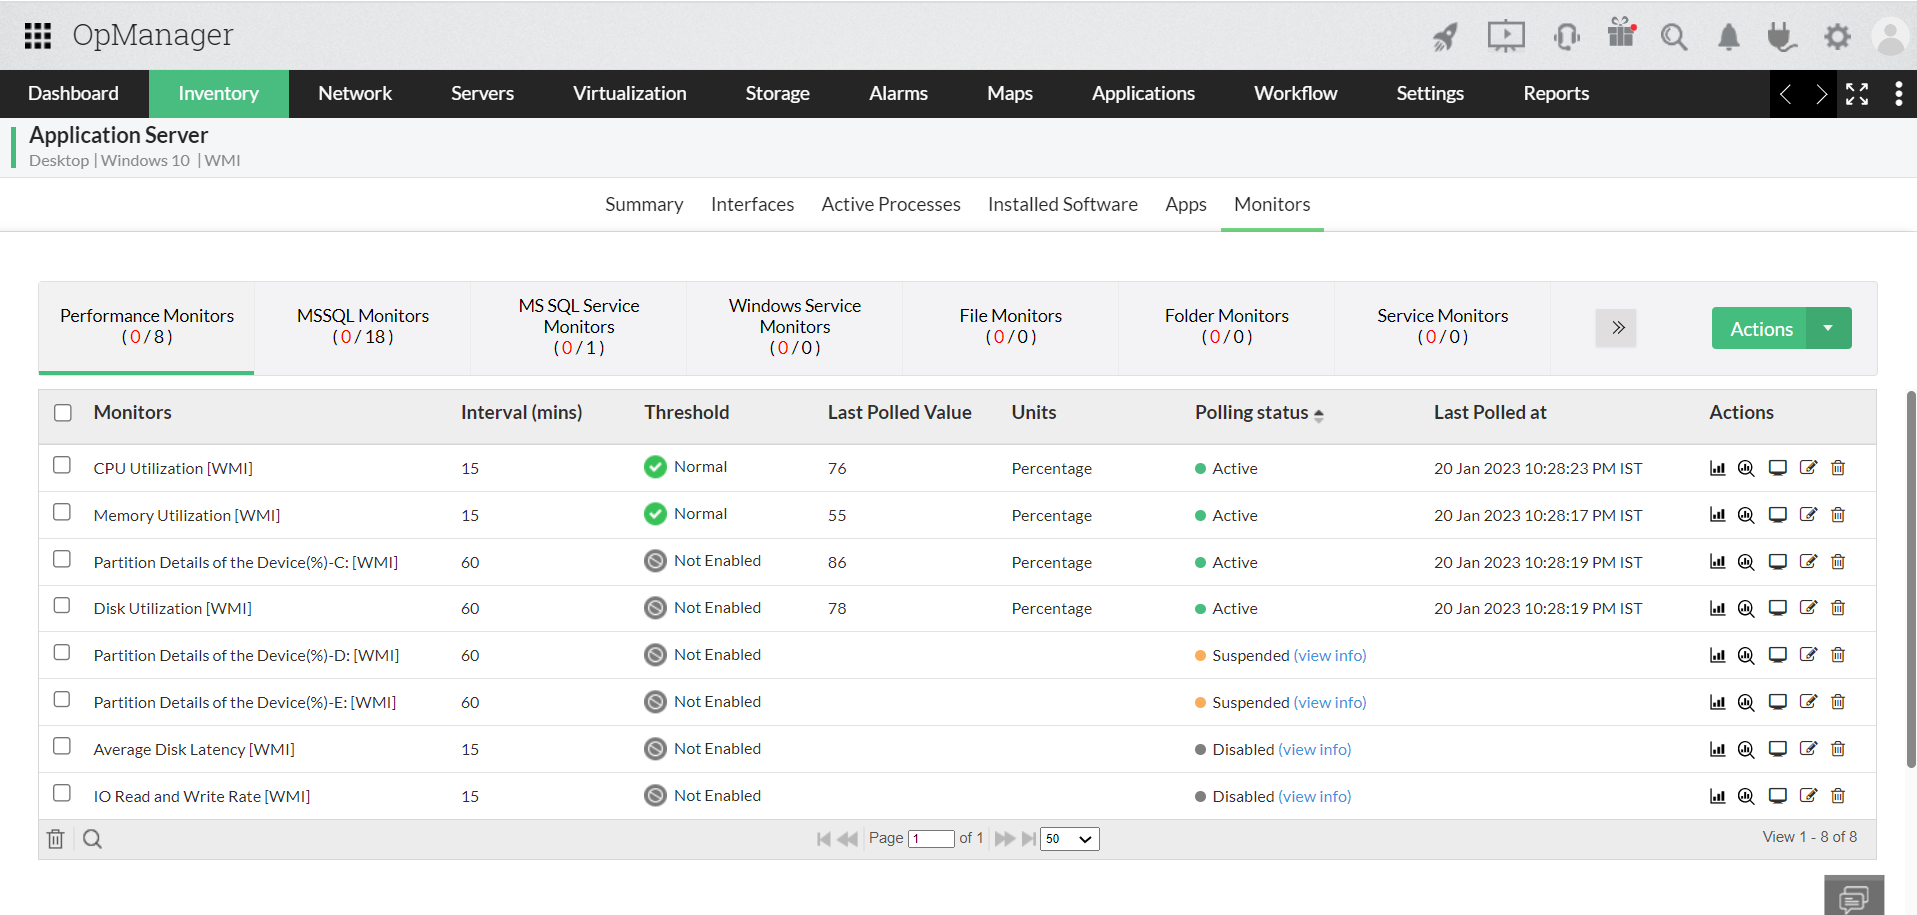
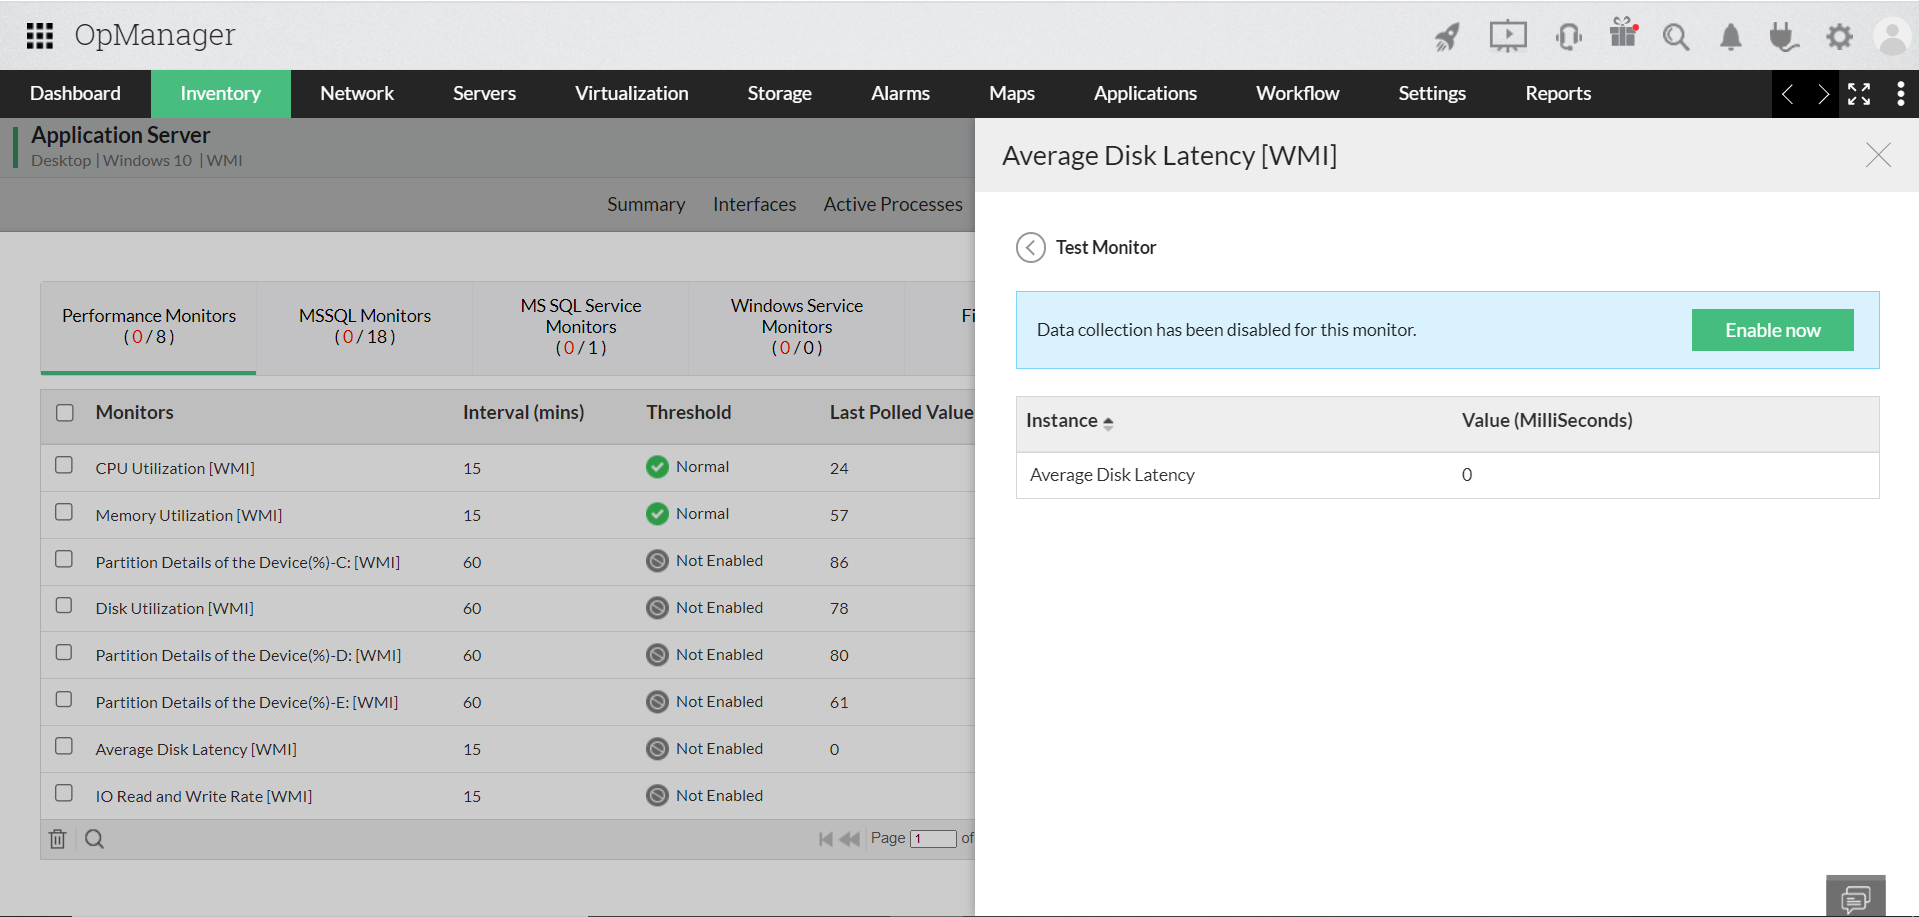
Now, under the "Monitors" tab, Users can also view the polling status of individual monitors under the Polling status column.
On clicking the "view info" option, the following window appears.
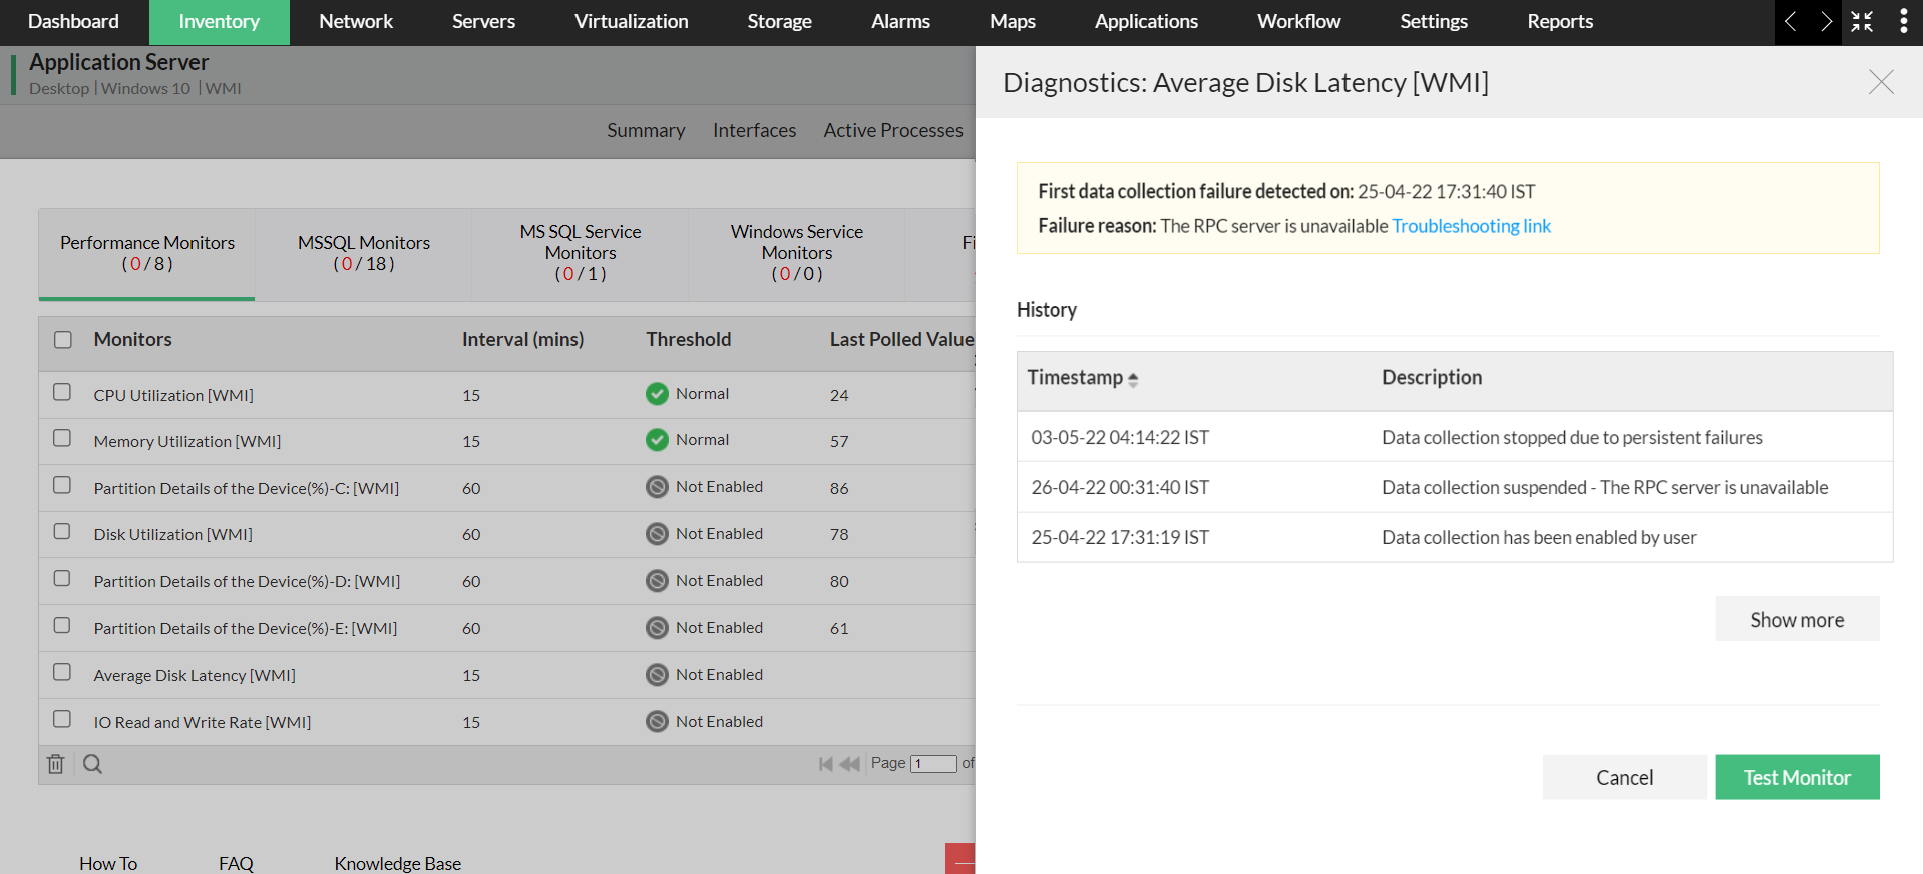
If the monitor successfully collected the data during the Test Monitor action, then the monitor will resume its active state if it was in suspended state previously. If it was in disabled state, then the Enable now option will be shown.
Configuring Data Collection Manager
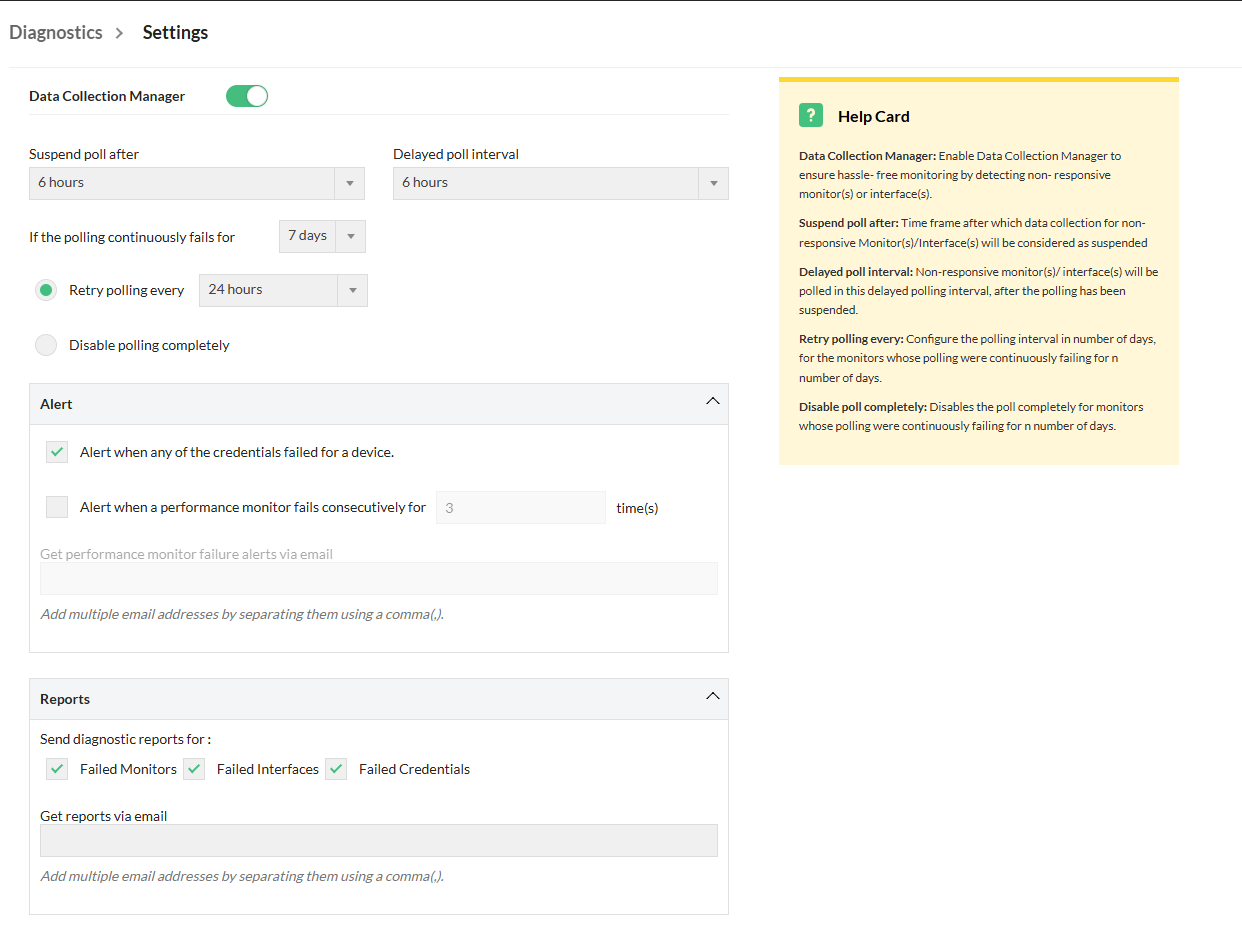
The DCM Settings screen consists of the following fields that can be configured by the users:
- Suspend poll after: This is the period after which the monitor will be moved from the Normal state to the Delayed Polling state once issues in data collection are detected. The default value is 6 hours, and it can be configured between 3 to 12 hours.
- Delayed poll interval: Monitors moved to the Delayed Polling state will be polled at this interval. The default value is 6 hours, and users can configure it between 3 to 12 hours.
- Retry polling every: Retries polling at the configured poll interval after the specified number of days, instead of permanently disabling the non-responsive monitor(s) or interface(s). The default value is 24 hours, and it can be configured between 12 hours to 7 days.
- Disable polling completely: This is the period after which polling will be permanently disabled for the monitor if failures persist. The default value is 7 days, and users can configure it between 3 to 7 days.
- Alert when any of the credentials failed for a device: Users can enable alerts for failed credentials under the Alert section in the DCM settings.
- Alert when a performance monitor fails consecutively for: Users can enable alerts for failed monitors when polling fails consecutively for the configured number of times.
- Get performance monitor failure alerts via email: Email address to which the failure notifications will be sent. Users can add multiple email addresses for alerts, separated by commas.
- Reports: Enables you to select the categories for which you want to receive reports. You can choose to receive a combination of any of the three categories: Failed Monitors, Failed Interfaces and Failed Credentials.
- Get reports via email: Email address to which the diagnostics report will be sent. Users can add multiple email addresses, separated by commas.
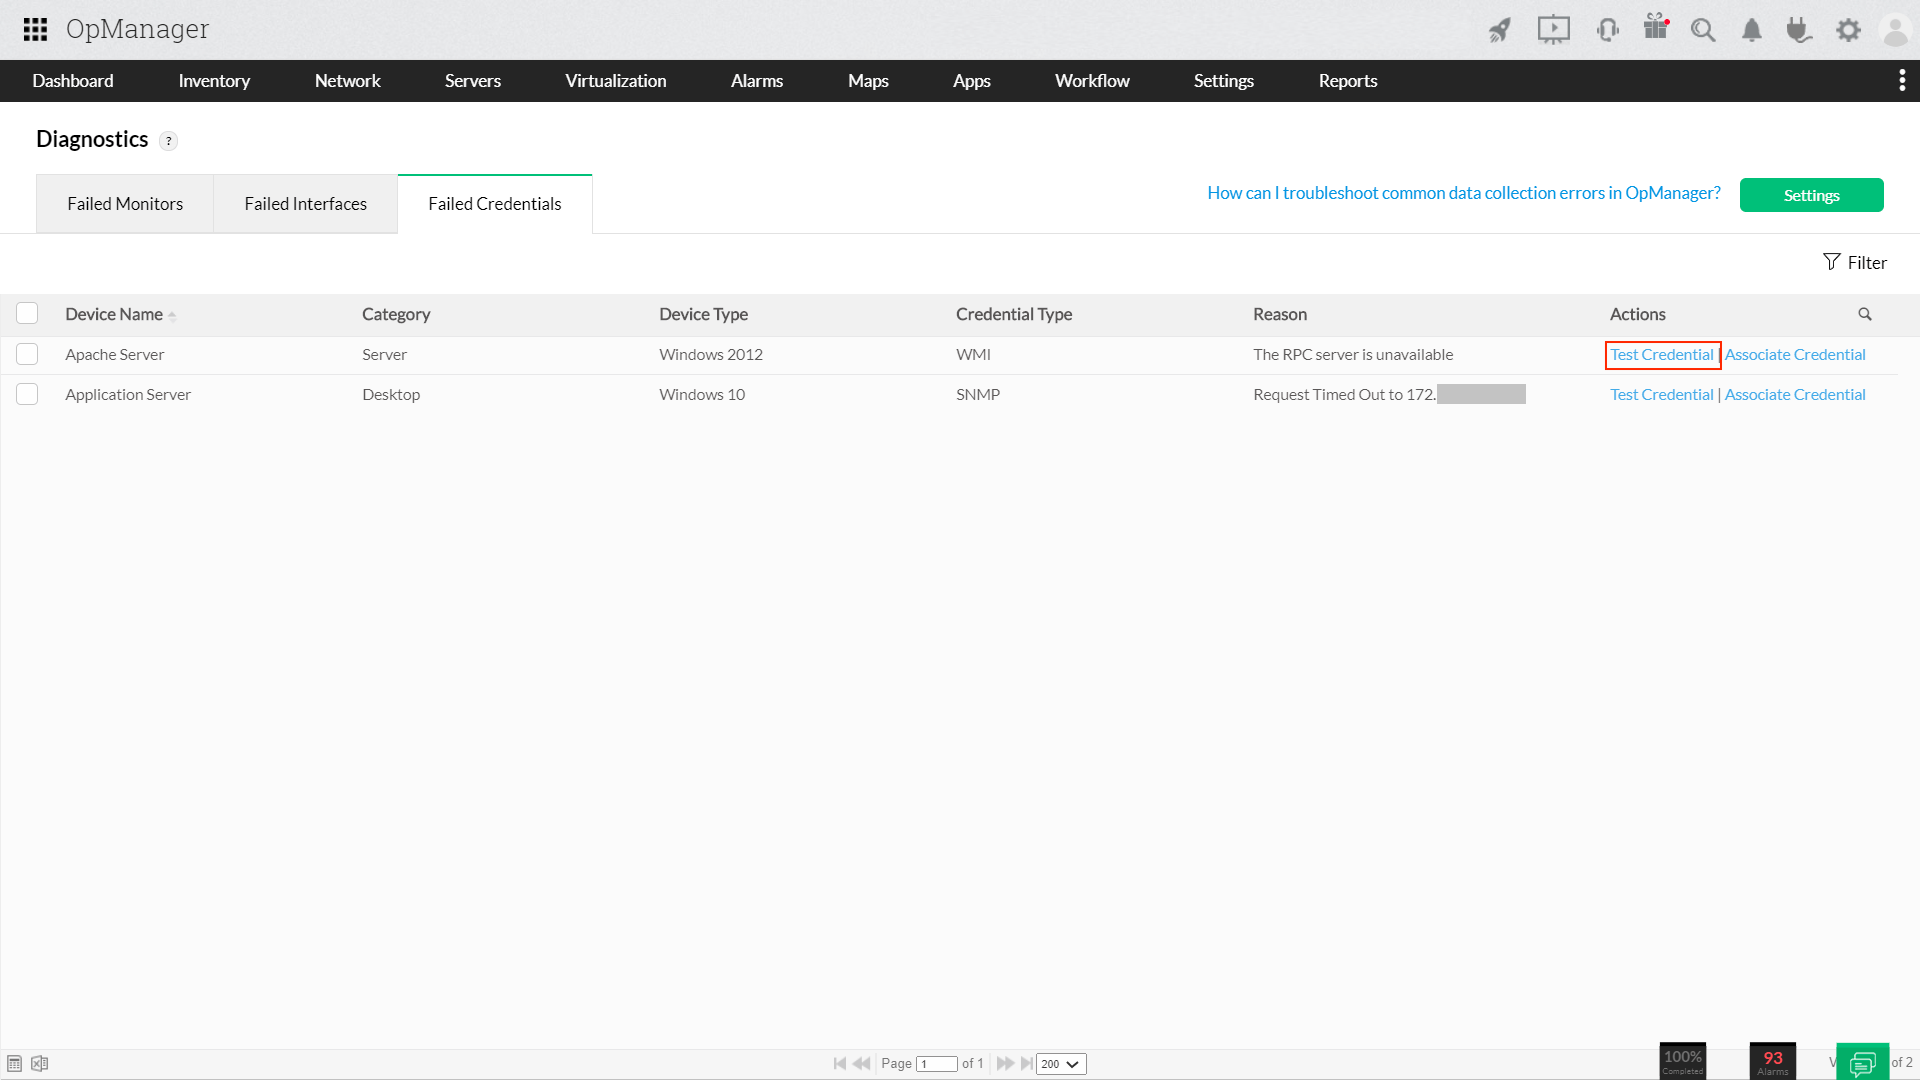
Test Credential actions in Data Collection Manager
The active credential profiles of every device are tested once every 24 hours. This is to ensure data collection issues do not arise because of incorrect/invalid credentials. If there are credentials of multiple protocols (SNMP, WMI, CLI and so on) for the same device, all the profiles are tested and only the profiles with issues are displayed in the Diagnostics page. Data collection based on all other protocols is carried on as usual.
This is an automated action in OpManager, but you can also manually test a failed credential by clicking on the "Test Credential" button next to the failed credential of your choice from Support → Diagnostics → Failed Credentials page.
Data Collection Audit
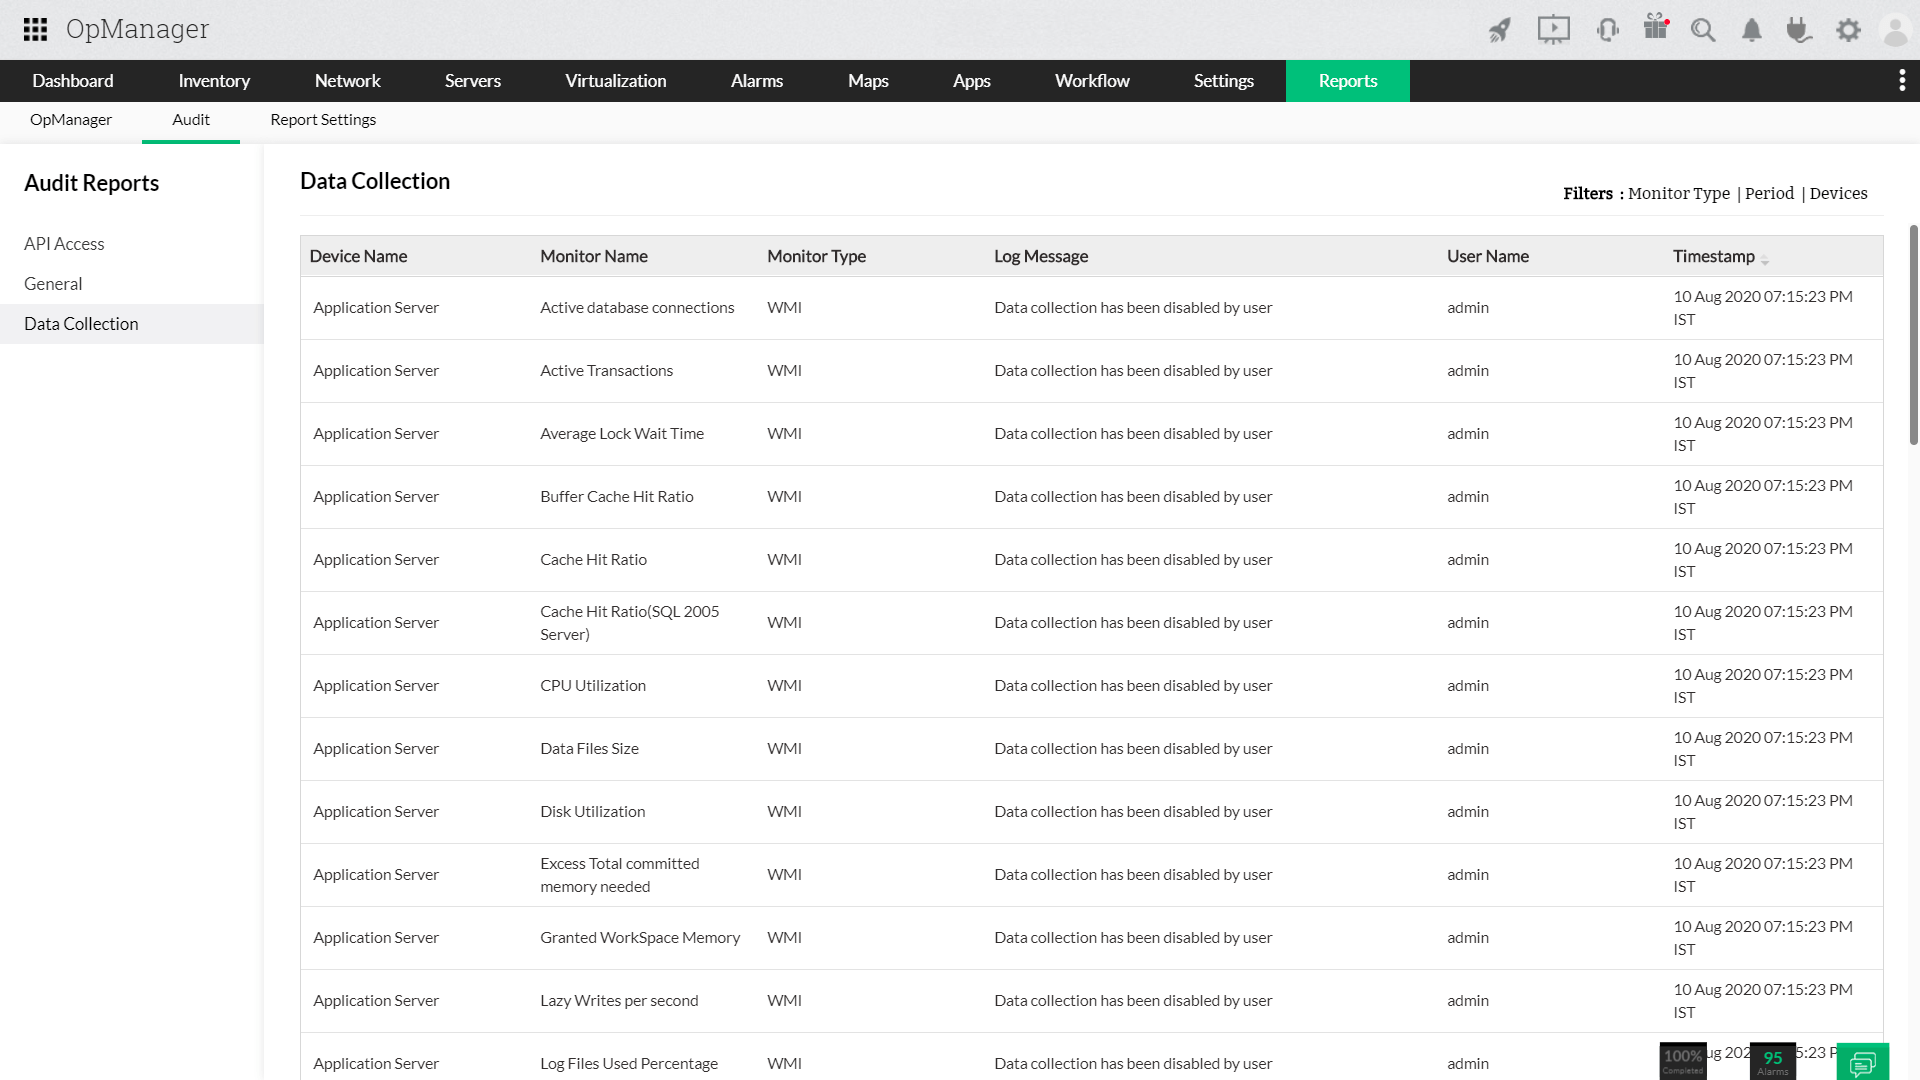
A dedicated Audit page is also available for the Data Collection Manager module, under Settings → Reports → Audit → Data Collection. All events regarding data collection management and diagnostics will be logged under this page, and is available for the user to verify any detail related to data collection in general. This page also has filters to enable the user to filter messages based on Monitor Type/Period/Devices.
How can I resolve data collection errors in OpManager?
If you have any issues with troubleshooting data collection issues, please check this page to know all possible data collection errors in OpManager and how it can be resolved. This link is available in the top right corner of the OpManager web console, as well as under the reasons column. Clicking on the link from the reasons column will take you to the relevant troubleshooting steps. Furthermore, this link will also be available under the interface and monitors tab of the respective device snapshot page.
Thank you for your feedback!