Network Path Analysis
OpManager's Network Path Analysis feature allows you to monitor the performance step-by-step across multiple routes between a source (either from the OpManager server or a remote server) and a destination. It helps visualize network routes from a probe to its destination and keeps a record of path history, aiding in identifying communication issues at each step of the journey.
OpManager generates detailed diagrams of TCP requests within the network, providing clear visualization of critical paths from the probe to its destination. Network Path Analysis is supported on Windows and Linux systems. It also identifies and tracks each hop in the path, measures the time taken by data packets at each hop, and provides insights to assess packet transit delays and network outages effectively.
This help page contains the steps to configure the following,
Steps to create a new Network Path Monitor:
You can create network path from OpManager installed local server to a destination, or from an agent installed remote machine to a destination.
To create a new network path in OpManager from local machine,
- Go to Settings -> Monitoring -> Network Path Analysis.
- Click on the 'Create New Path' option on the top right.
- Select Source from as a Local machine.
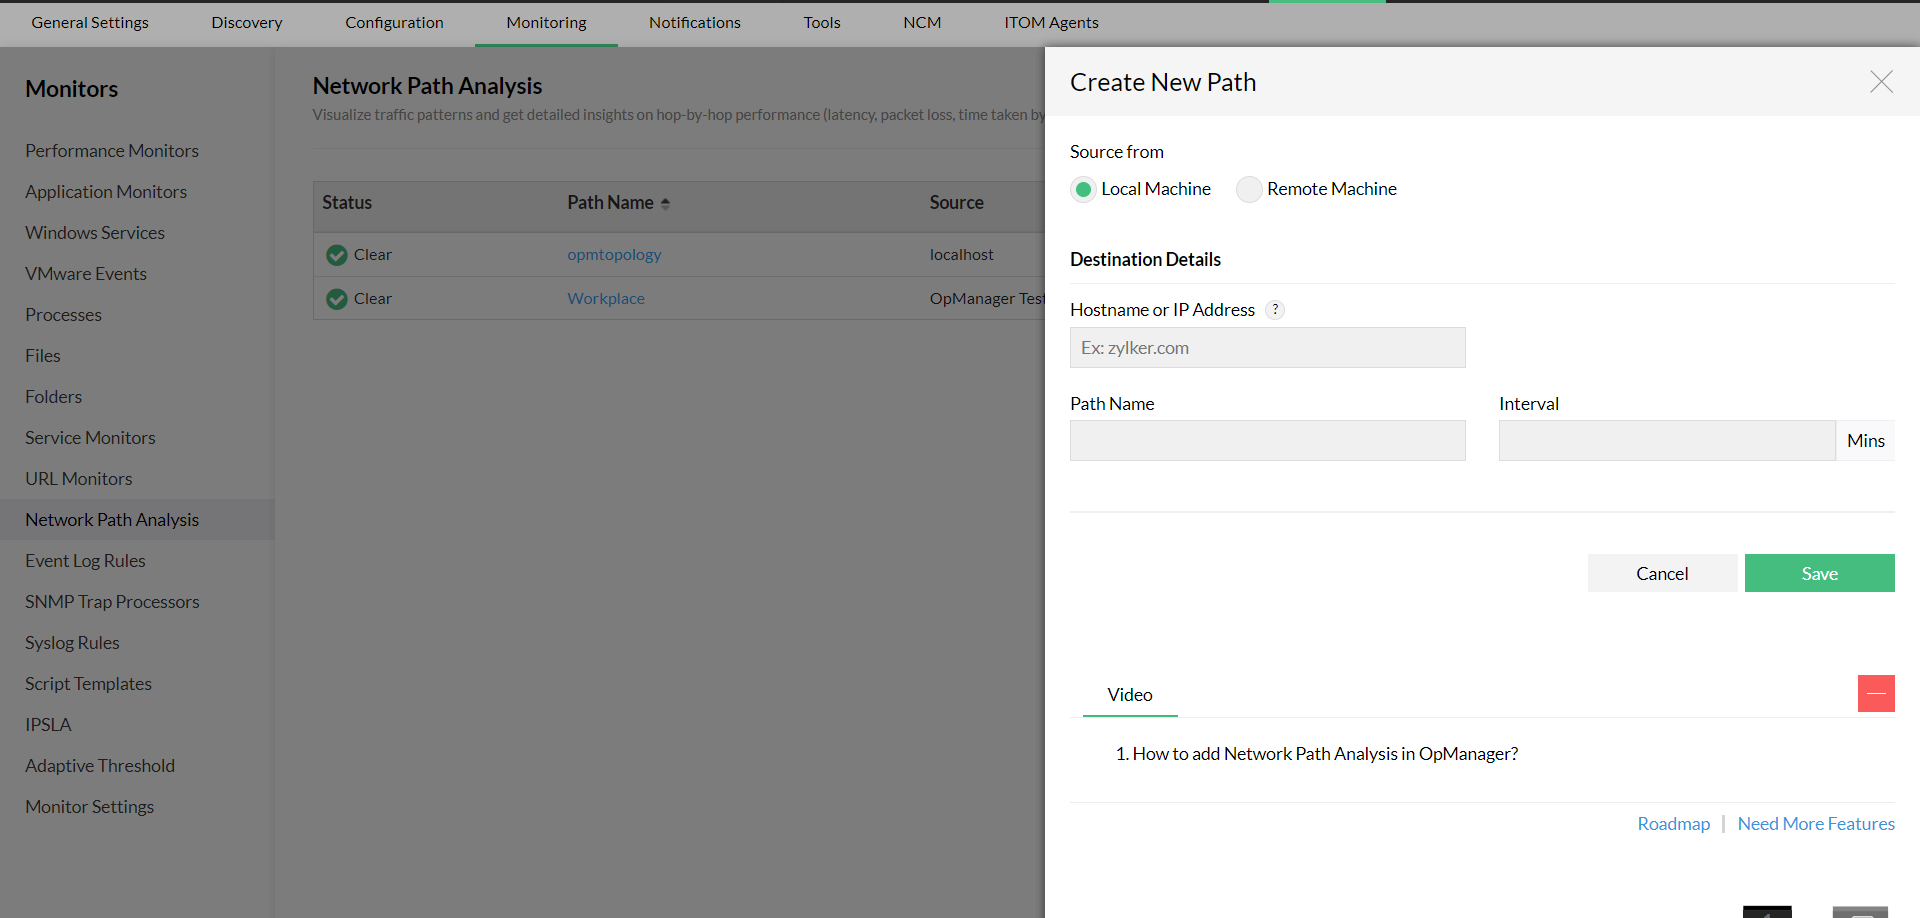
- Enter the hostname or IP address with other details such as path name, port, and time interval.
- Click on Save once the details are entered.
To create a new network path in OpManager from Remote machine, you might require an agent installed in the specified machine. Follow the steps here to deploy an agent. After deploying the agent,
- Go to Settings -> Monitoring -> Network Path Analysis.
- Click on the 'Create New Path' option on the top right.
- Select the Source from as a Remote machine.
- Select the agent deployed devices from the source dropdown.
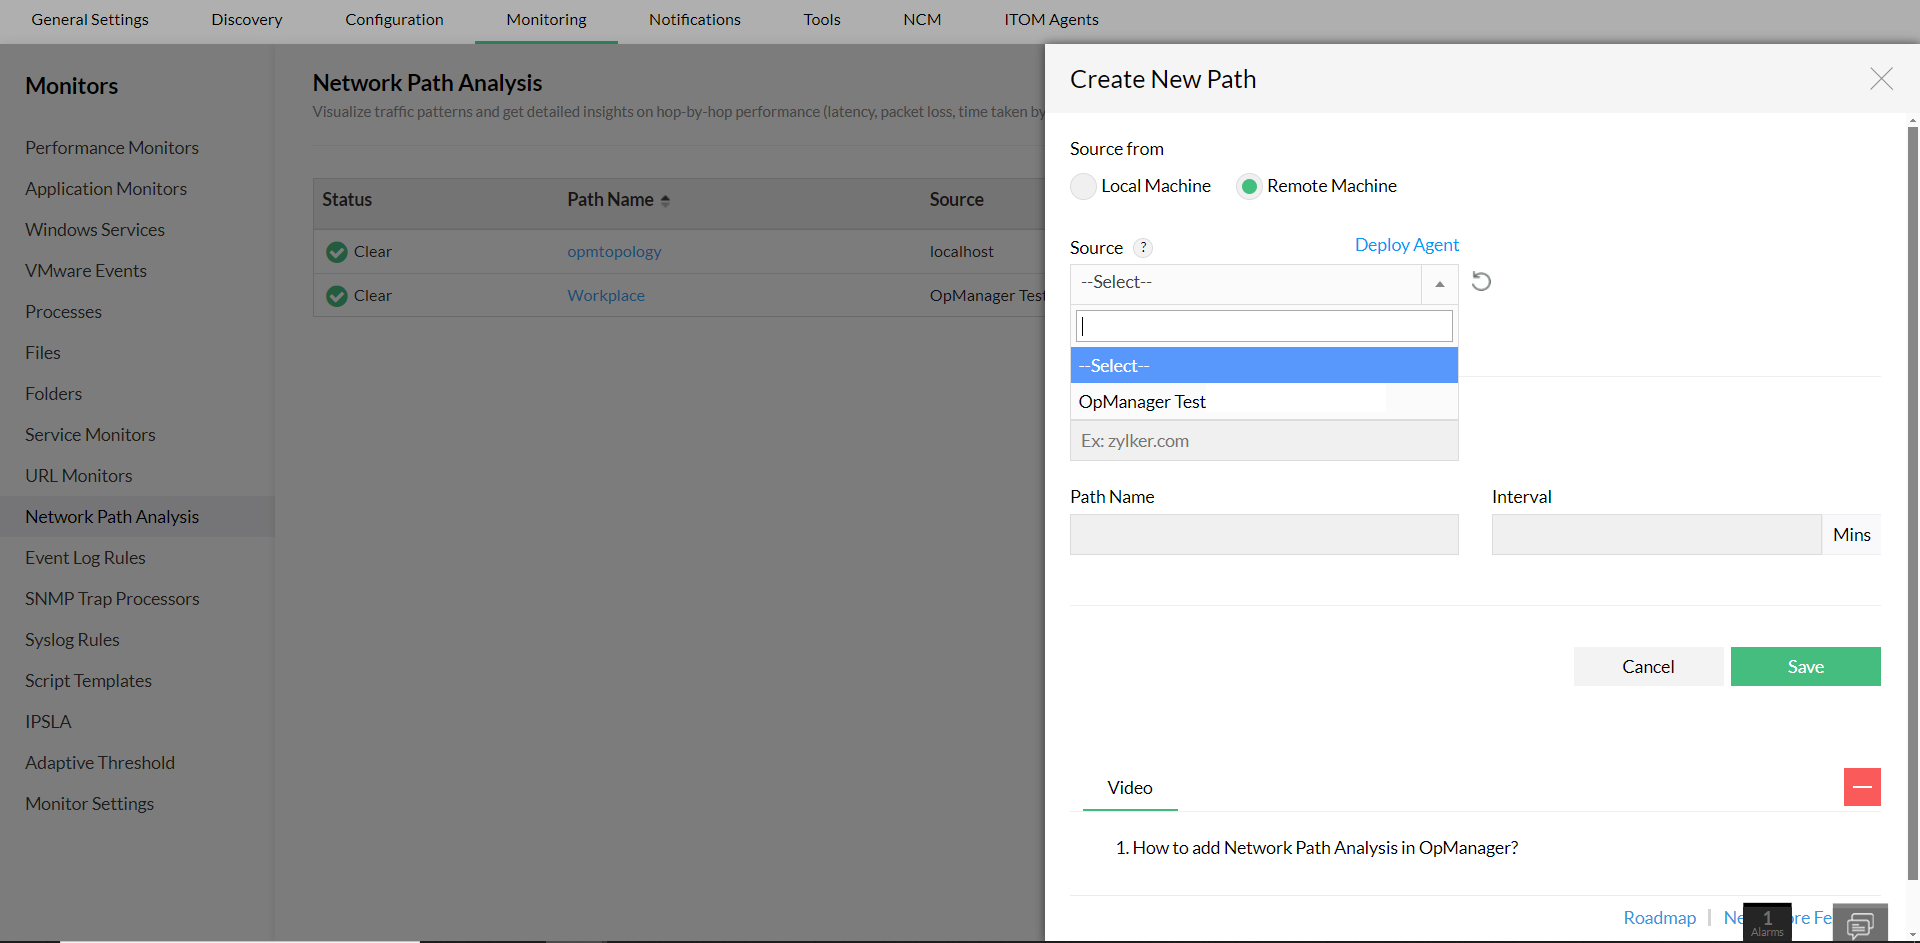
- Enter the hostname or IP address with other details such as path name, port, and time interval.
- Click on Save once the details are entered.
The created network paths will be listed under the Network Path Analysis tab. You can hover over the graphs that are plotted to view the latency and packet loss between two hops in a path graph, or hover over the links between the source and that particular hop, to view the latency and packet loss between two hops.
Note:
On Windows, the tracing utility used for Network Path Analysis depends on whether the path is monitored from the OpManager server or from a remote host.
- Local Machine: When the network path is monitored from the OpManager server, OpManager uses TraceTCP to trace the route and measure latency and packet loss.
-
Remote Machine:
When the network path is monitored from a remote machine, OpManager uses Tracert by default. Tracert uses the ICMP protocol, so port numbers cannot be specified. To use TraceTCP, Npcap must be installed. If you want to use TraceTCP for Network Path Analysis from a remote machine, please contact OpManager Support for assistance.
Steps to configure thresholds:
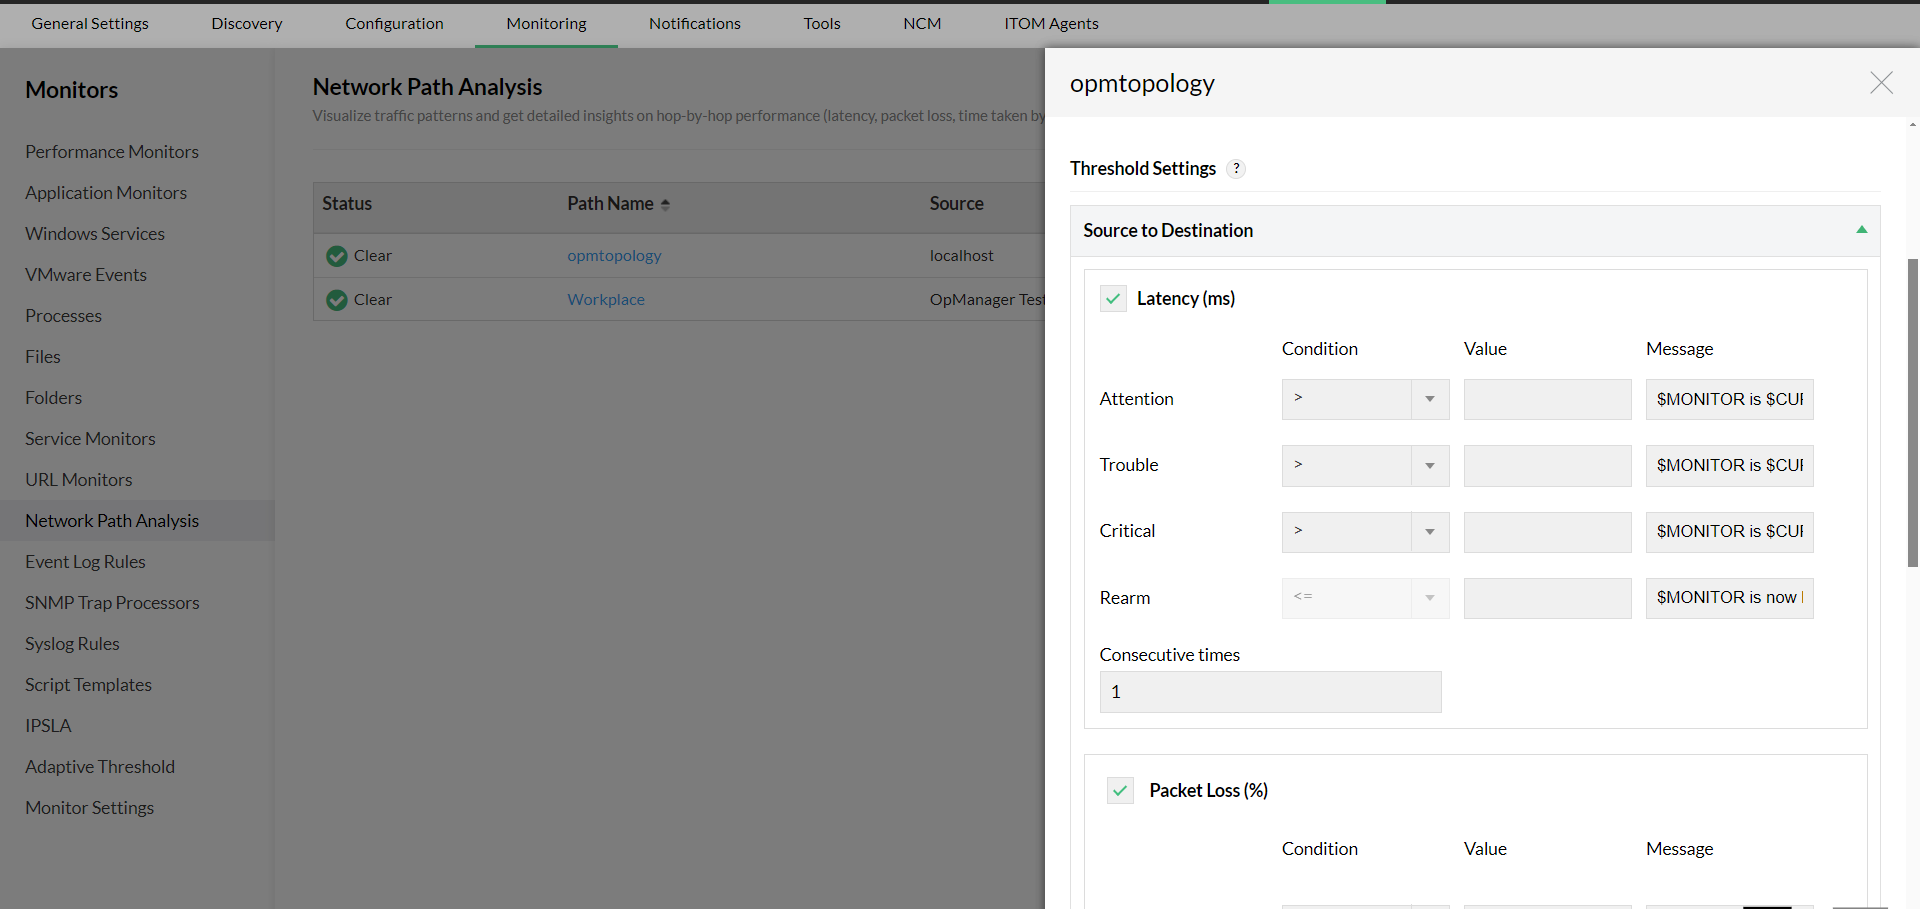
After creating a network path, you can set thresholds for latency and packet loss, so that OpManager will alert you when these thresholds are violated. You can set thresholds for latency and packet loss between a source and destination, or between hops, or both.
- Go to Settings -> Monitoring -> Network Path Analysis.

- Click the edit icon on a created network path, scroll down to the Threshold Settings section.
- Under Source to Destination, enable Latency and Packet loss, and set the thresholds for Attention, critical, and trouble.
- Under Hop to Hop, enable Latency and Packet loss, and set the thresholds for Attention, critical, and trouble.
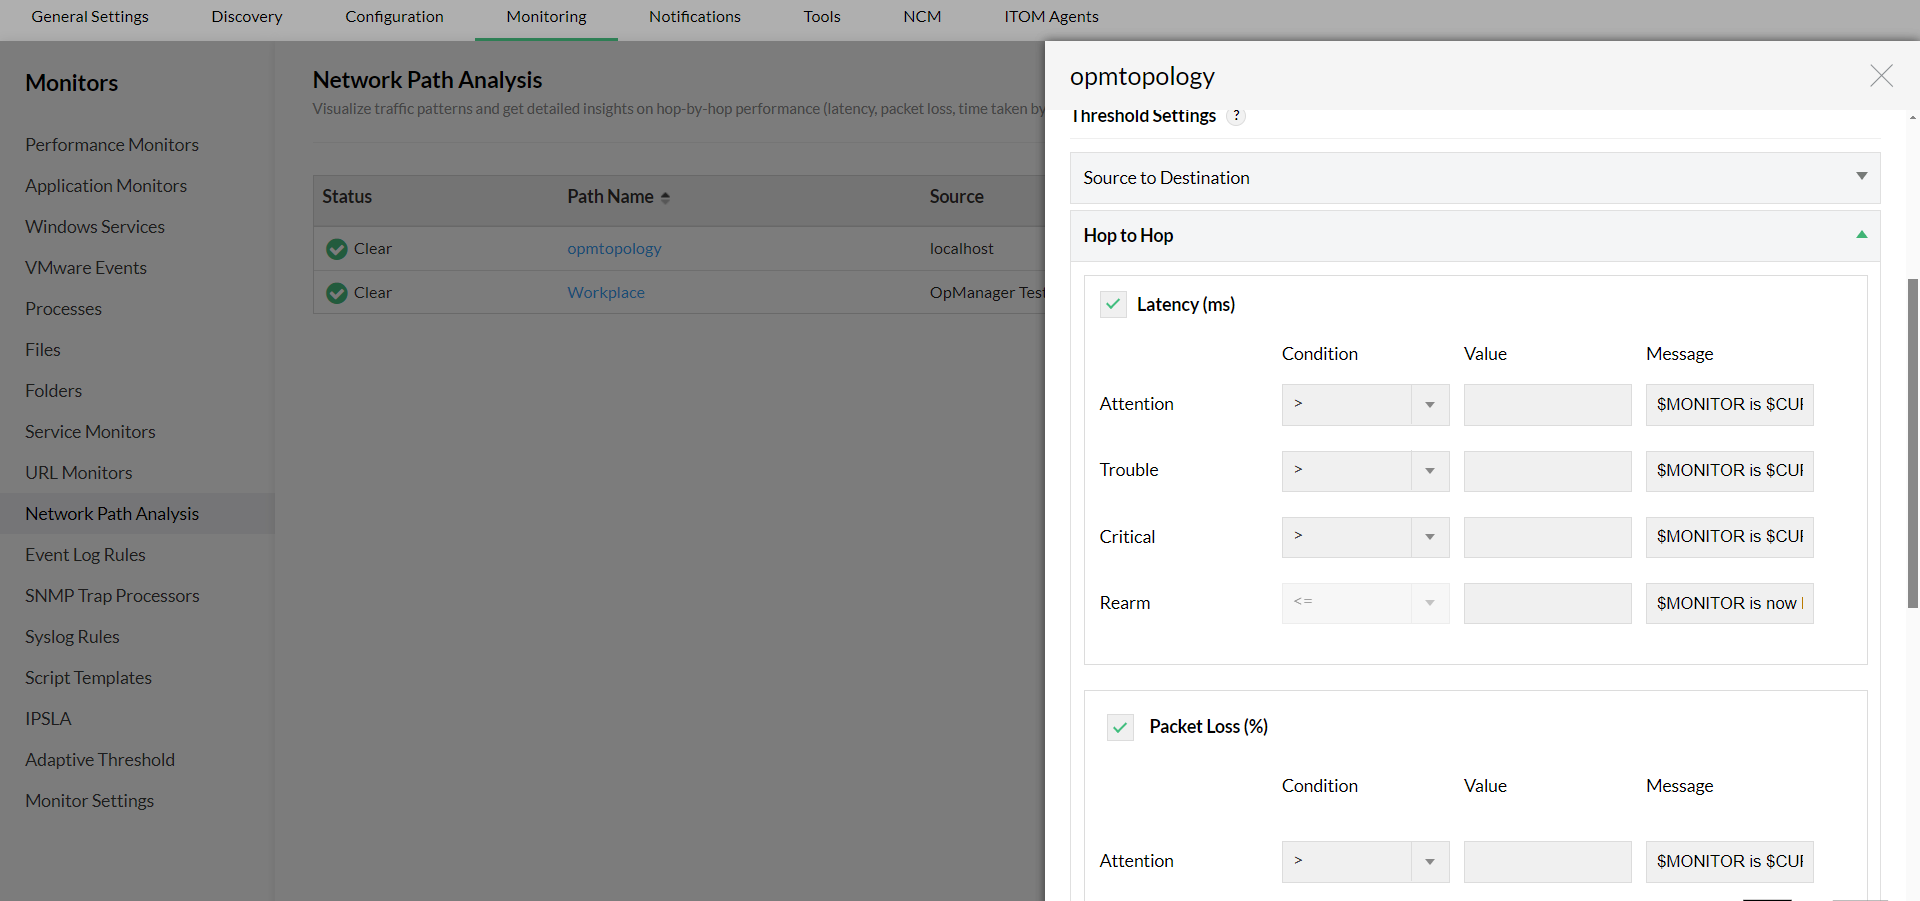
- Click on Save and exit the edit page once the values are entered.
View Path graphs
In the Path history section, you can view the path graph for a particular latency or packet loss value or for a particular date.
To view path graphs for a network path,
- Go to the snapshot page of a network path from Settings -> Monitoring -> Network Path Analysis and scroll down to the 'Path History' section.
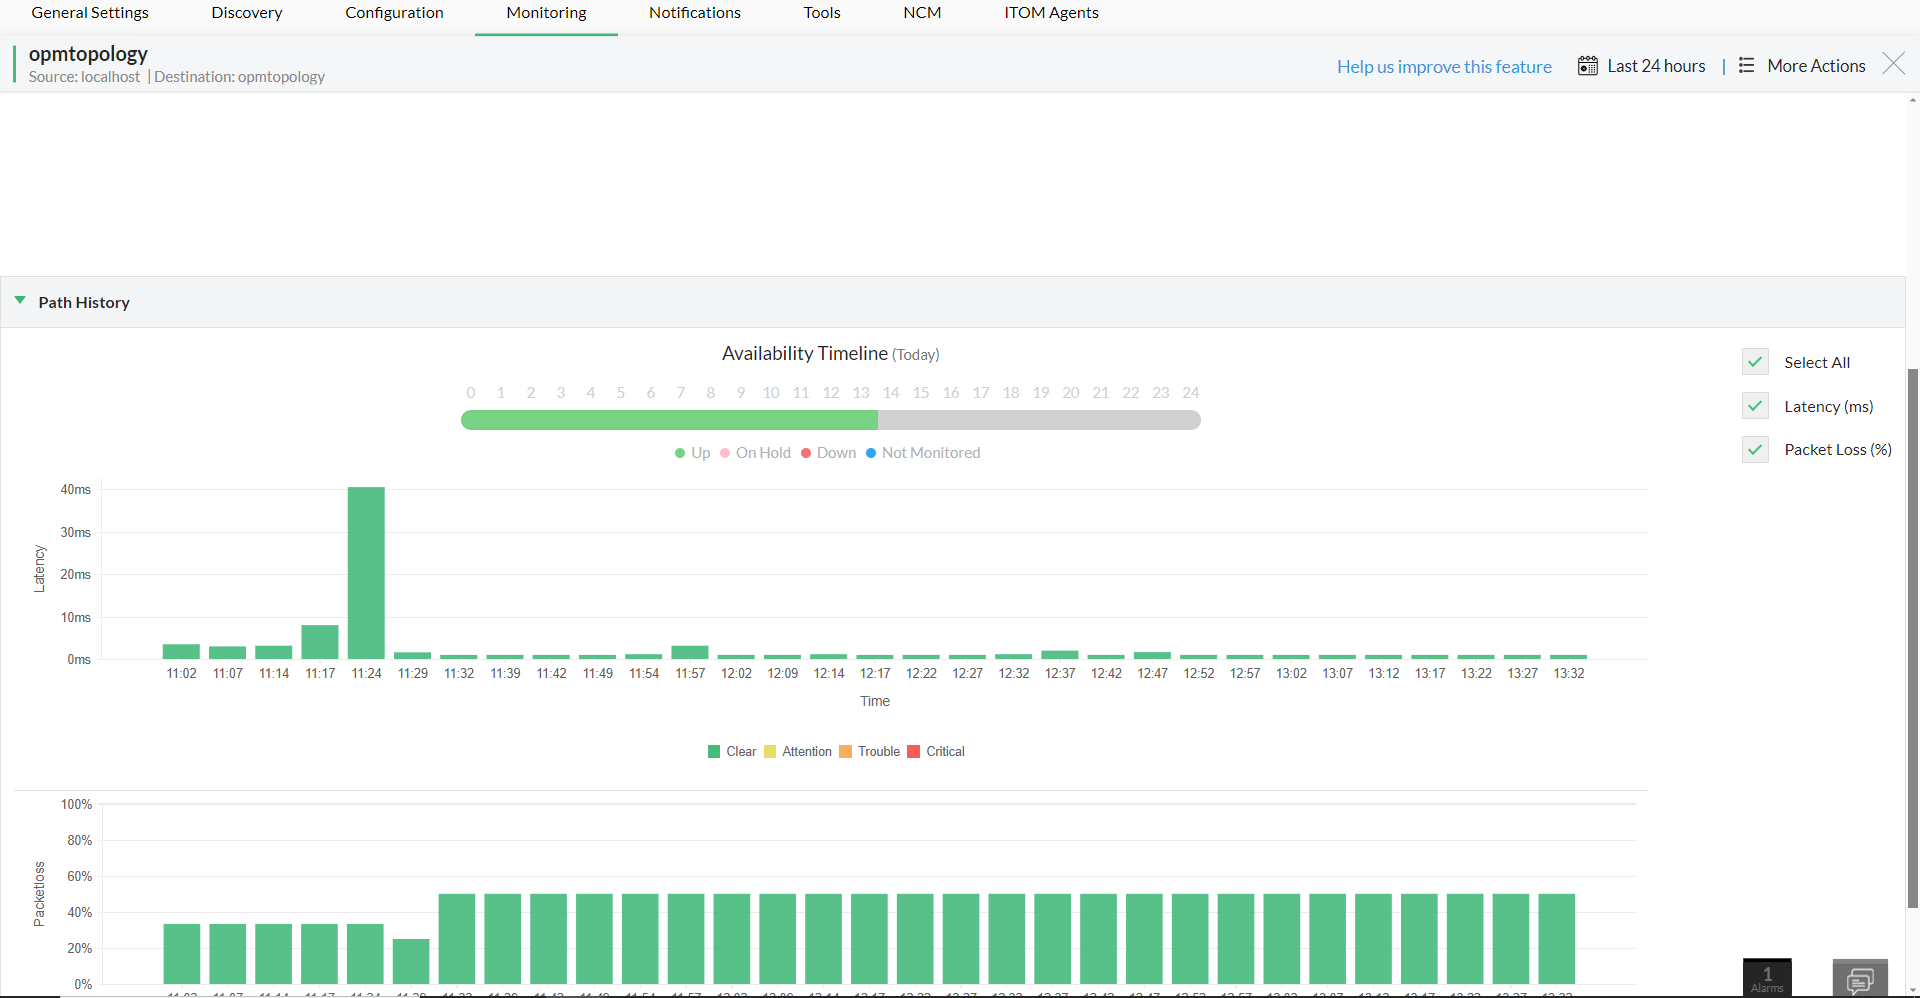
- Tick the necessary checkbox (Latency, Packet loss or Select all) to view the path graph for a particular latency or packet loss.
- Click on the calendar icon on the top right, and select the Custom option.
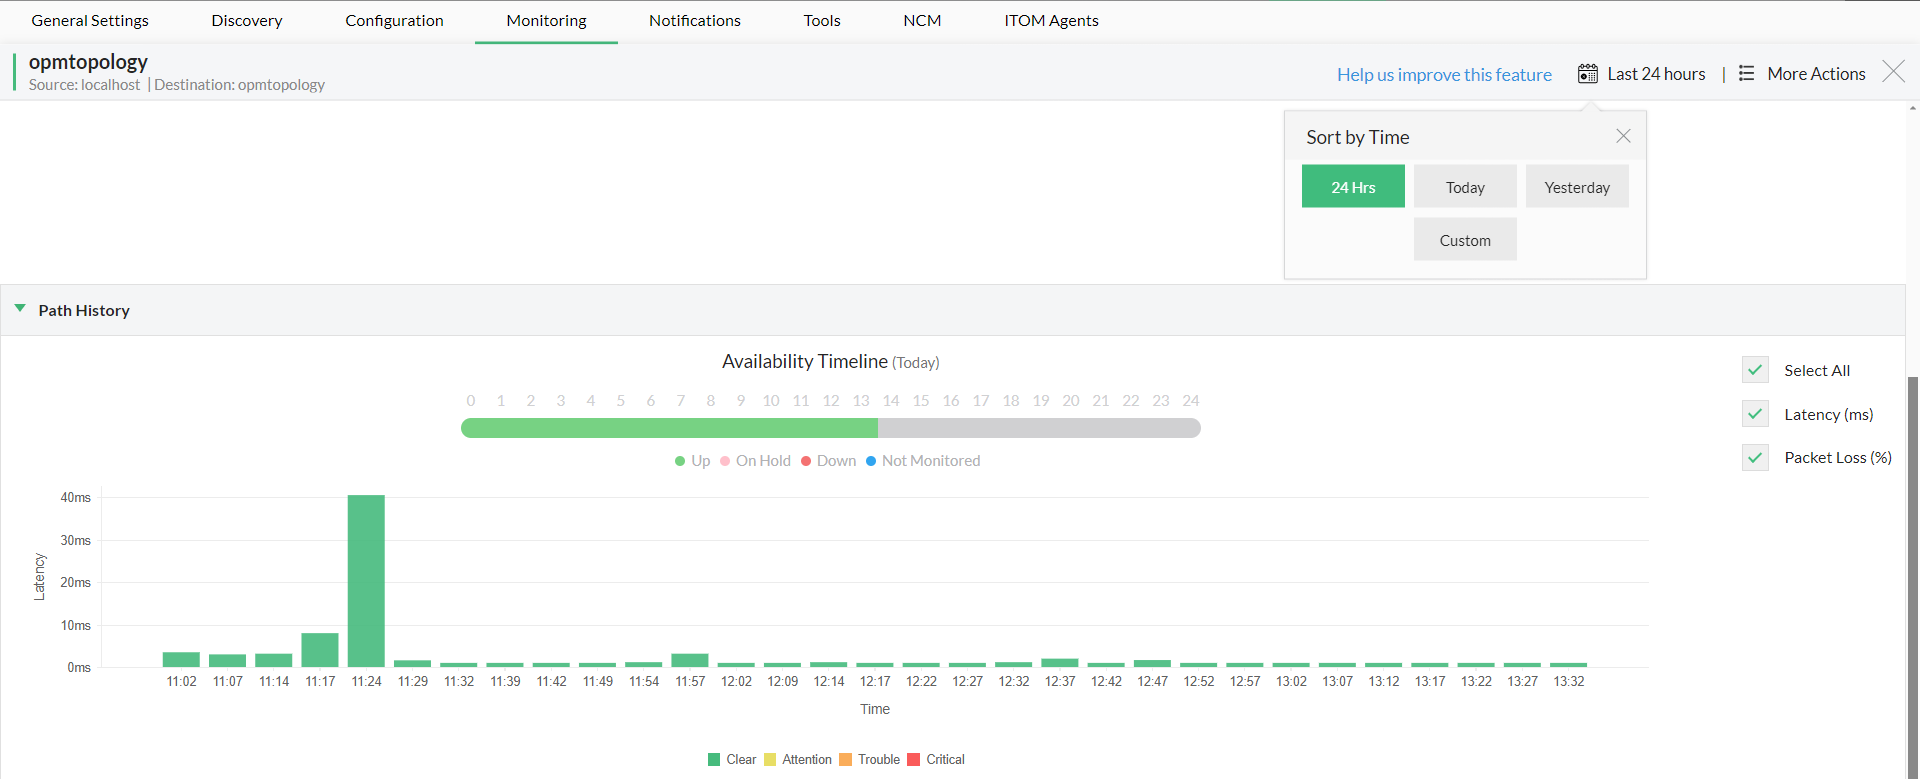
- Select a date, to view the graphs with the last collected value on that date.
Associating notification profiles
You can associate a network path to a notification profile, to manage your alerts on time,
- Go to Settings -> Monitoring -> Network Path Analysis.
- Click on the Edit option on the corresponding network path created and scroll down to the Associate Notification Profile section.
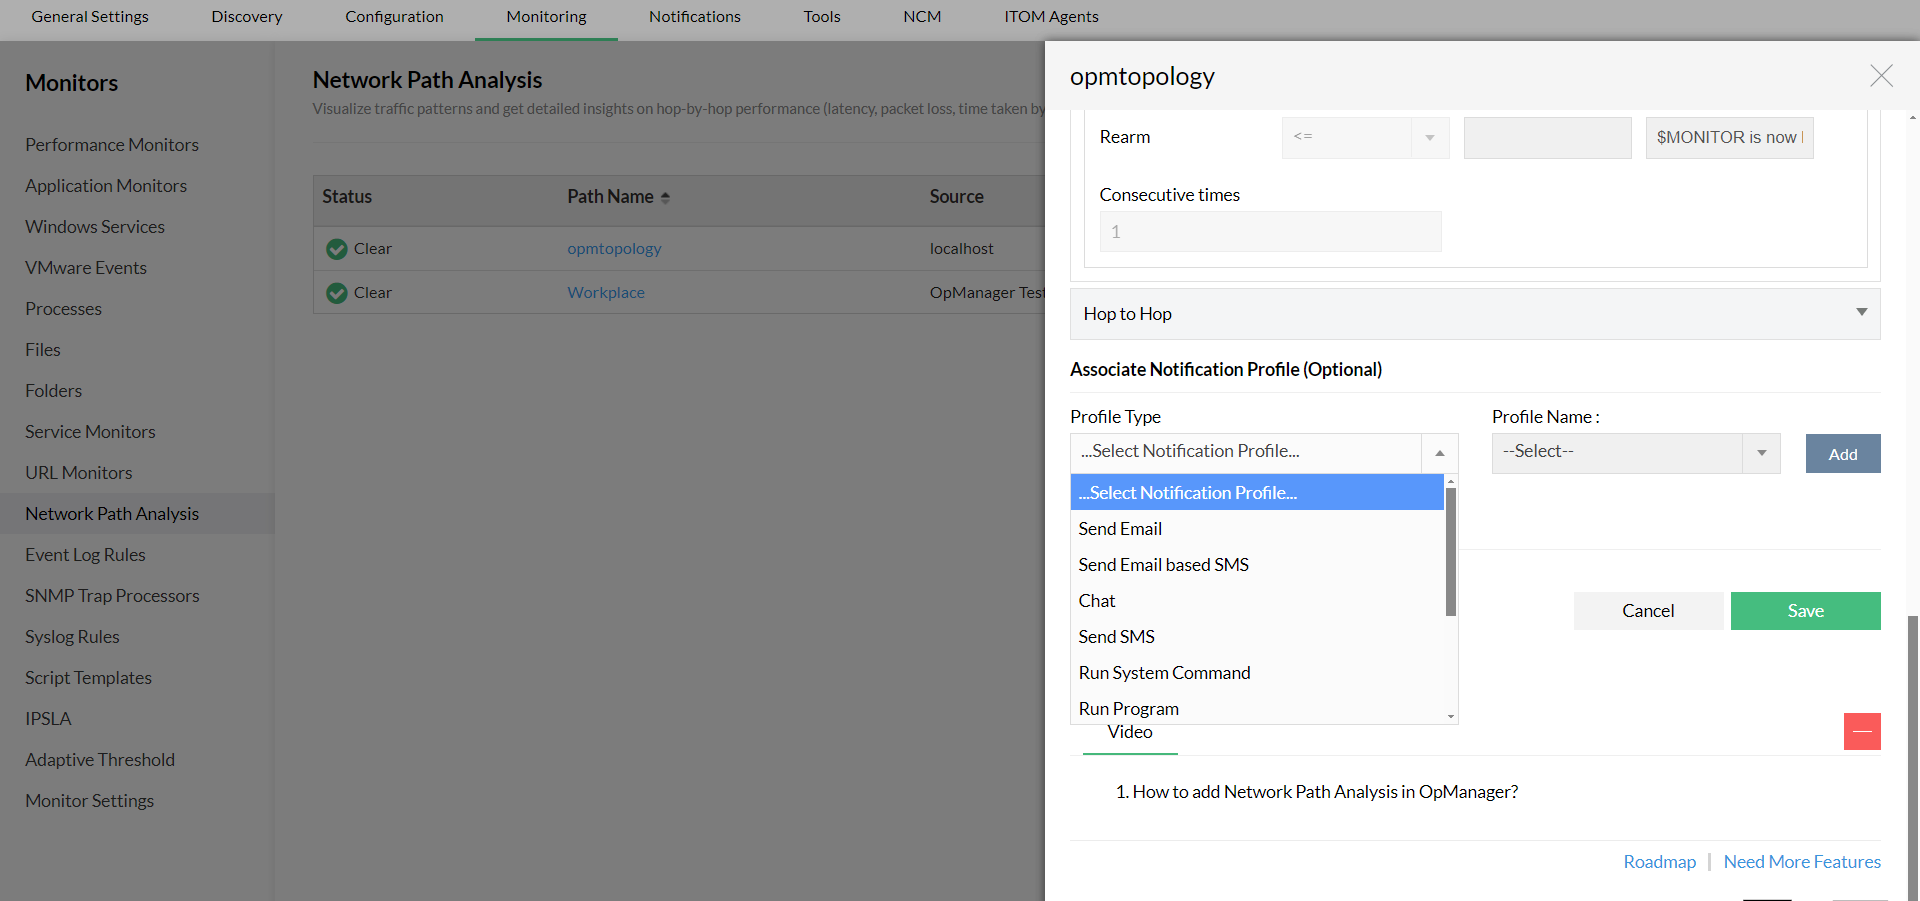
- Select a notification profile type, profile name and associate that profile to the selected network path by clicking on 'Add'. Click save.
The configured notification profile will be associated with the network path.
Thank you for your feedback!