Citrix Xen helps you monitor and manage your virtual infrastructure. By discovering Xen devices in OpManager, users can continually monitor the VMs for their optimum performance, and can also monitor the hardware health of the device on which the VMs are hosted.
Once the devices are discovered, they will be added to OpManager, under the virtualization tab. Go to "Virtualization -> Xen" to find your Xen server listed there. Click on the particular server, to open it's snapshot page.
OpManager's Xen monitoring feature shows the top hosts and VMs by resource utilization and the recent alarms raised. The Virtualization Dashboard page refreshes automatically every 5 minutes to reflect the latest collected statistics.
Listed below are a few of the various types of top resource utilization widgets that can help you to quickly identify any over utilized resource. These widgets give a quick glance on systems which are the top consumers of CPU, Memory, Network, Disk I/O and Disk Space and much more.
| Top VMs | Top Hosts |
|
|
A host's snapshot page offers useful information about the host such as the host's summary, status, associated interfaces, virtual details, and so on. Users can also associate monitors from the snapshot page.
In this section you can find the host details like IP Address, Vendor of Host, CPU Cores along with widgets for availability, packet loss, and response time. You can also associate the device to a workflow and notification profiles, and view the alarms escalated from this device. There are also custom dials for CPU utilization, Memory utilization, etc.

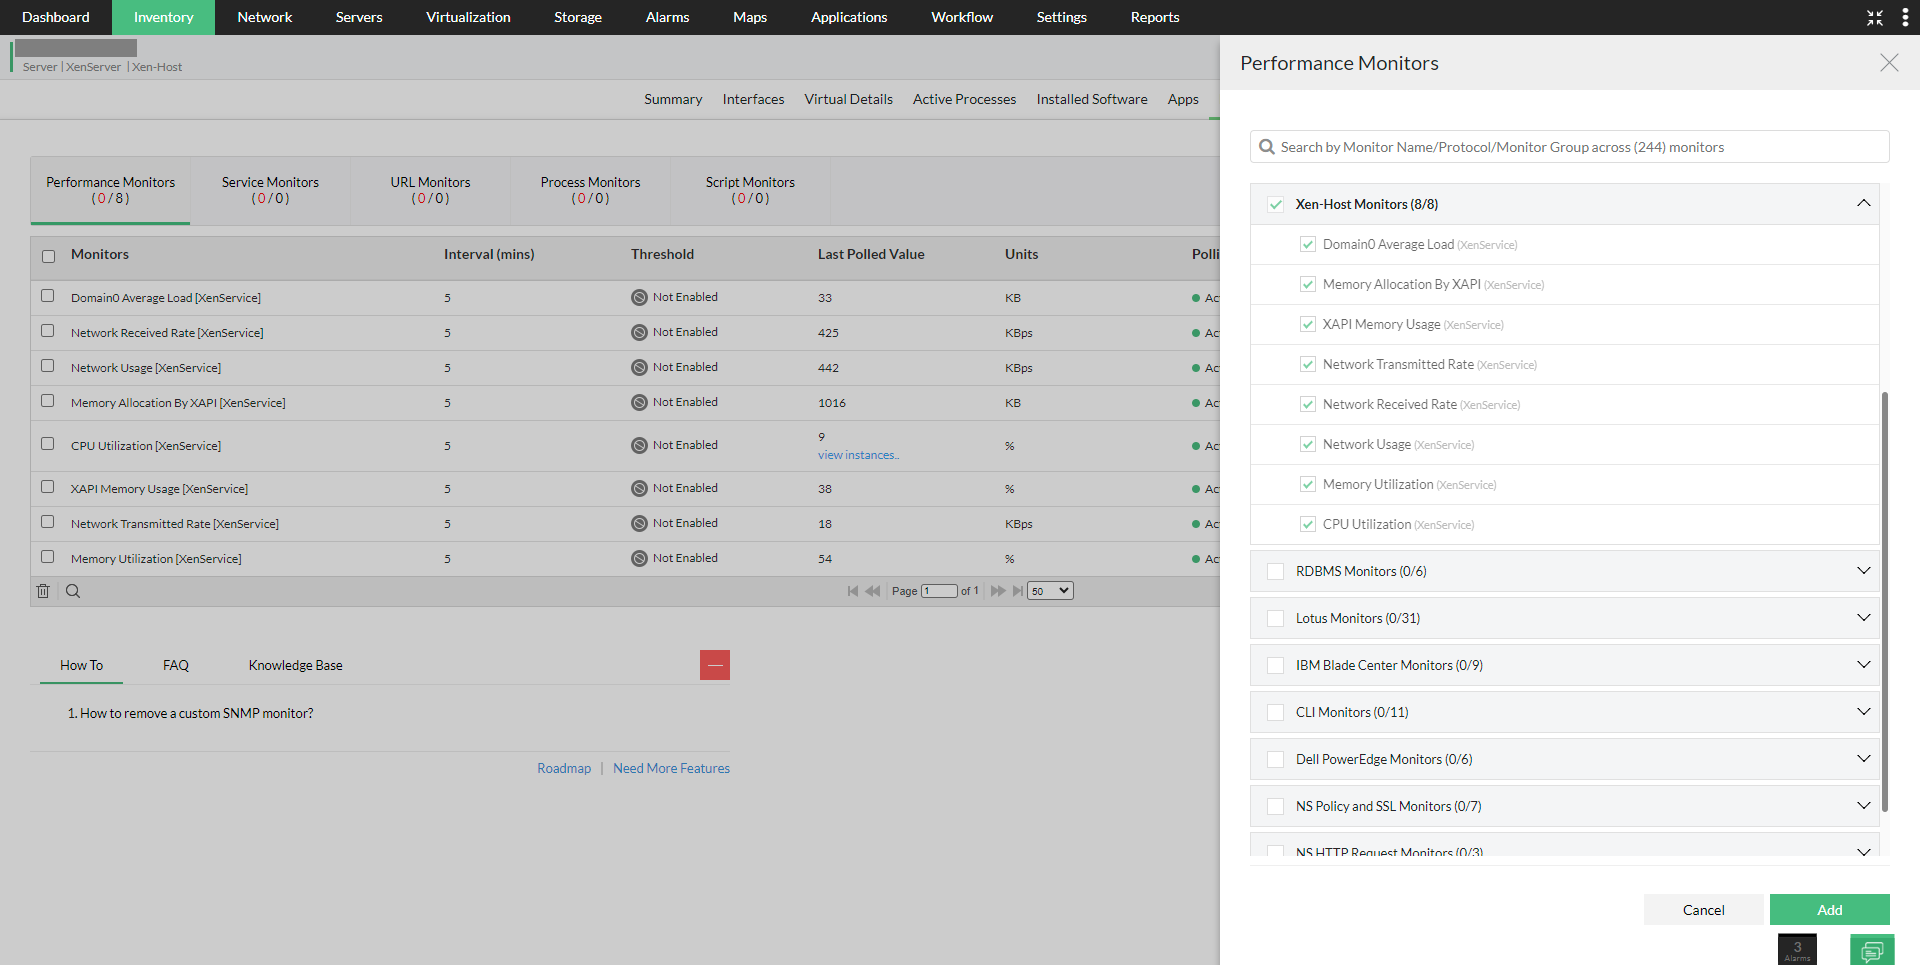
Under the "Monitors" tab in the snapshot page, users will be able to find all the monitors associated with the device. Users can also add new monitors from the device snapshot page. By adding host relevant monitors that monitors the host for its optimum performance, users can prevent their VMs from running into a network issue.

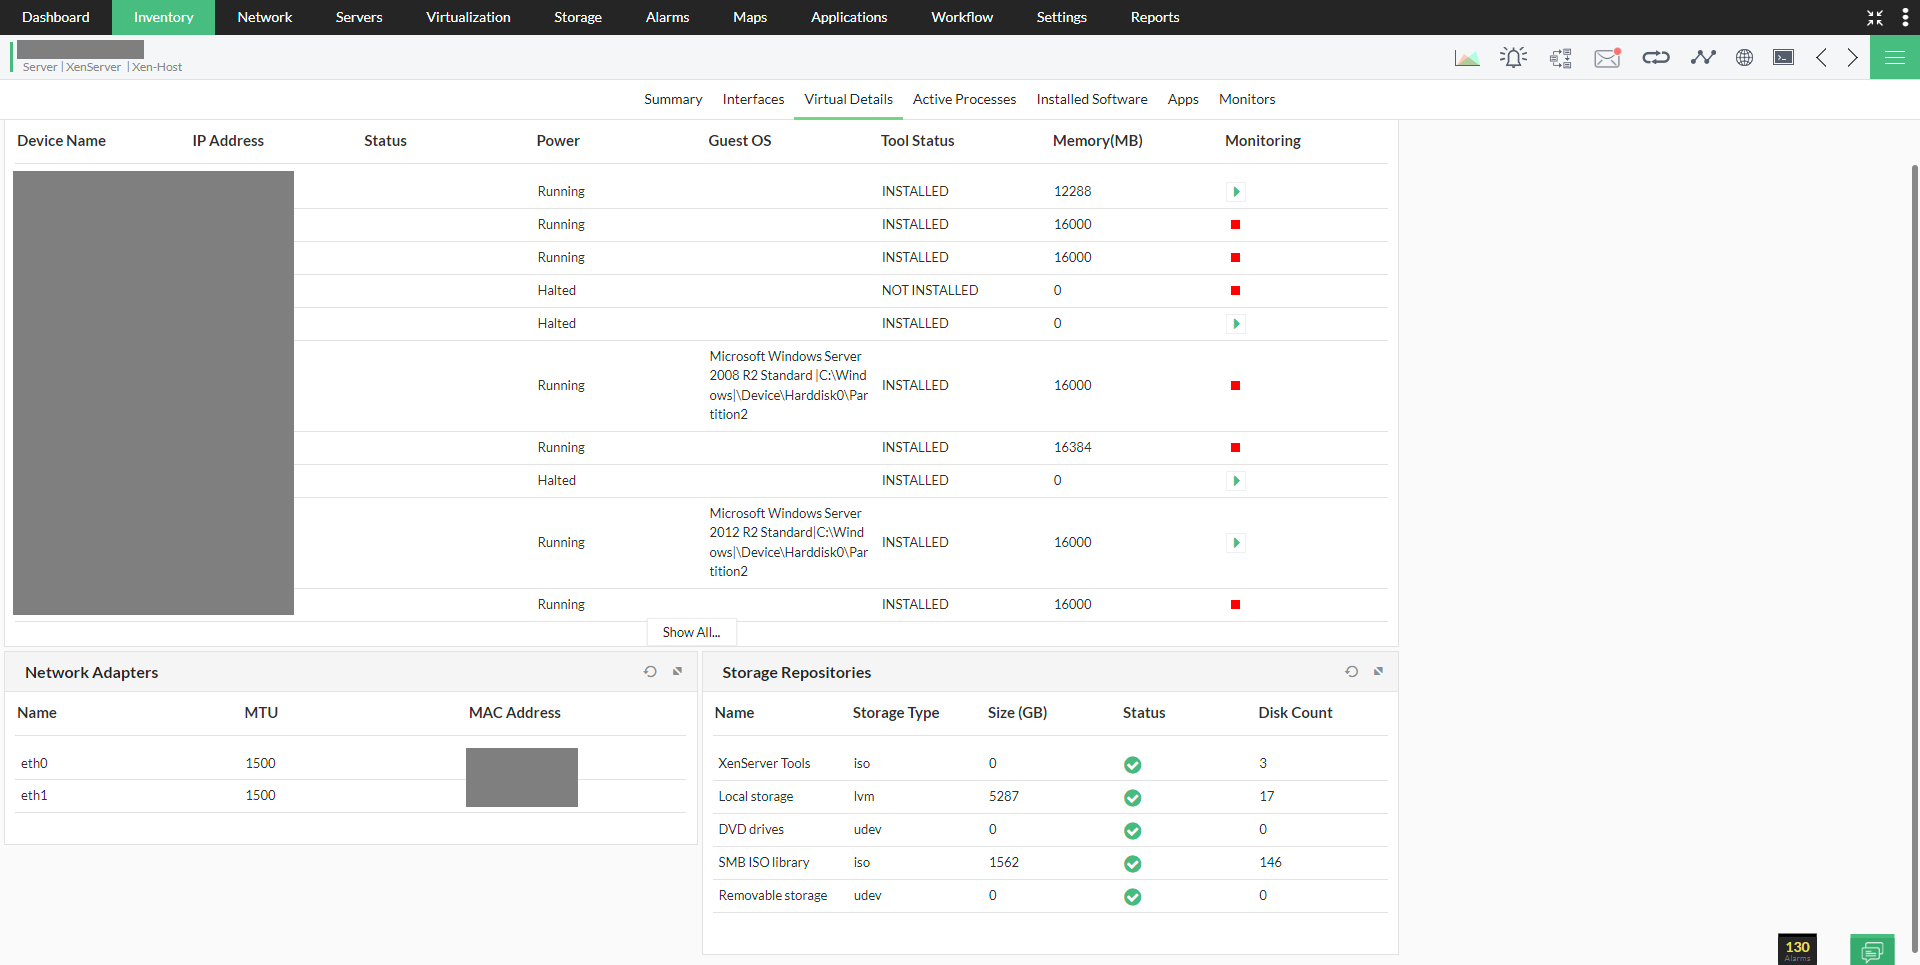
This section of the snapshot page lists all the VMs on the Host, resources allotted to each VM, network adapters, and storage repository details. Any change in the inventory, will get updated here automatically. You can also find the monitors that are enabled on the Host and notification profiles associated to it. Click on the respective tab to view its details.

Once the host and the corresponding virtual machines are discovered, thresholds have to be configured for the respective monitors. Click here to know more about how to configure thresholds in OpManager.
OpManager also allows users to automate basic troubleshooting activities by using its workflow feature.
Now that the devices are discovered, monitored for the necessary metrics, and associated to relevant notification profiles, the concerned person will be notified at the earliest, regarding the issue at hand.
Thank you for your feedback!