OpManager monitors your network's performance and availability to maintain maximum network uptime. It stores the monitoring information in its database and allows users to access it in the form of Reports for future analysis.
Access the Reports tab to view the different types of default reports in OpManager.
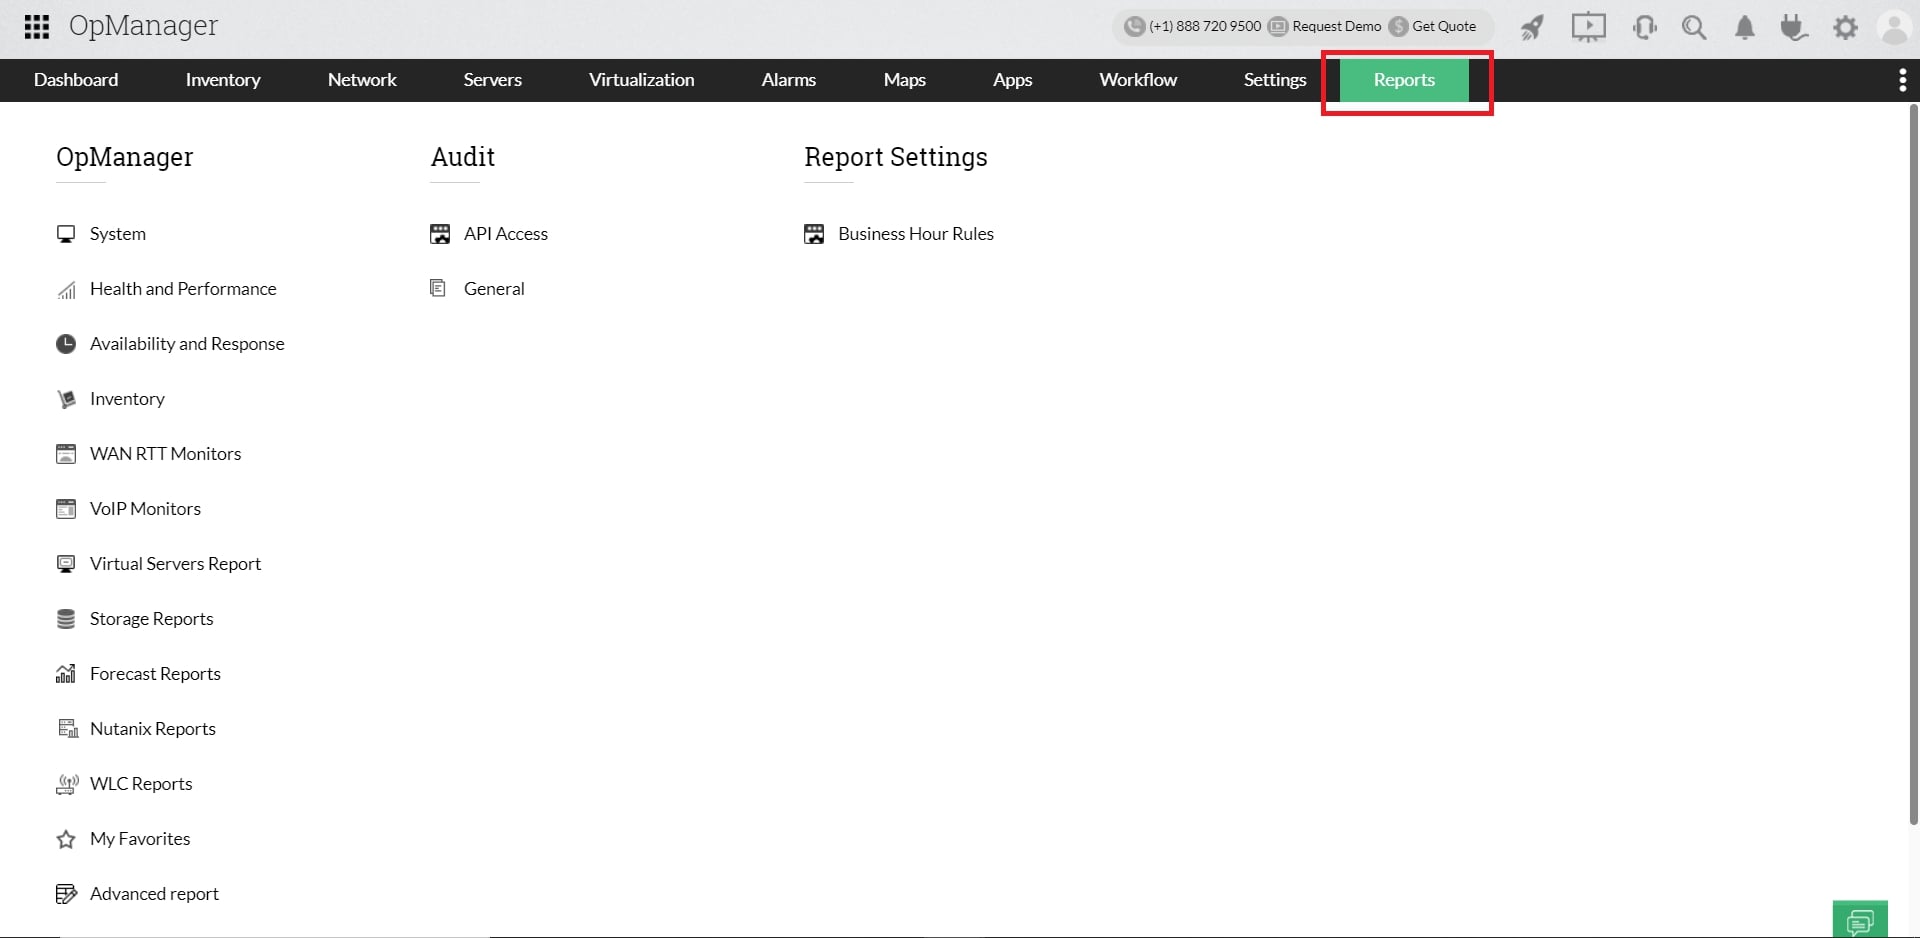
Under each category the reports are further categorized into different types to simplify the access of information. Overall there are more than 100 types of built-in reports
For example, you can view in-depth details on Device availability under Availability and Response reports.
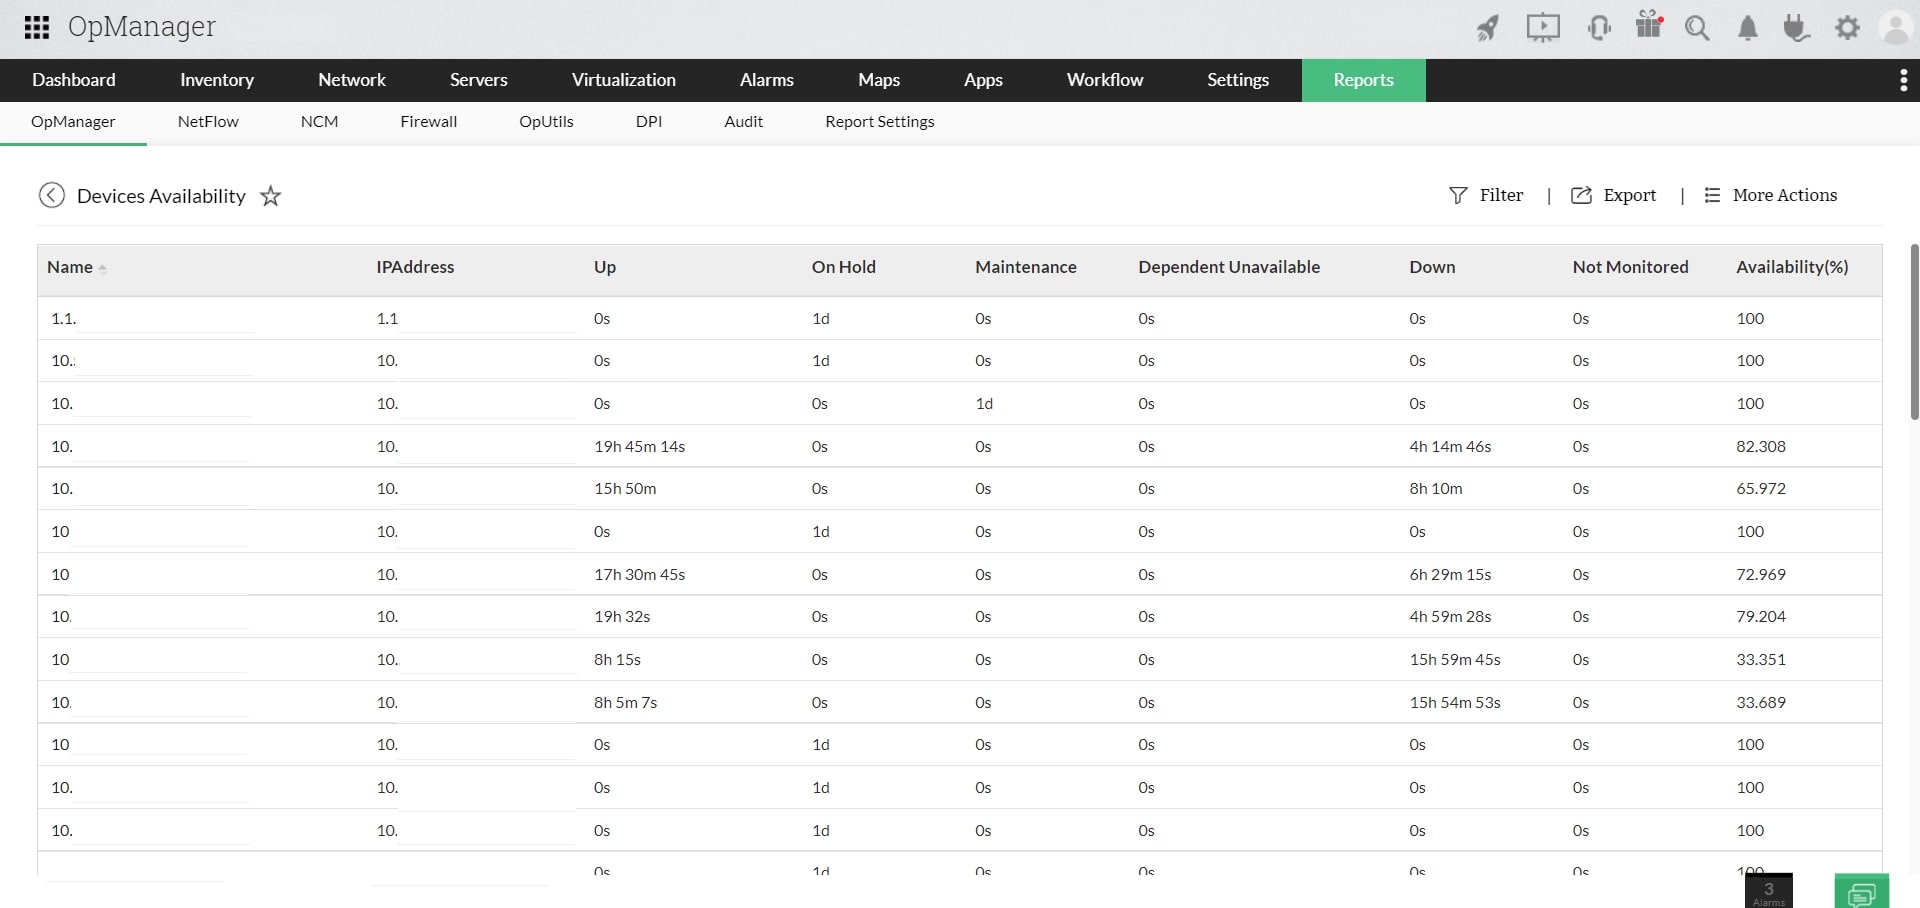
The list of default reports in OpManager include:
These intuitive reports help you determine the performance of devices and interfaces up to a granular level. OpManager allows you to download a report in PDF/XLS and perform other actions such as Email a report, make a copy of a report and mark a report as favorite etc.
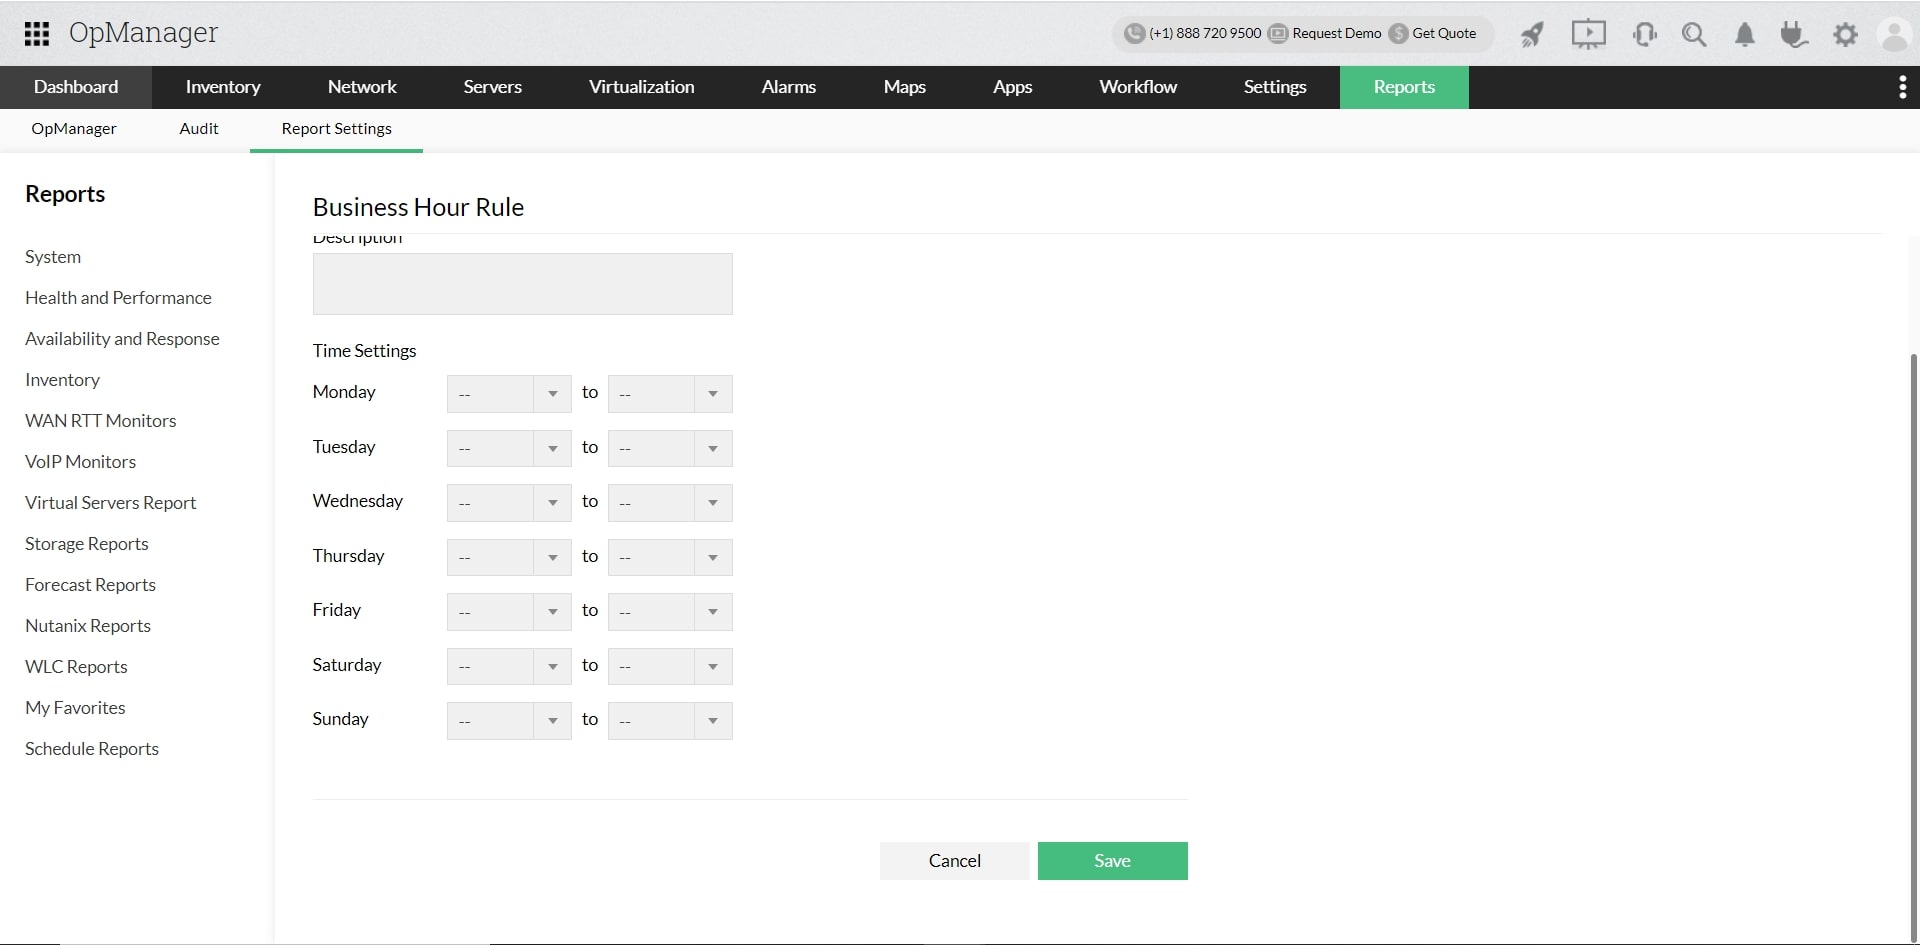
OpManager monitors your network 24/7 and stores all the information in the form of reports. But you may want to view the monitoring data recorded only during the business hours of your organization as it will be more relevant for analysis. However, the business hours of each organization may vary, so by configuring the business hour rule in OpManager, you can generate reports only for the defined business or working hours of your company.
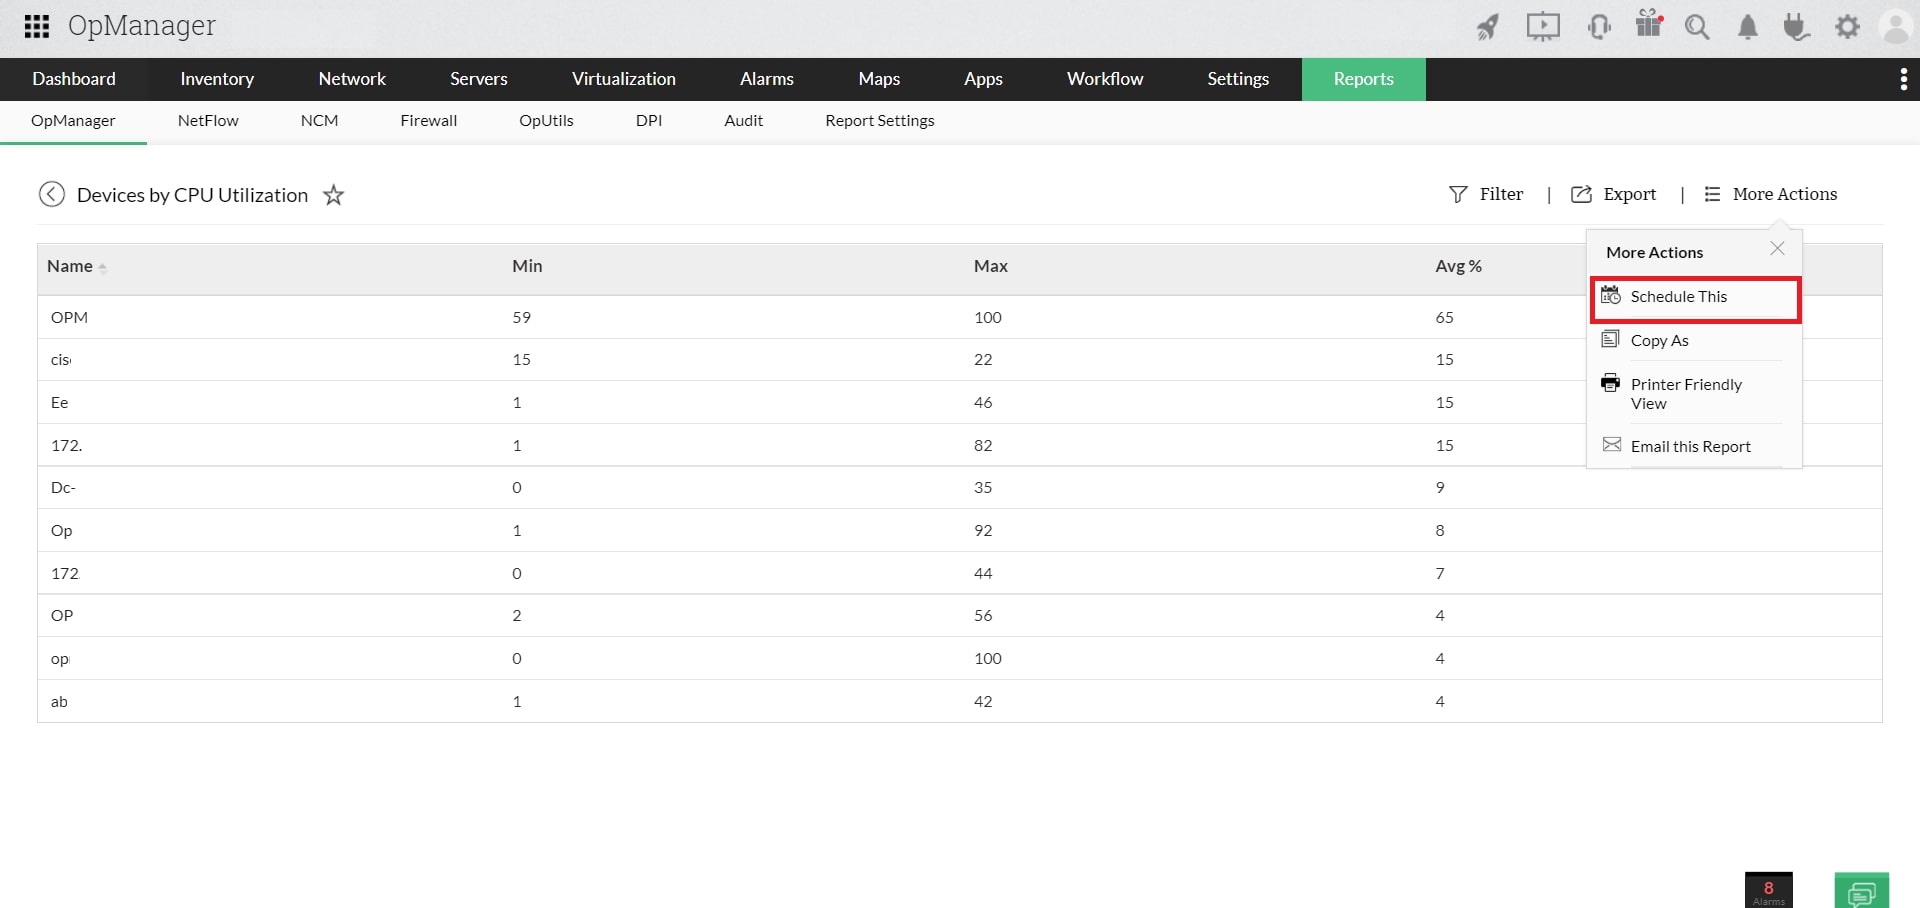
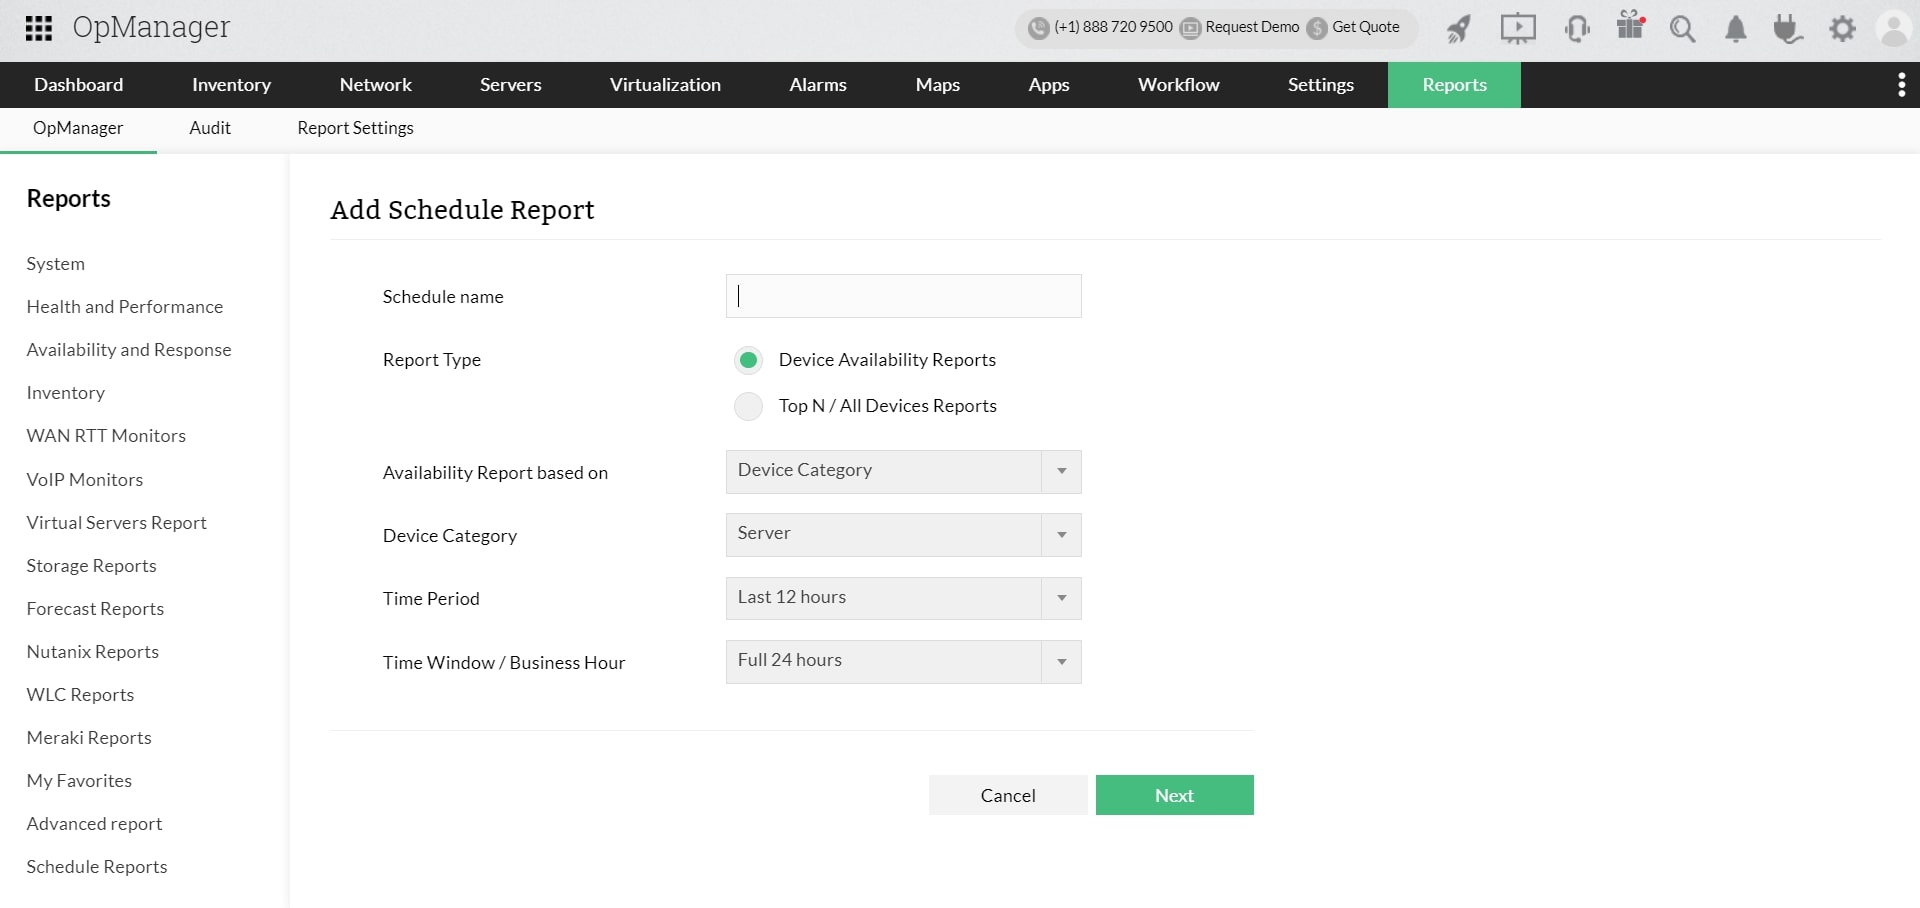
The schedule report option is used to send a report to a specified email id at regular intervals. For example, a network engineer responsible for monitoring a particular network site has to send the monitoring reports every week to his manager.
To download the required reports manually and send them through email can be a tasking job, especially if there are volumes of reports.
The IT admin could use the schedule option and automate the process of sending the specified reports at regular intervals — daily, weekly or monthly. In this way you can configure to receive reports via email at regular intervals, so that you do not miss viewing the monitoring information.
You can schedule an individual report under a category. For example, you can schedule a report to view devices that have a high CPU utilization.
The other option is to use the Add Schedule Report feature and specify the report type, Time Period and other associated information and schedule a report.
Using the filter option, you can narrow down and view the monitoring data for a particular category. For example, the report on Device CPU utilization by default lists data for all the devices, but using the filter option, you can narrow down to particular category such as Servers, Printers etc. and view the data pertaining to that category.
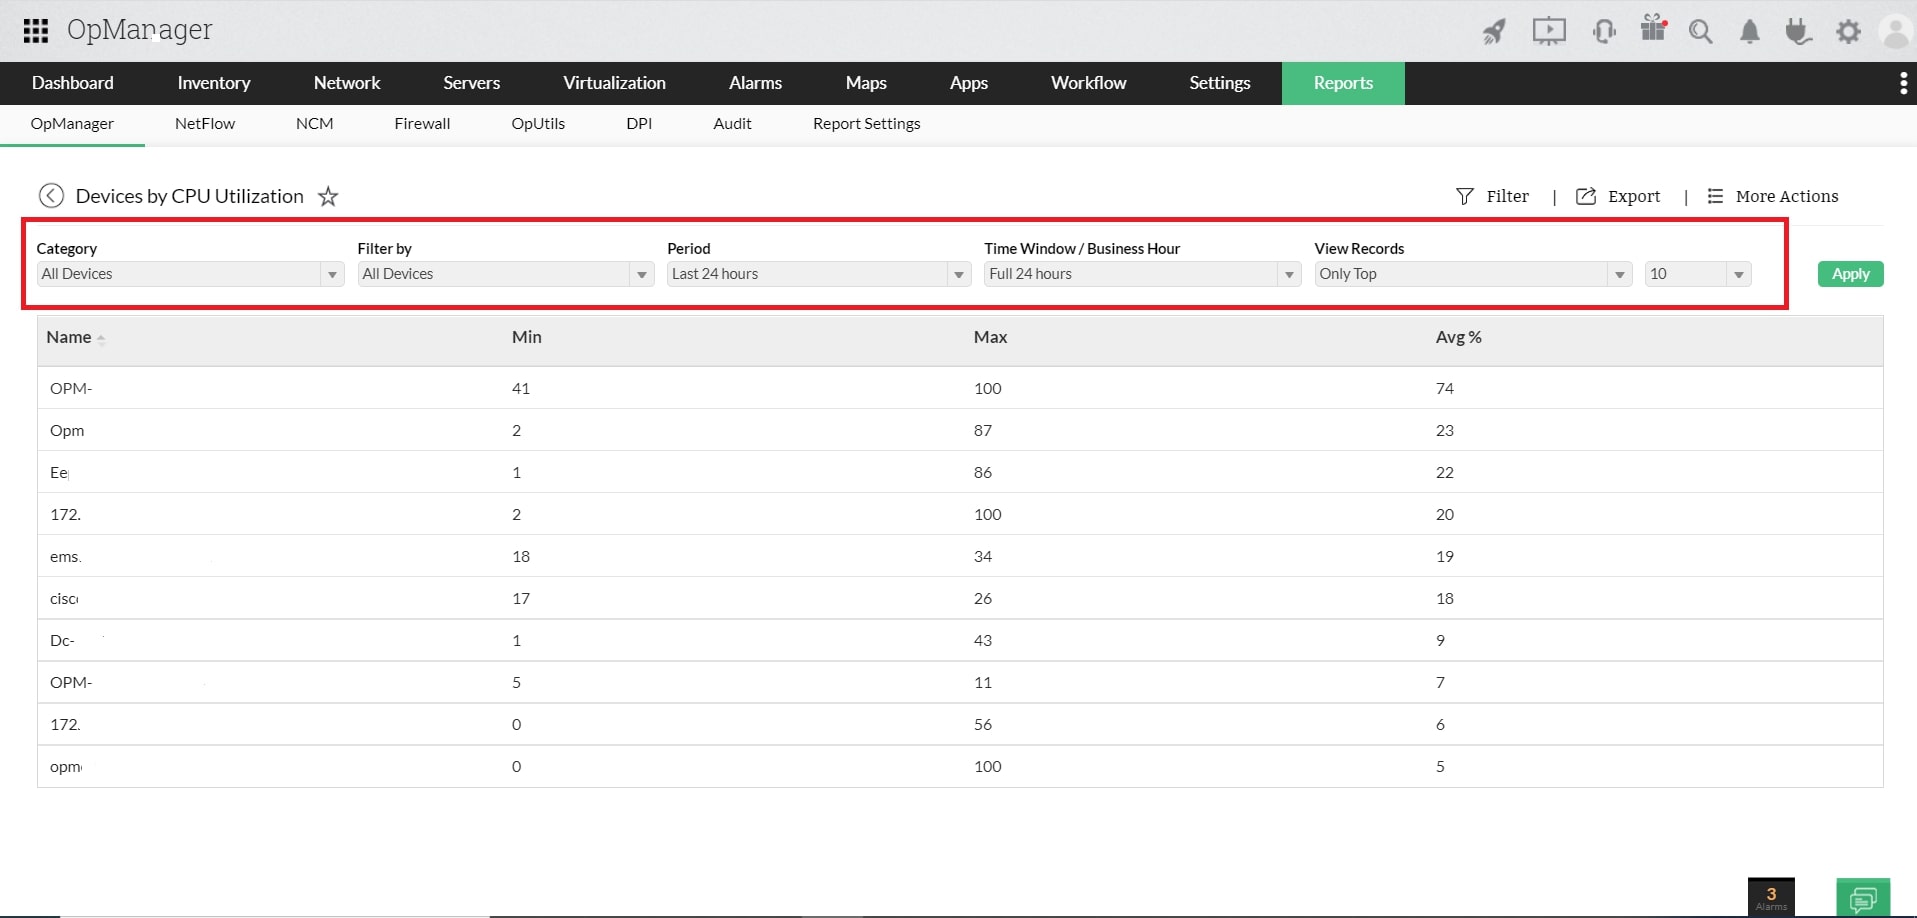
By specifying the time window or business hour, you can view the monitoring data recorded in that duration.
Custom reports
Apart from the default reports, you can also create customized reports that cover only particular data. You can create user-defined reports in OpManager using the following features.
Advanced Report
The advanced report feature in OpManager allows you to specify the criteria such as module, monitors involved and and creates the report only with the data that you require. For example, you can create a report covering monitoring information of devices belonging to a particular Device type.
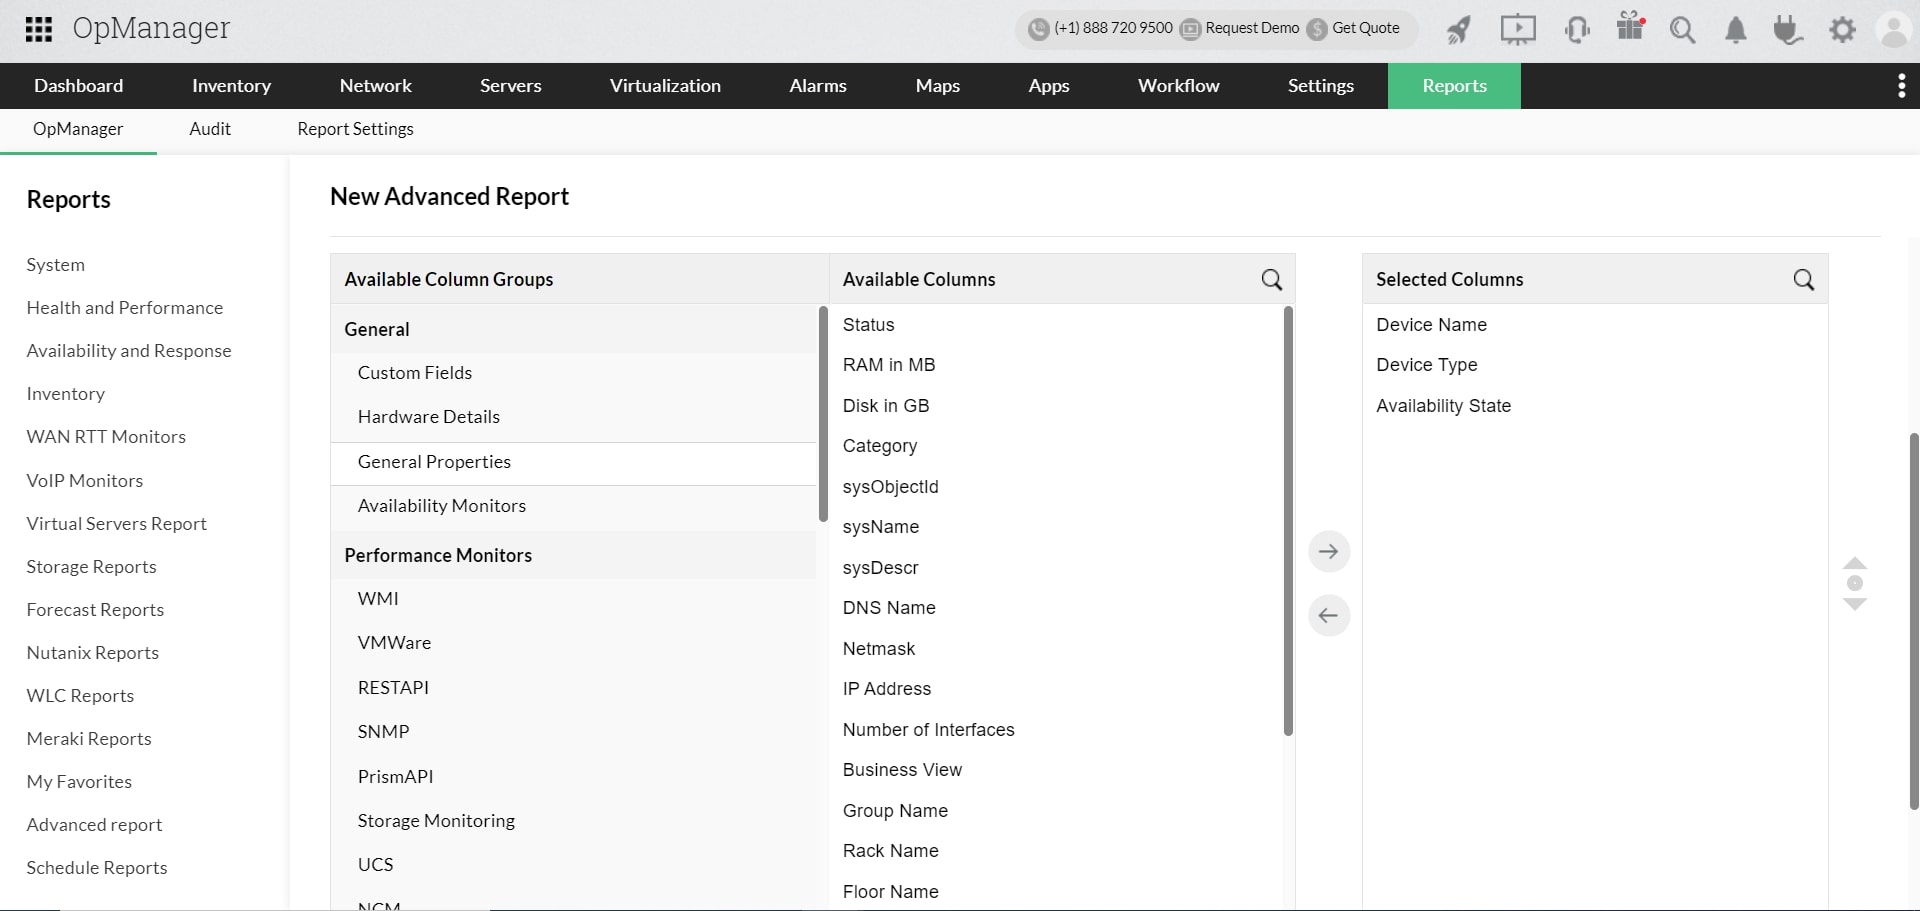
Generate report using report builder
OpManager also has the Report Builder option, which enables you to generate a report from the inventory page of devices and interfaces.
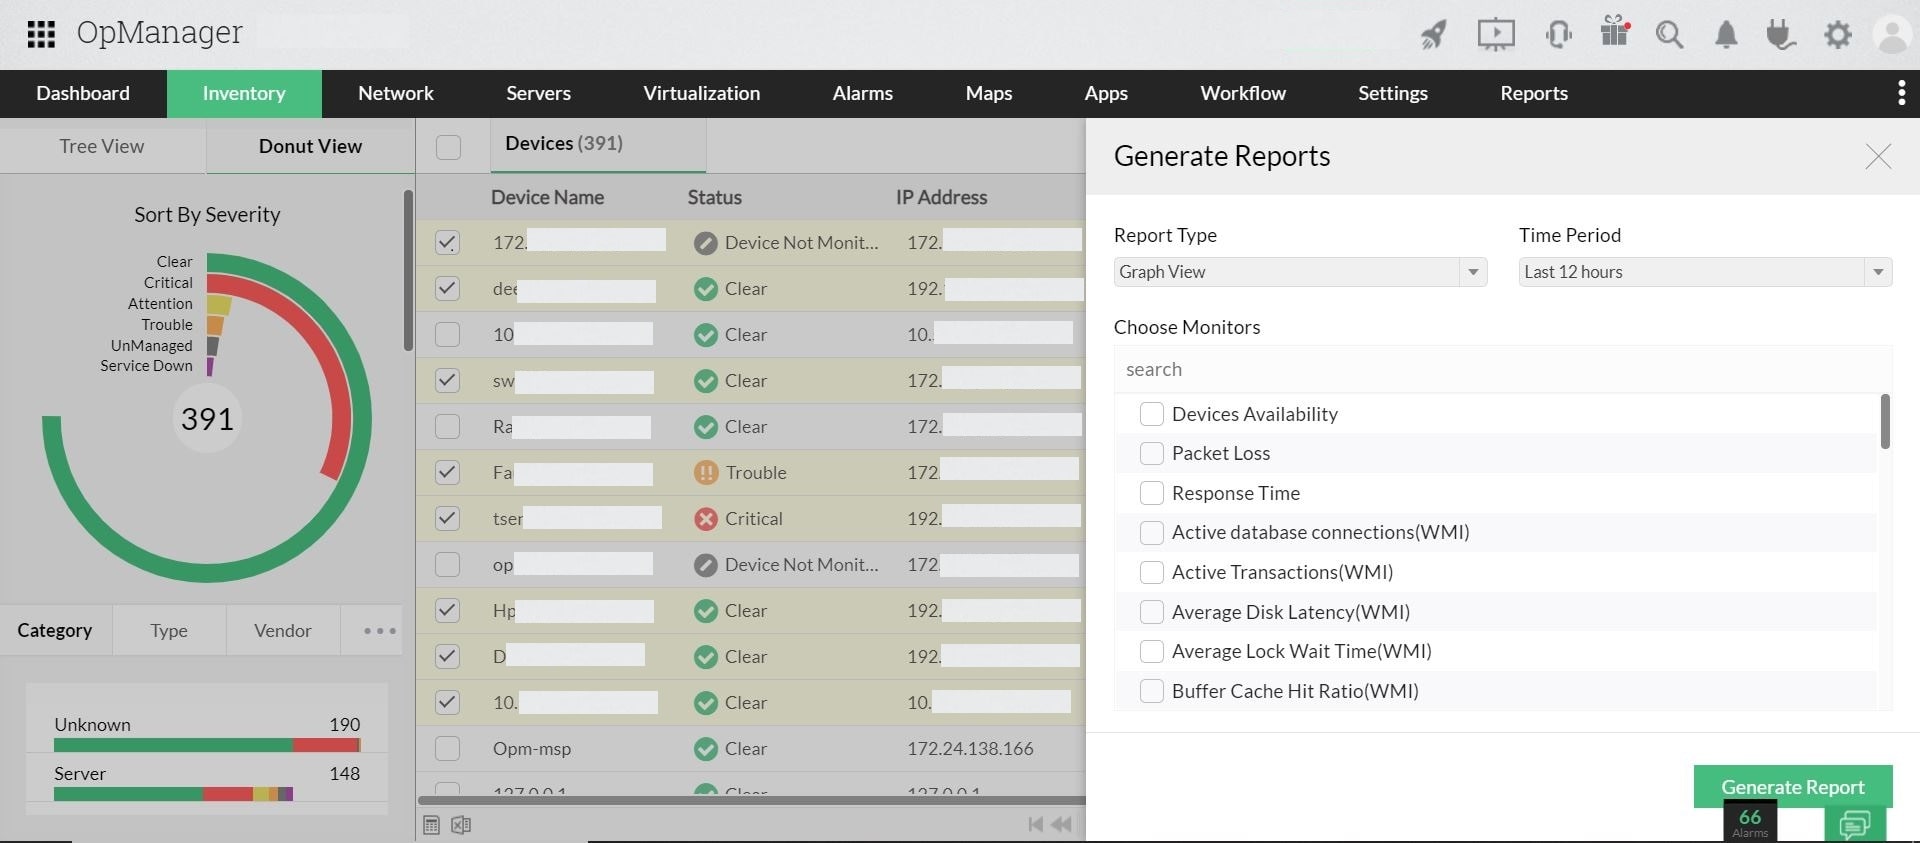
You can create a report either in tabular or graphical format by specifying the monitors, the set of devices (or interfaces, if you create a report from the interface inventory) and the time period for which a report will be generated. These reports will be stored in OpManager's database and can be accessed under Integrated reports. (Reports --> Integrated Reports)
Note: This page outlines the overview of features. To get step by step instructions for using a feature we request you to access the hyperlinks mentioned in appropriate places in this page.
Thank you for your feedback!