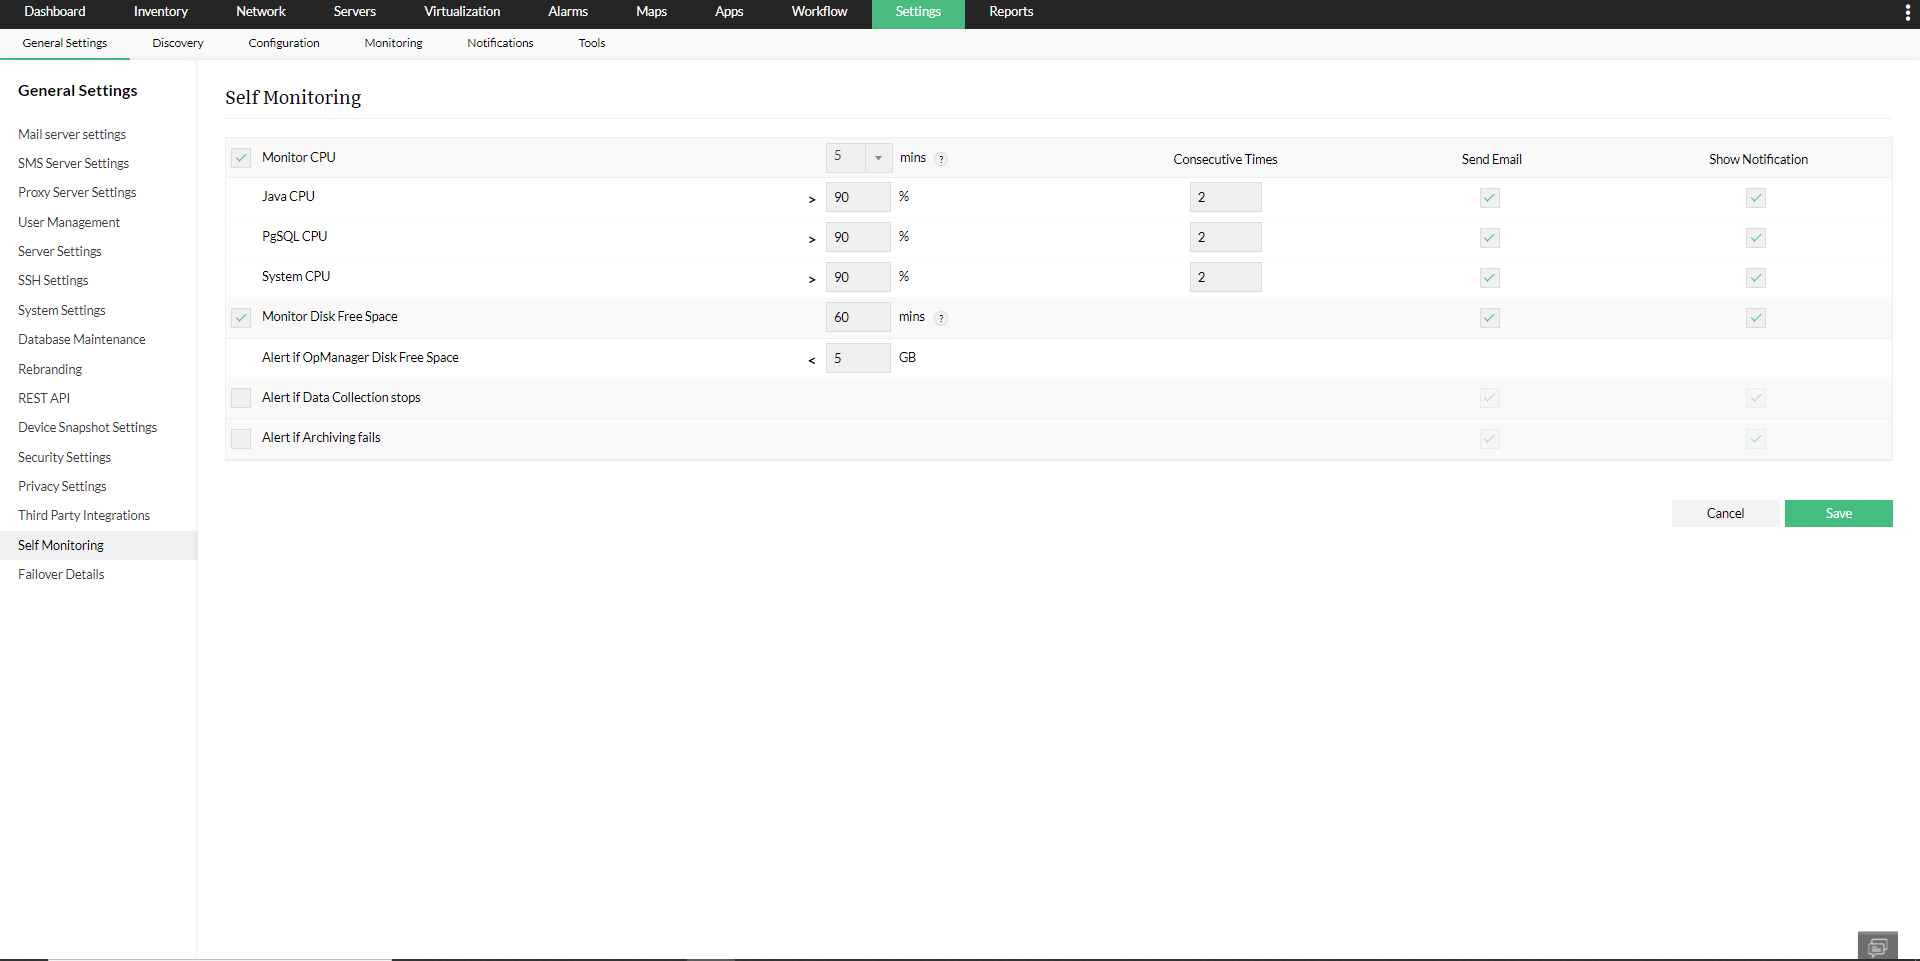
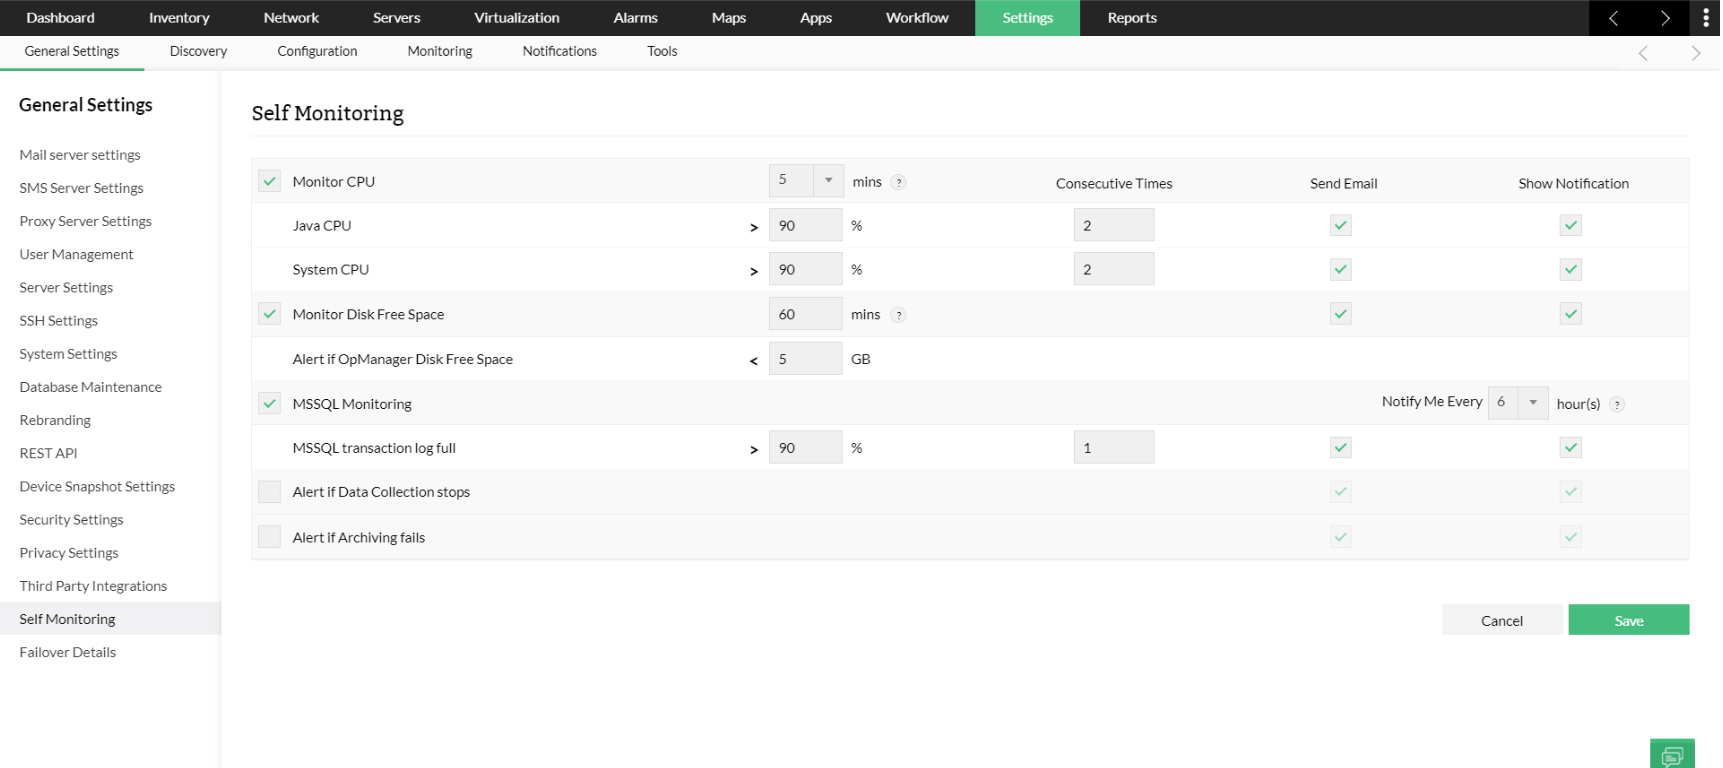
With Self Monitoring, you can monitor CPU usage (Java CPU, PGSQL CPU and system CPU), free disk space, receive alerts via email/notifications if data collection stops and if archiving fails. This helps to ensure that the device in which OpManager is installed and running from, is constantly healthy and helps you fix potential issues immediately.
To configure Self Monitoring go to Settings -> General Settings -> Self Monitoring

Select this option to monitor the CPU usage and choose the monitoring interval from the drop down available. This is the frequency of polling for CPU monitoring.
Monitors the CPU usage by Java, the process on which the OpManager application works, and collects the CPU usage data in percentage at regular intervals.
Monitors the CPU usage by PgSQL, the process on which the OpManager database works, and collects the CPU usage data in percentage at regular intervals.
Note: If the OpManager is using the MSSQL database, then the option to configure self monitoring threshold for PGSQL CPU usage is replaced by 'MSSQL transaction log full' percentage. 'MSSQL transaction log full' once detected will be notified at regular intervals.

Monitor the overall CPU usage by the system in which OpManager is running.
1. Increase or decrease the threshold values for CPU usage percentage by Java applications used by OpManager, PgSQL databases used by OpManager, and the overall System CPU usage for which alerts need to be sent respectively. However, increasing the threshold values is not recommended.
2. Increase or decrease the 'Consecutive Times' of exceeding the CPU usage percentage of Java CPU usage, PgSQL CPU usage and System CPU usage specified that you want an alert for.
3. Select if you want to receive alerts via email and/or notifications.
Monitor the free space available in the drive in which OpManager is installed by selecting this option.
1. Alter the time interval for monitoring and Disk Free Space if so desired.
2. Select if you want to receive alerts via email and/or notifications.
Enabling the send email option allows you to send the self-monitoring alert of the respective monitor via mail to the respective mail address configured under the mail server settings, and the send notifications option allows you to receive the self-monitoring alerts of the respective monitor, in the top band of OpManager UI.
Select this option if you want to receive an alert when data collection in OpManager stops.
OpManager archives data on a regular basis (hourly and daily) in order to free up space for newer data. Select this option if you want to receive an alert when this regular archiving of data does not take place.
Thank you for your feedback!