Forecast alerts help you stay updated on the resource utilization of your network devices, by predicting the approximate duration in which your resource(s) could potentially be exhausted. This prediction is based on the observation of the particular resources over a period of time, and utilizing a forecast engine to forecast the future trend of utilization. Alerts are raised based on this forecast, for early mitigation and a proper plan of action to be taken by the network administrator.
With the latest version of OpManager, forecast alerts are supported for the following resources, using their respective monitors:
|
Resource |
Monitor |
|---|---|
| Disk Forecast | Disk Utilization |
| SQL Server Transaction Log | Log Files Used Percentage |
| Storage Server | Capacity Utilization |
| VMware Datastore | Datastore Free Space (%) |
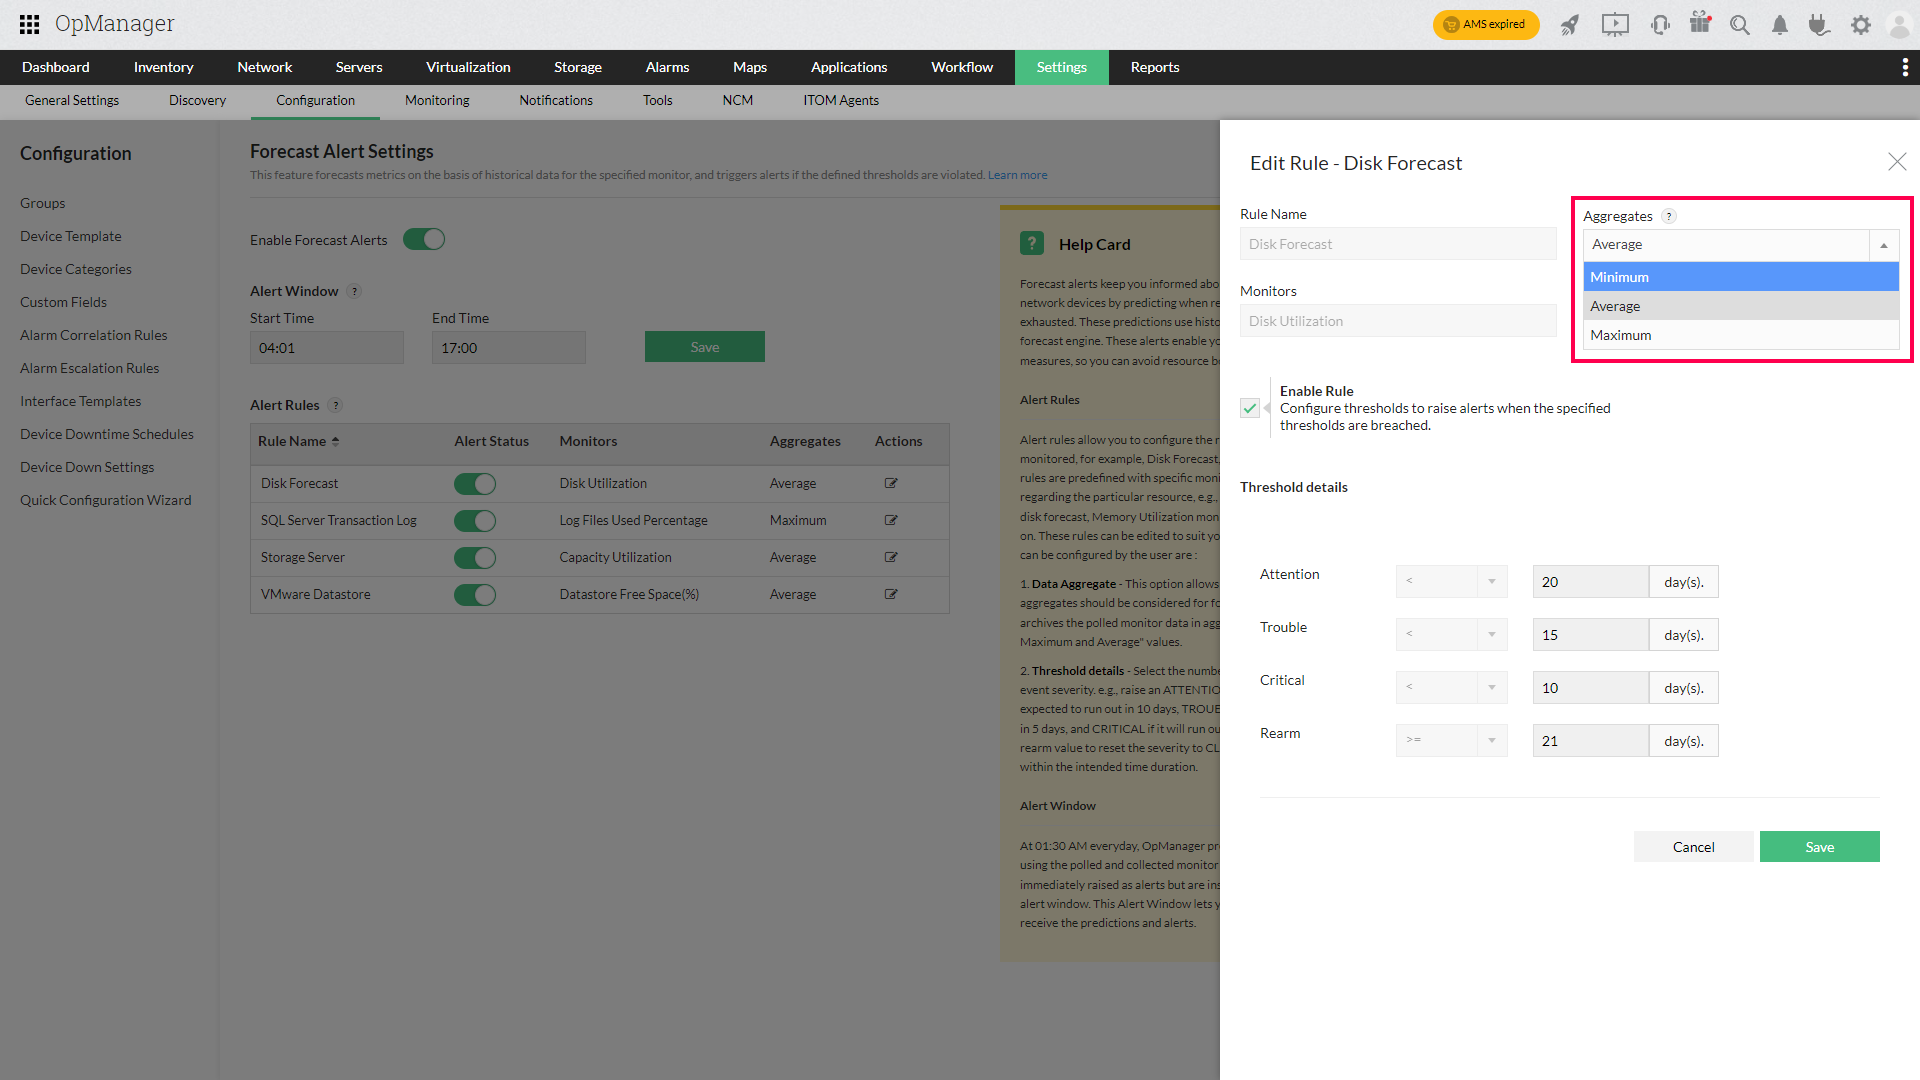
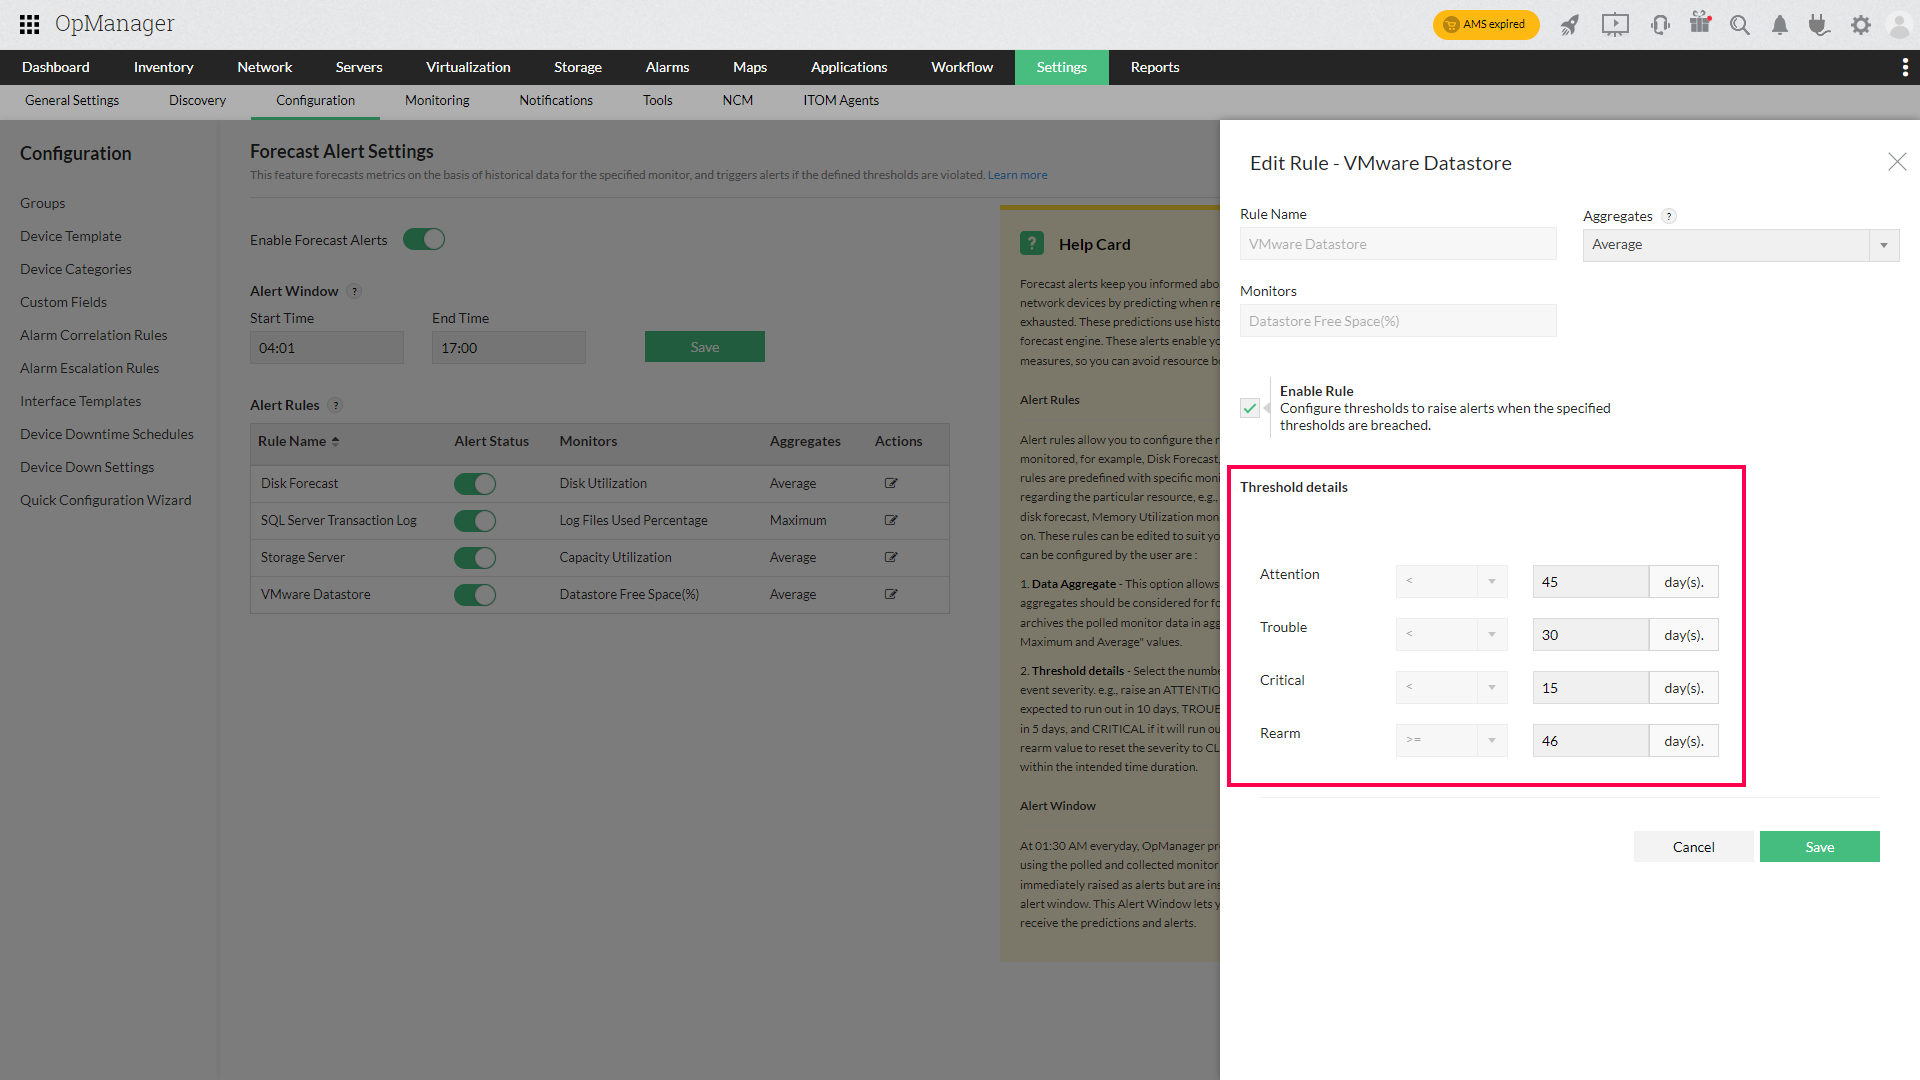
Forecast Alerts rely on alert rules to identify which resources must be monitored, for example, Disk Forecast, etc. These rules are predefined with specific monitors that gather data pertaining to the particular resource, e.g., Disk Utilization monitors for disk forecast, Memory Utilization monitors for RAM forecast, and so on. These rules can be edited to suit the network administrator's needs. The parameters that can be configured by the user are:
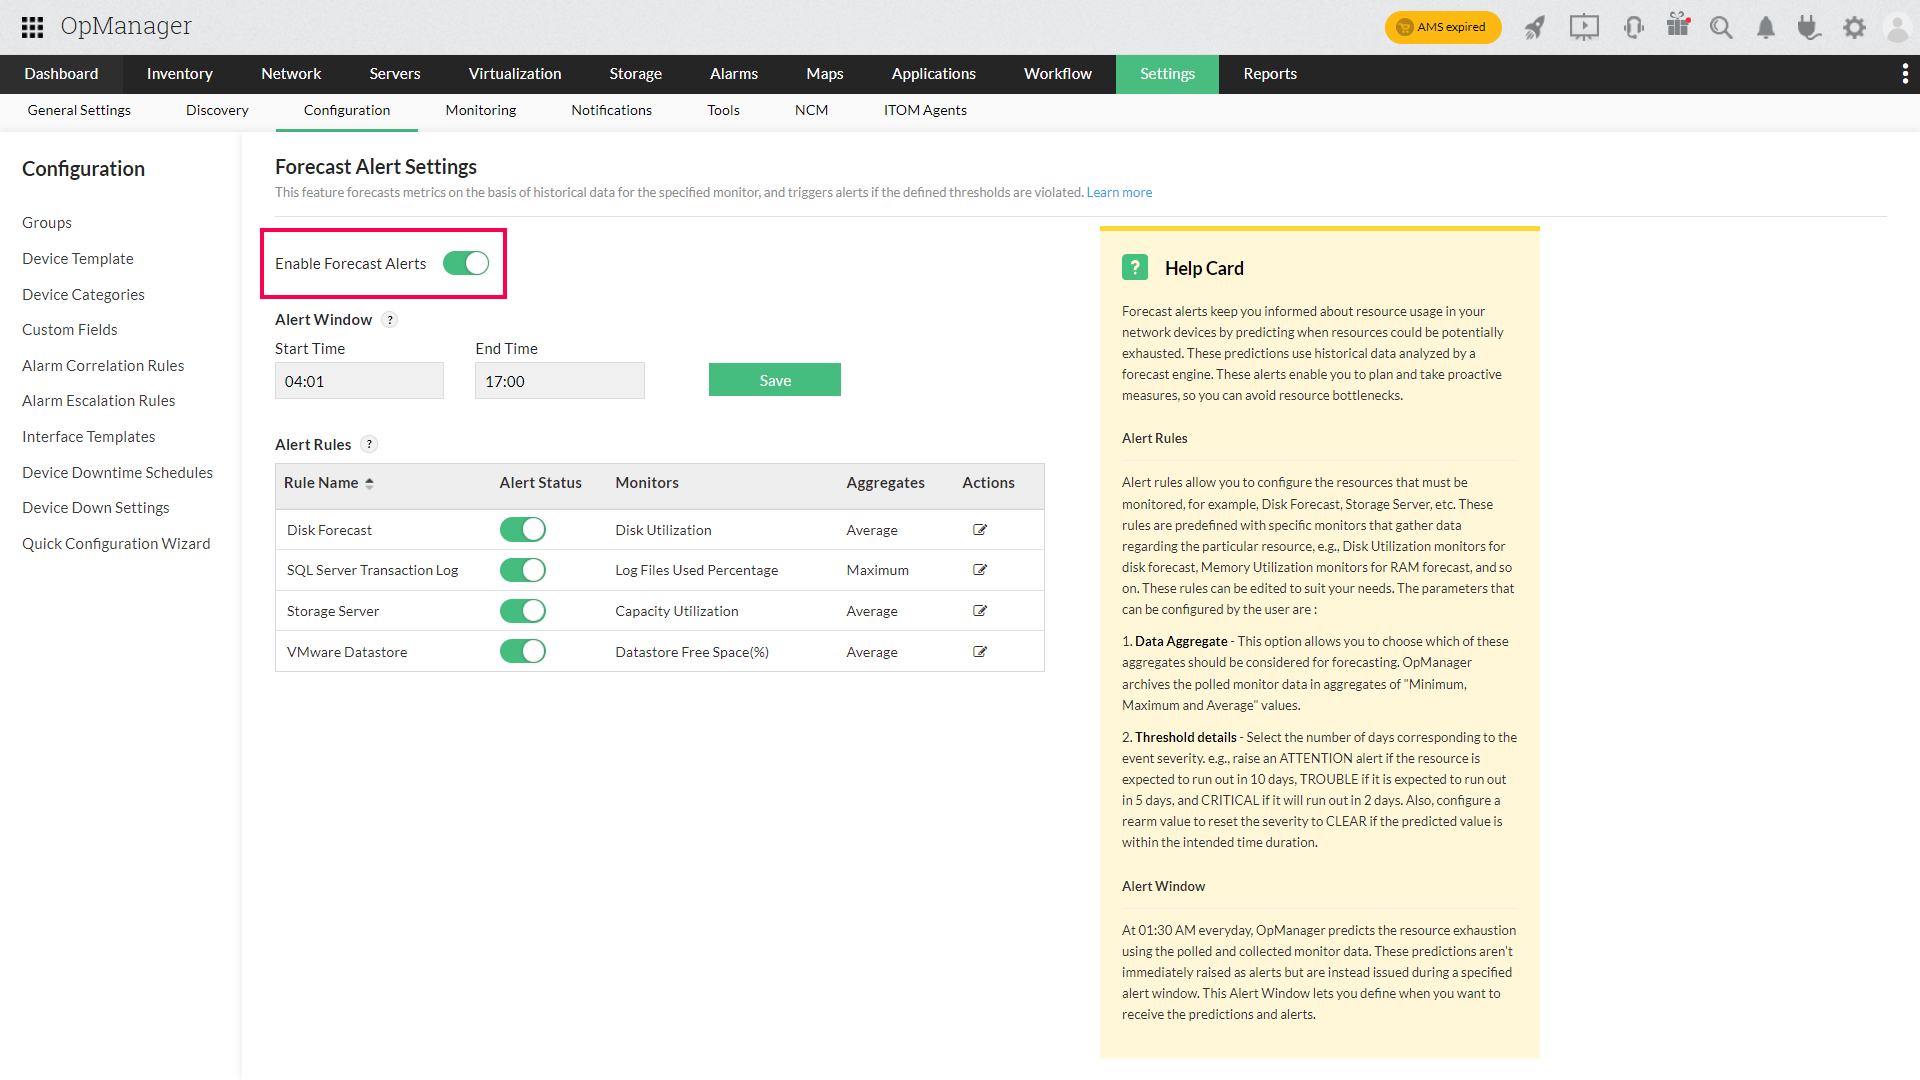
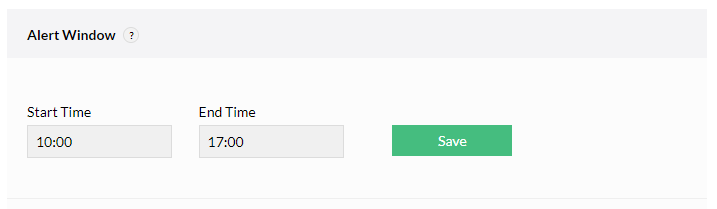
OpManager routinely polls the monitors associated to the alert rules, and every day, during non-business hours (01:30 AM), the forecast engine uses this data to predict the expected resource exhaustion duration. The predictions made during this time, are not raised as alerts immediately, but rather, during a time frame referred to as the alert window. This duration is the time during which you wish to receive the predictions (and therefore, the alerts).
Note: For convenience, it is recommended that the configured alert window be the same as your business hours.
Forecast Report Types
| Report Name | Description | Available Columns | Available Filters |
|---|---|---|---|
| Monitor Forecasting Trend | This report provides predictive insights into various performance metrics (monitors) of a selected device over a specified future period. Using historical data and trend analysis, it forecasts expected values for each monitor, helping users anticipate performance behaviors such as usage spikes, drops, or consistent trends. This enables proactive capacity planning, system optimization, and timely preventive measures to avoid potential issues. | Date and Time, Data Collected Value, Expected Value | None of the filters applicable for this report |
| CPU Forecast | This report provides predictions on when the CPU usage of monitored devices will reach critical levels (80%, 90%, and 100%). It helps in forecasting potential performance issues by indicating the time frame within which CPU usage will peak, allowing administrators to take necessary actions to avoid overloads. The report helps in proactive system management and capacity planning. | Device Name, Protocol, Currently Used (%), Prediction (80%), Prediction (90%), Prediction (100%) | Category, Filter by |
| Memory Forecast | This report provides forecasts on when the memory usage of monitored devices will reach critical levels (80%, 90%, and 100%). By predicting when memory usage will peak, it allows administrators to take proactive measures before systems become overburdened. This report helps in managing system resources and preventing performance degradation due to high memory utilization. | Device Name, Protocol, Currently Used (%), Prediction (80%), Prediction (90%), Prediction (100%) | Category, Filter by |
| Disk Forecast By Usage | This report predicts when the disk usage for different partitions on monitored devices will reach critical levels (80%, 90%, and 100%). It helps in understanding the rate of disk consumption and provides timelines for when specific partitions will hit capacity limits, allowing administrators to take necessary actions to prevent potential disk space issues, such as allocating more space or clearing unused data. | Device Name, Partition, Currently Used (%), Prediction (80%), Prediction (90%), Prediction (100%) | Category, Filter by |
To know more about the Available Filters in various reports of OpManager, Click here.
Thank you for your feedback!