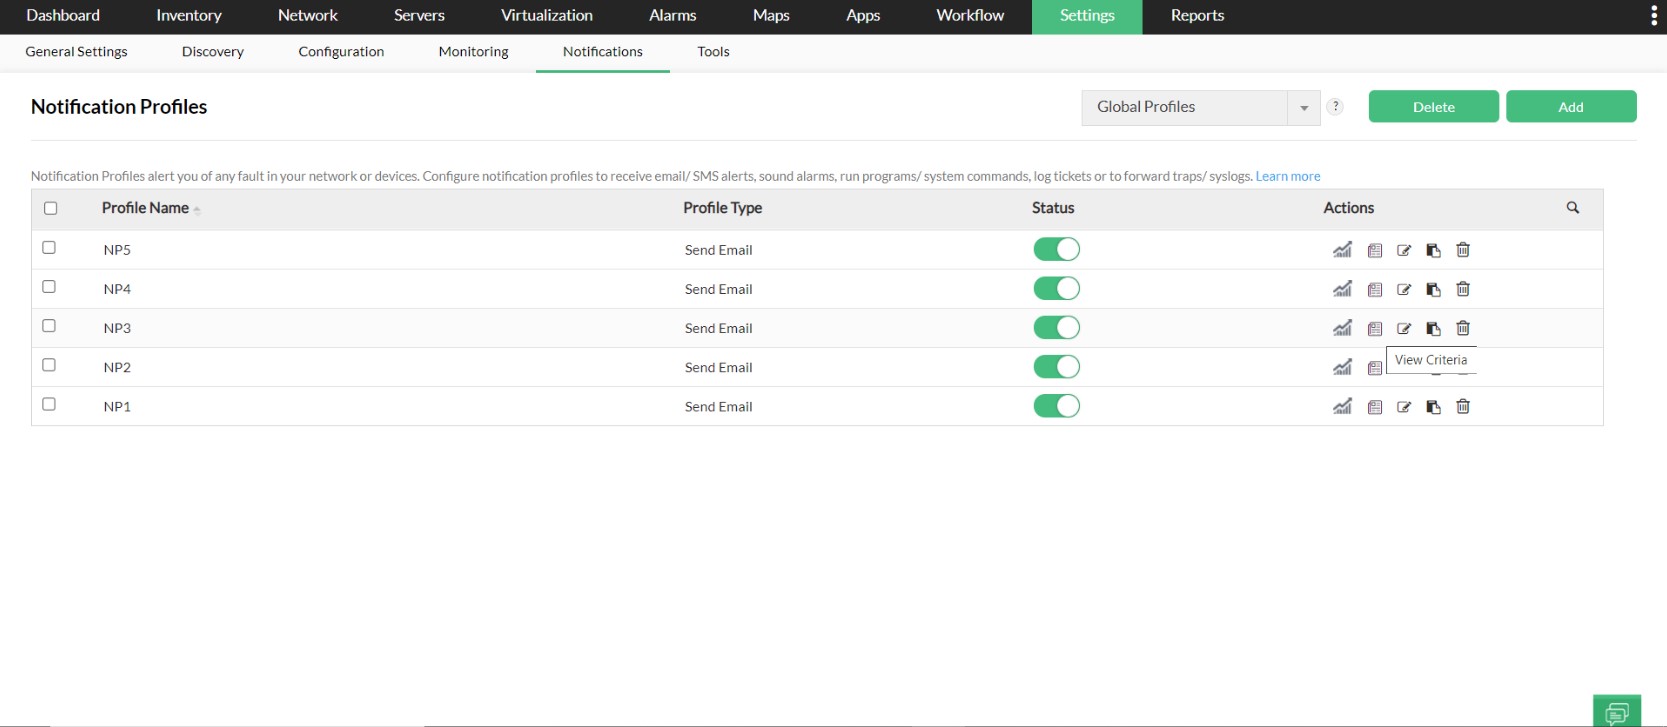
When a fault is detected in your network, an event occurs and multiple events correlate to trigger an alarm. You can configure OpManager to notify the network administrator or perform automatic actions based on the alarm raised for a device using Notification Profiles.
To configure Notification Profiles, follow the steps on this page.
Below is the list of criteria for which Notification Profiles can be configured:
Device Down for - When a Device is down, select the severity for which you want the Notification Profile to be triggered.
When any Alarm Message matches - This criteria triggers an alert if the alarm message matches the provided text or regex pattern. For detailed guidelines on acceptable text or regex pattern input, please refer to this document.
Hardware in problematic condition - This criteria will trigger an alert if a problem is detected in any of the monitored hardware parameters, including IPMI-related metrics.
Note: Hardware monitors will only generate alerts with critical severity.
When any probe is down - This criteria will trigger an alert when a probe is down.
Note: This criteria is only available in the Central server for OpManager Enterprise Edition.
Interface or Switch Port has some problems - This criteria will alert you on the status of an interface, its error/discard/utilization threshold violation.(Before version 128401)
When any Interface is down - This criteria will alert you on the status of an interface (After version 128401)
When any Interface monitor has violated a threshold - This criteria will trigger an alert when any selected interface threshold (Utilization, Error Rate, or Discard Rate) is violated. (After version 128401)
When any selected Service is down - This criteria will trigger an alert when any selected Service is down.
When any selected Windows Service is down - This criteria will trigger an alert when any selected Windows Service is down.
When any selected Printer Monitor is down - This criteria will trigger an alert when any selected Printer Monitor is down.
When any selected UPS Monitor is down - This criteria will trigger an alert when any selected UPS Monitor is down.
When any selected SNMP trap is received from the device - This criteria will trigger an alert when any selected SNMP trap is received from the device.
Threshold rule is violated - This criteria will trigger an alert if there is a threshold violation in the configured performance parameters.
When any URL is down - This criteria will trigger an alert when any URL is down.
When any selected Script Monitor is down or has violated a threshold - This criteria will trigger an alert when any selected Printer Monitor is down or has violated a set threshold.
When any selected Process is down or has violated a threshold - This criteria will trigger an alert when any selected Process is down or has violated a set threshold.
When any selected File Monitor(s) has violated a threshold - This criteria will trigger an alert when any selected File Monitors have violated a set threshold.
When any selected Folder Monitor(s) has violated a threshold - This criteria will trigger an alert when any selected Folder Monitors have violated a set threshold.
When any selected Event Log Rule(s) generates an alarm - This criteria will trigger an alert when a selected Event Log Rule generates an alarm.
When any selected Syslog Rule(s) generates an alarm - This criteria will trigger an alert when a selected Syslog Rule generates an alarm.
When any selected IPSLA is having problems - This criteria will trigger an alert when a selected IPSLA is having problems.
Note: This criteria will be shown only for the profiles in the Device Snapshot page (Navigate to Inventory and click on a device to open the device snapshot page.) of Switch, Router, and Firewall devices.
When any selected Exchange Monitors are down - This criteria will trigger an alert when a selected Exchange Monitor is down.
When any selected Exchange Services are down - This criteria will trigger an alert when a selected Exchange Service is down.
When any selected Active Directory Monitors are down - This criteria will trigger an alert when a selected Active Director Monitor is down.
When any selected Active Directory Services are down - This criteria will trigger an alert when a selected Active Director Service is down.
When any selected MSSQL Monitors are down - This criteria will trigger an alert when a selected MSSQL Monitor is down.
When any selected MSSQL Services are down - This criteria will trigger an alert when a selected MSSQL Service is down.
When any selected Virtual Device has a problem - This criteria will trigger an alert when any selected Virtual Device encounters a problem.
When any Log file monitoring agent is down - This criteria will trigger an alert if a log file monitoring agent is down.
When any UCS fault received - This criteria will trigger an alert when any UCS fault is received.
When any Configuration backup is failed - This criteria will trigger an alert when a Configuration backup fails.
When any Configuration is changed - This criteria will trigger an alert when a Configuration is changed.
When any NFA alarm is triggered - This criteria will trigger an alert when a NFA alarm is triggered.
When any Storage alarm is triggered - This criteria will trigger an alert when a Storage alarm is triggered.
When any Interface bandwidth exceeds its speed - This criteria will trigger an alert when a Interface bandwidth exceeds its speed.
Notify when the alarm is cleared - Check this option if you want to get notified when an alert from any of the above criteria is cleared.
Note: Click here to learn more about the inter-dependency between Criteria and Severity.
To look at the list of criteria configured for an existing Notification Profile, go to Settings -> Notifications and click on the 'View Criteria' under Actions, parallel to the Notification Profile.

Thank you for your feedback!