With APM Insight Java agent, you can track Java Management Extensions (JMX) metrics. Although we monitor and enhance application performance using transaction metrics and traces, it is equally important to monitor the environment where your application is running. Moreover, monitoring JMX metrics helps you gain additional insights.
By default, JMX metrics are captured from APM Insight Java agent version 5.1, and can be viewed under App Parameters tab. Since JMX metrics are specific to app servers, metrics captured by default in various servers are listed below.
| Metrics | Tomcat | JBoss AS | WildFly | GlassFish | WebLogic | WebSphere AS | WebSphere Liberty profile | Jetty |
|---|---|---|---|---|---|---|---|---|
| Session |  |
|
|
|
 |
|
|
|
| Data Source | |
|
|
|
|
|
|
|
| Thread pool | |
|
|
|
|
|
|
|
| Transactions (JTA) | |
|
|
|
|
|
|
|
| Buffer Pool | |
|
|
|
|
|
|
|
| File Descriptor Count | |
|
|
|
|
|
|
|
To enable capturing of JMX metrics, follow the steps given below:
 .
.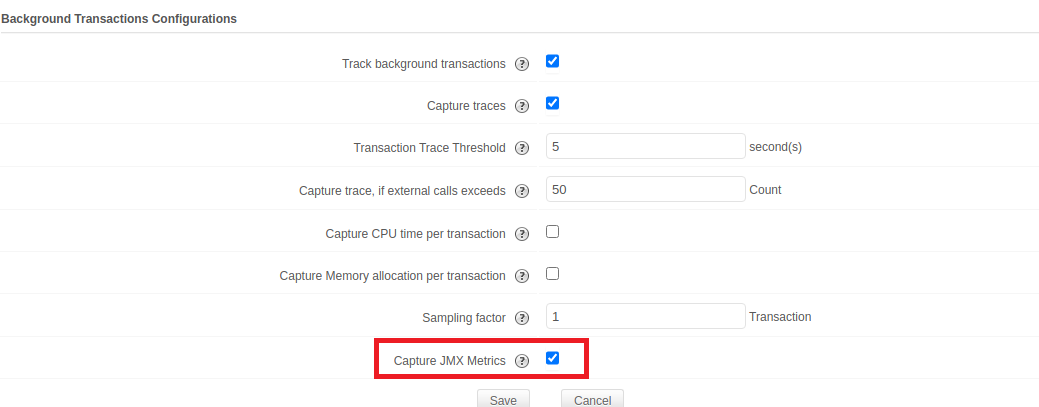 If you do not want to monitor JMX Metrics you can disable the Capture JMX metrics checkbox under the APM tab → Your application → Action → Edit → APM Insight Application Configuration Profile → Background transactions.
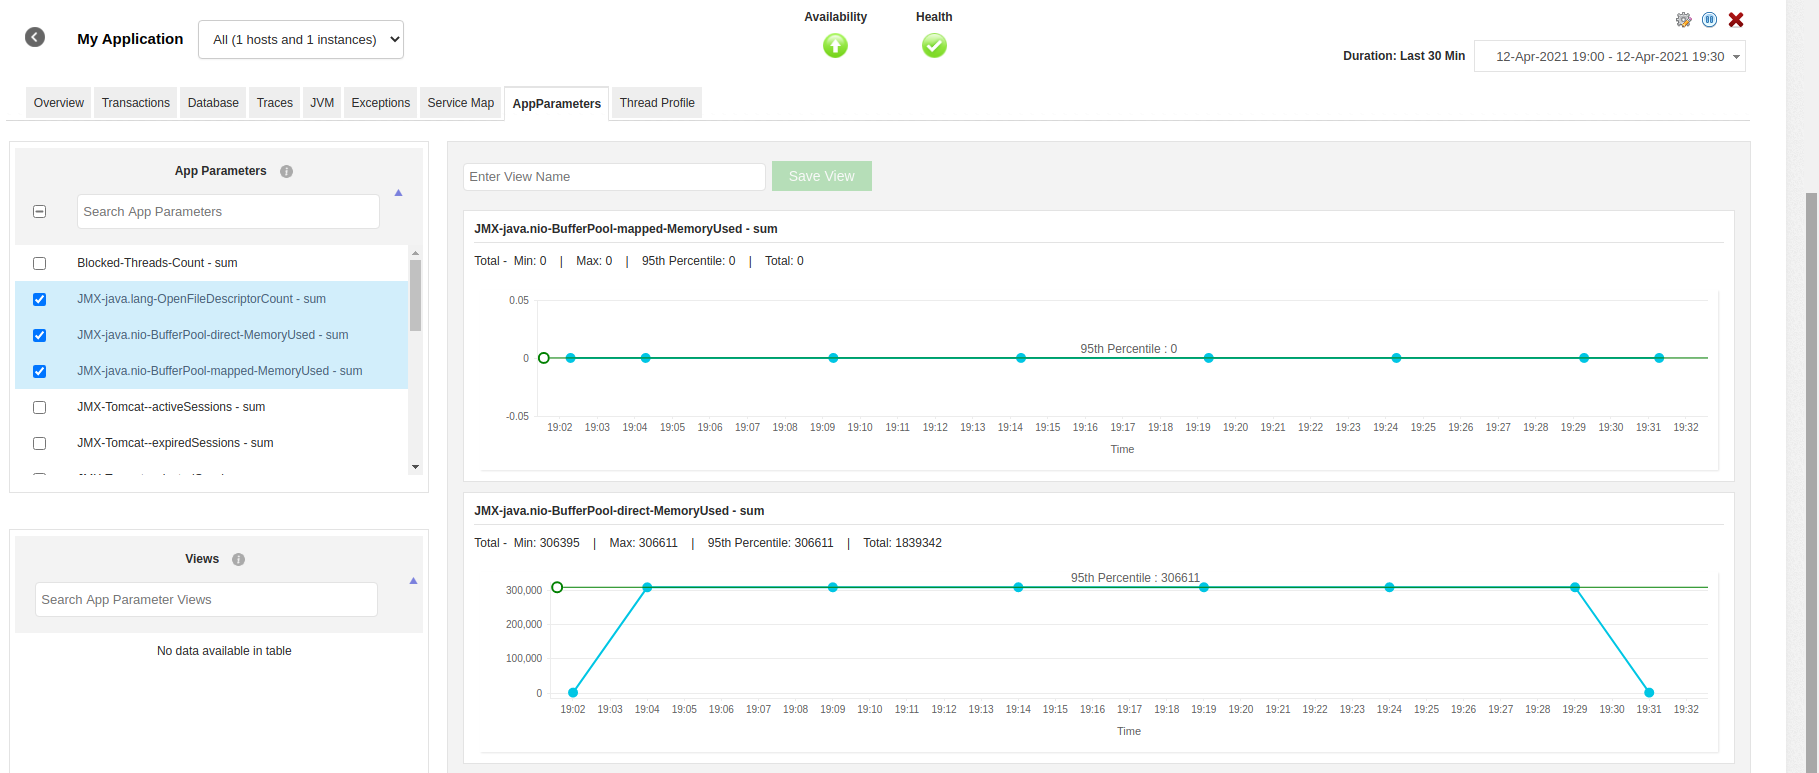
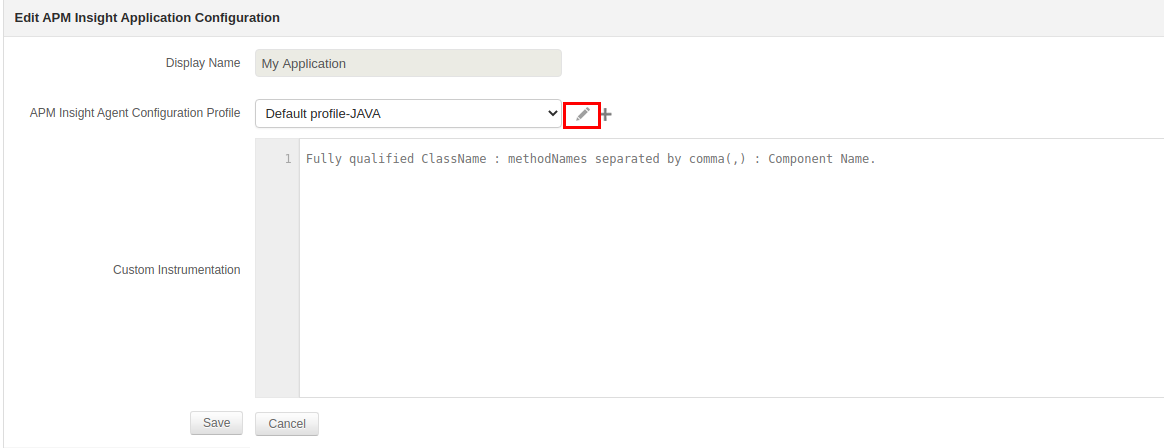
Apart from the default metrics, you can also capture additional metrics by following the below given steps:
Examples:
1. java.lang:type=OperatingSystem java.lang-OperatingSystem OpenFileDescriptorCount
Agent monitors attribute OpenFileDescriptorCount and it will be named as java.lang-OpenFileDescriptorCount
2. java.nio:type=BufferPool,name=* java.nio-BufferPool-{name} MemoryUsed, TotalMemory
The result of above query is that the agent monitors all the beans under the Buffer Pool, and will monitor the attributes memory used and total memory. This will be named as java.nio-BufferPool-Direct-MemoryUsed, etc.
3. com.zaxxer.hikari:type=Pool\ (HikariPool-1) com.zaxxer.hikari.Pool ActiveConnections, TotalConnections
Spaces in the query name should be escaped with a backslash (") before them so that the agent can properly parse the entire query string. In the preceding example, the whitespace between Pool and (HikariPool-1) has been escaped because "Pool (HikariPool-1)" is a complete name in itself.
If you do not want to monitor JMX metrics, you can disable the Capture JMX metrics checkbox under Configuration Profile → Edit APM agent configuration profile → Background transactions.
Thank you for your feedback!