Application: E-commerce store built using Spring Framework
Java Version: Java 11
Database: MySQL
Request Load: 2,000 HTTP requests per minute
Test Duration: 1 hour
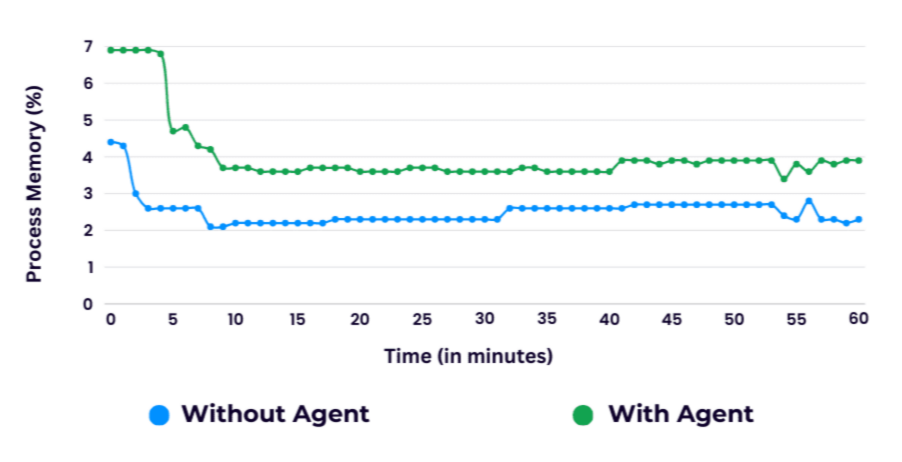
Memory Consumption
The APM Insight Java agent consumes between 100 MB and 800 MB of memory depending on the load and configuration.
Peak consumption (around 800 MB) may occur when full transaction tracking (including traces, exceptions, etc.) is enabled.
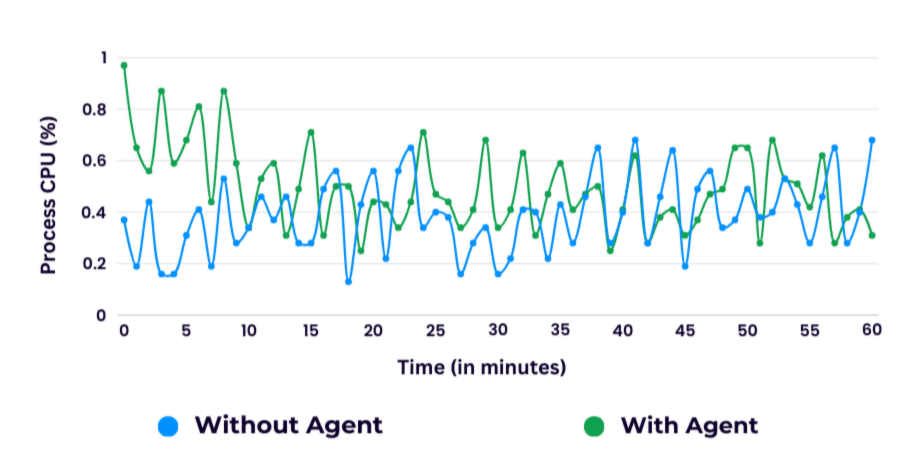
CPU Usage
The agent introduces a maximum of 2% additional CPU load compared to running the application without monitoring.
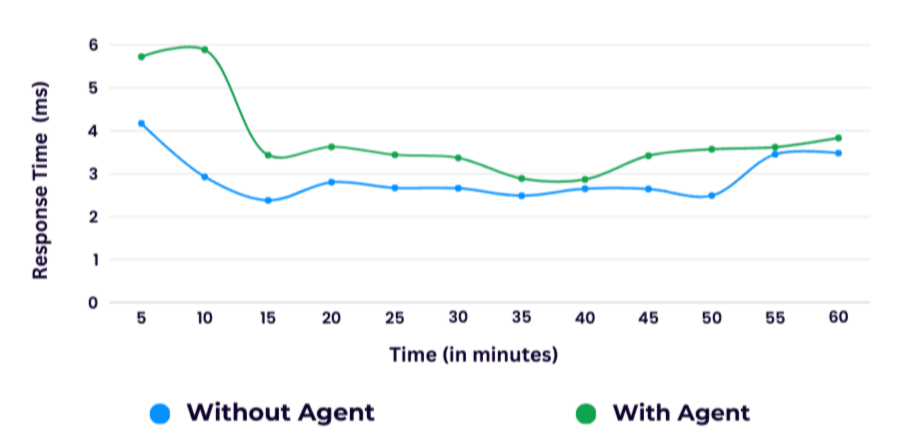
Response Time Overhead
When configured with default instrumentation to track all method calls, the Java agent adds an overhead of approximately 3.5%–3.7% to the response time.
This overhead increases proportionally with the number of methods and classes instrumented (e.g., with extensive custom instrumentation).
Network Bandwidth Usage
The Java agent communicates via one-way HTTPS to the monitoring server at a frequency of once per minute.
Maximum bandwidth usage is approximately 5 MB per hour, making it highly efficient for continuous monitoring.