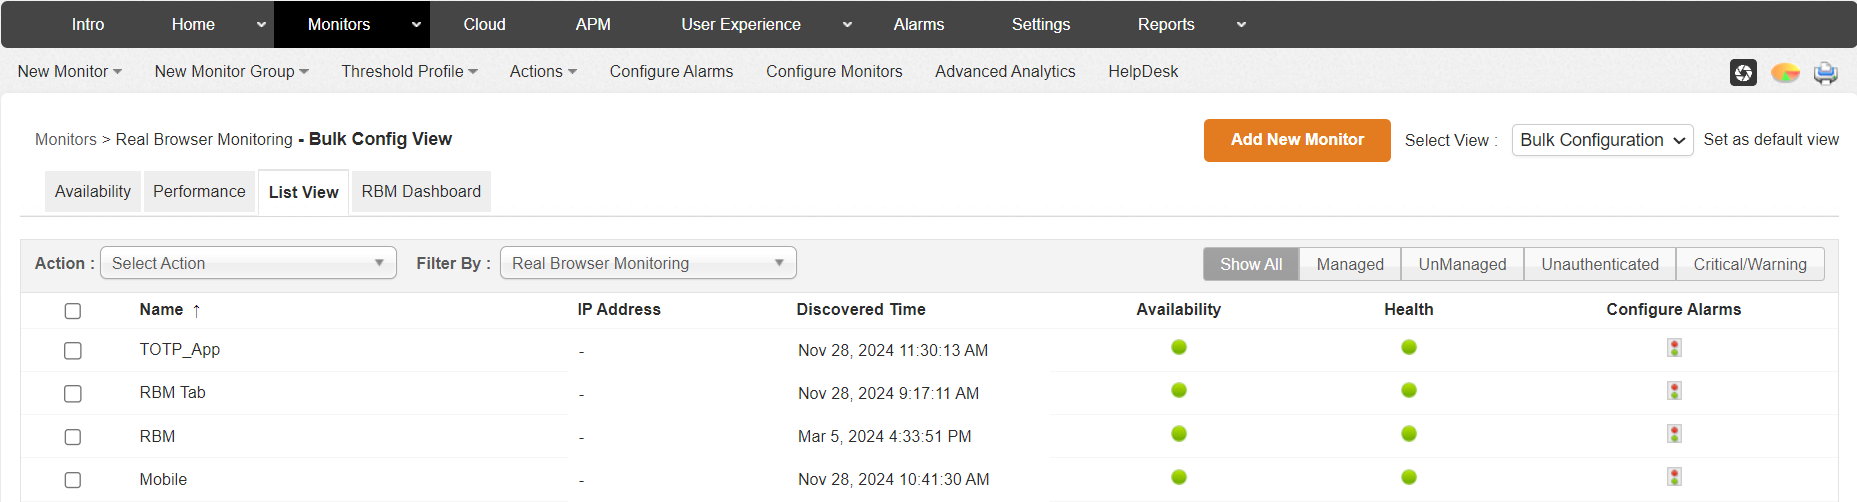
Click on the Monitors tab to access the Monitors Category View and select Real Browser Monitoring from the Web Server/Services category. The RBM bulk configuration view will be displayed, organized into four tabs:
Following are the list of metrics shown in the Real Browser monitor's details page under the corresponding tabs:
| Parameter | Description |
|---|---|
| Name | The display name configured for the monitor. (The EUM Agent's name will be appended at the end for the individual synthetic transaction mapped to the agents) |
| Page Load Timeout (in seconds) | The maximum seconds the synthetic transaction will wait for a webpage to load completely before attempting a timeout. |
| Show Performance Metrics | Indicates whether the 'Network requests' waterfall graph for each step will be displayed or not. |
| Associated Groups | The monitor groups to which the particular monitor is linked. |
| Think Time (in seconds) | The total amount of time to wait for the webpage to load between steps, before triggering the next action configured in the synthetic transaction. |
| Show Screenshot | Indicates whether the screenshots captured at each step will be displayed or not. |
| Accept untrusted/expired certificate | Indicates whether untrusted or expired SSL certificates will be accepted in order to proceed to the next step in the configured synthetic transaction. |
The metrics in the following table will be displayed on the summary page, which shows the performance summary of all the agents to which the particular synthetic transaction is mapped.
| Parameter | Description |
|---|---|
| EUM Agents | |
| RBM | The name of the Real Browser monitor, appended with the names of the EUM agents it is linked to. |
| Average Page Load Time (in ms) | The average time taken to complete a single step of the synthetic transaction. (A single synthetic transaction may have multiple steps) |
| Transaction time (in ms) | The time taken to complete all the steps of the synthetic transaction. |
| Step page load time (ms) by location | |
| Steps | The display names of the steps configured to be executed under the synthetic transaction, along with the time taken for each step (in ms). |
The following performance metrics will be displayed on the detailed monitor page when you click on an individual monitor in the EUM Agents table.
| Parameter | Description |
|---|---|
| AVERAGE PAGE LOAD TIME | |
| Average Page Load Time | The average time taken to complete a single step of the synthetic transaction (in ms). (A synthetic transaction may consist of multiple steps) |
| TRANSACTION TIME | |
| Transaction time | The time taken to complete all the steps of the synthetic transaction (in ms). |
| Page Load Time (ms) of Steps | |
| Page Load Time (ms) of Steps | A graphical representation of the time taken to complete the steps configured under the synthetic transaction. |
| Step page load time (ms) by location | |
| Steps | A snapshot of the steps configured to be executed under the synthetic transaction, including the display name of each step, the time taken to complete each step (in ms), and its current health status. |
| Screenshots | |
| Screenshots | This section includes a series of screenshots of the webpage loaded during the corresponding steps of the synthetic transaction added for monitoring. |
| Resource size % | A graphical representation of the resource size breakdown for the webpage loaded during the corresponding steps of the synthetic transaction. (The recorded resource types include HTML, CSS, Script, Image, etc) |
| Resource count % | A graphical representation of the breakdown of the count of resources loaded for the webpage during the corresponding steps of the synthetic transaction. (The recorded resource types include HTML, CSS, Script, Image, etc) |
| Resource Name | The list of resources (primarily URLs) that load in the background for the webpage to load completely. |
| Status Code | The response code of the resources that load in the background for the webpage to load completely. |
| Size in KB | The size of the resources that load in the background for the webpage to load completely (in KB). |
| Content Type | The content type of the resources that load in the background for the webpage to load completely. |
| Network Performance | |
| Redirection Time | The time taken for the browser to redirect from one URL to another, such as from a shortened URL to the complete URL. |
| Domain Lookup Time | The time taken to resolve a domain name into an IP address. |
| Connection Time | The time taken for the browser to establish a TCP connection with the website's IP address. |
| Secure Connection Time | The time taken to establish a secure connection (e.g., SSL/TLS) between client and server. |
| Network Latency | The delay for data to travel from the source to the destination. |
| Download Time | The total time required to receive the complete response, including the final byte of the webpage, from the source server. |
| Blocking Time | The duration for which the request from the browser is stalled or delayed before being dispatched to the source server of the website. |
| Duration | The total time taken to complete the entire process of loading a webpage, from the initiation of the browser request to the completion of resource downloads and the readiness for use. |
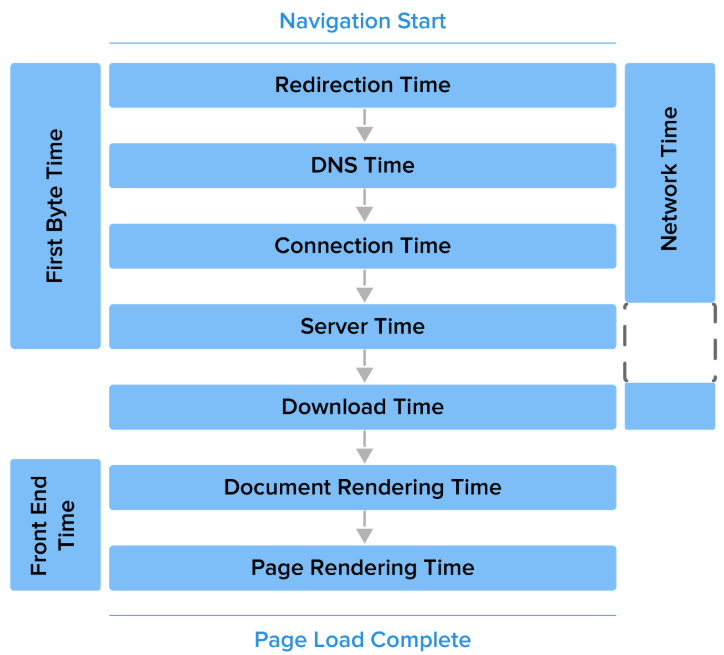
The following diagram shows the different stages of loading a webpage, monitored by the Real Browser Monitor (RBM):
Thank you for your feedback!