Integrating APM Insight with RUM (Real User Monitoring) enables organizations to achieve a holistic understanding of application performance and deliver a superior user experience. This powerful combination ensures that both backend processes and user interactions are optimized, leading to greater efficiency, customer satisfaction, and business success.
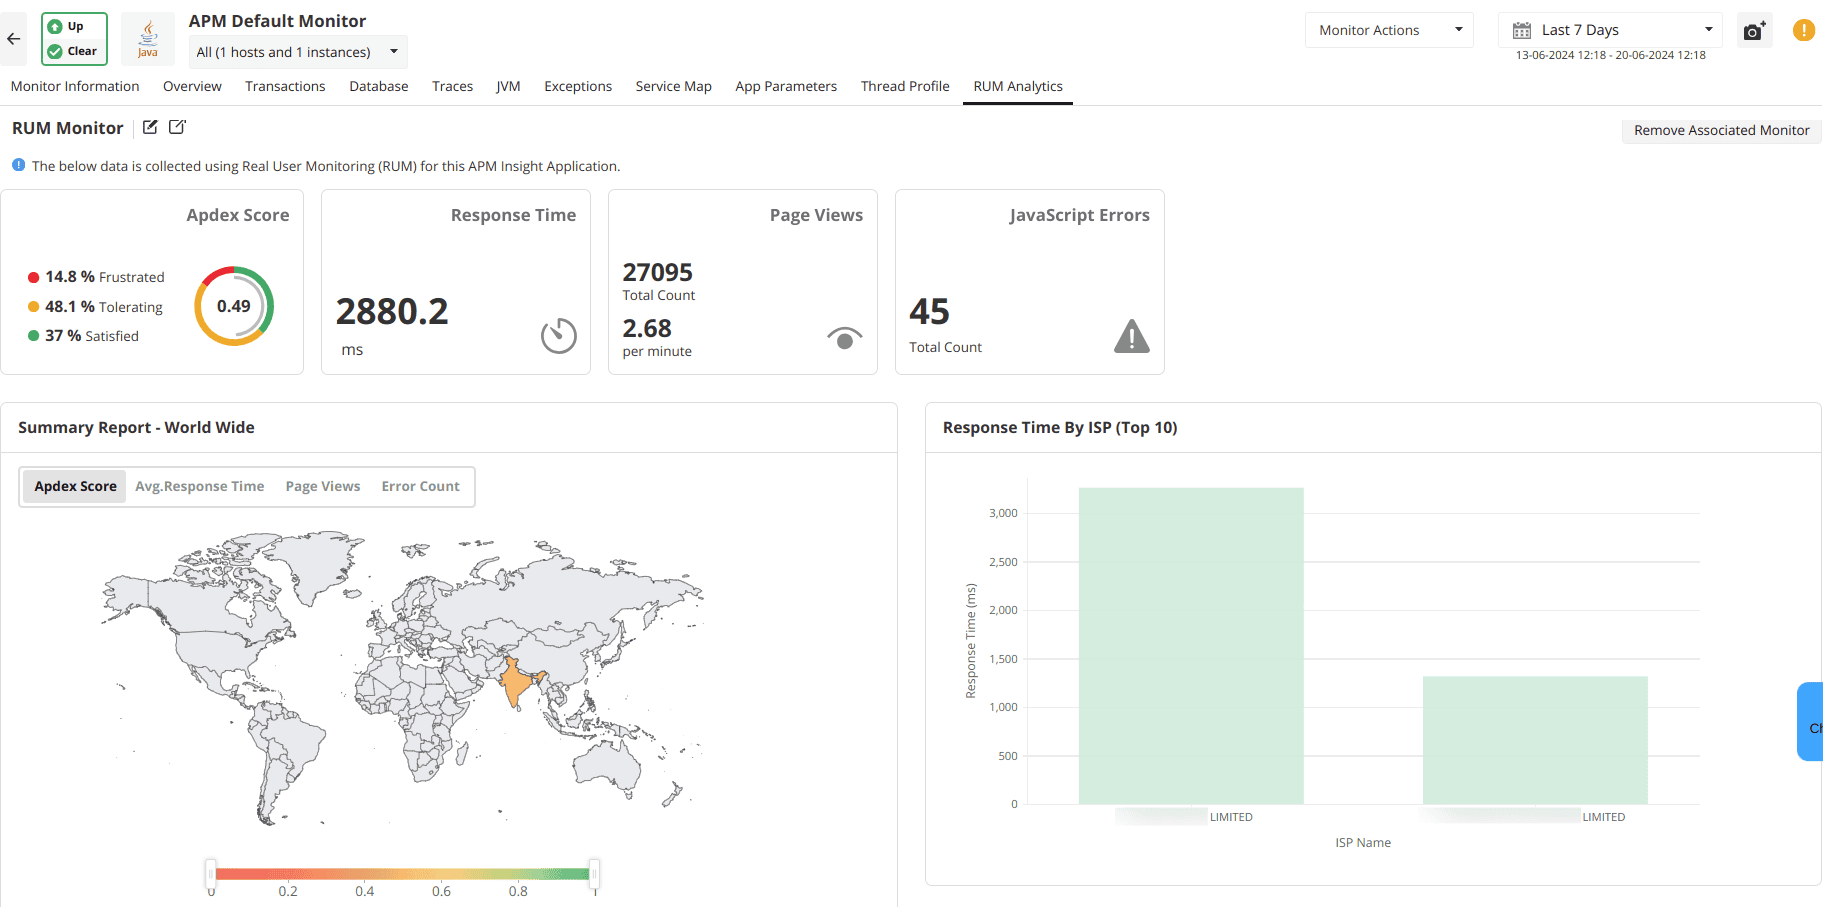
The RUM Analytics tab offers a view of key RUM metrics in the same console as the APM Insight monitor. Users can analyze the KPIs of the RUM monitor alongside those of APM Insight, providing a complete view of application performance, encompassing both server-side and client-side metrics.
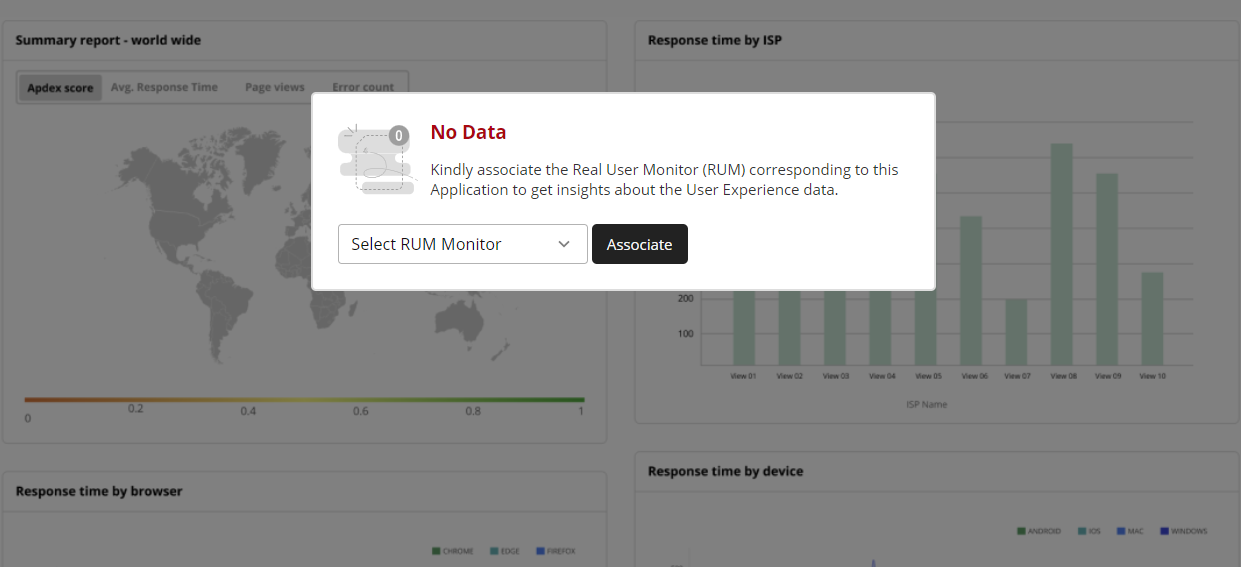
To set up the integration, select the required RUM Monitor from the dropdown and click on Associate. With this, data collected from the selcted RUM Monitor will be displayed for the integrated APM Insight application.
With the RUM Analytics tab you can analyse:
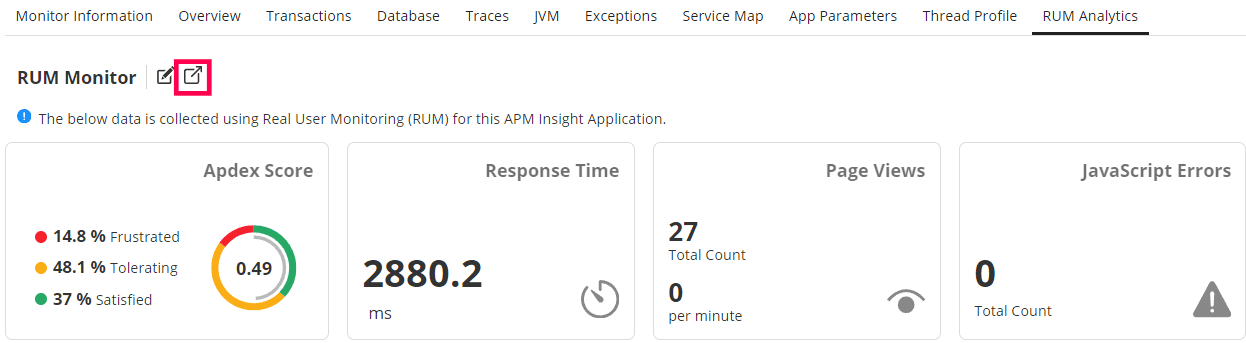
You can easily navigate to the RUM Dashboard and view the full set of RUM metrics by clicking on the popup button present next to the name of the associated monitor.
Thank you for your feedback!