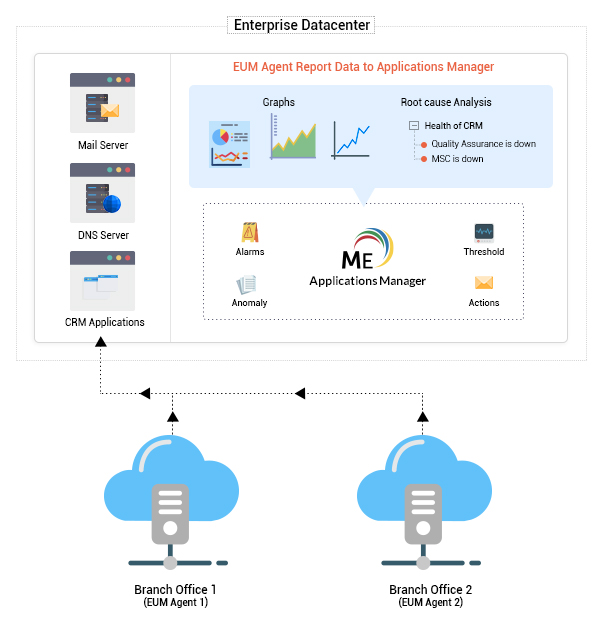
End User Experience monitoring provides the ability to monitor the health and performance of services from multiple locations outside your corporate firewall. End user experience monitoring tools like Applications Manager's End User monitoring (EUM) provides greater visibility into the user experience and behaviors of these services and helps in detecting potential performance problems before end users are affected. It also enables you to take steps to improve the user experience of business-critical services.
End user monitoring can be enabled by installing agents in client locations and configuring your monitors to make use of these agents for monitoring. The monitors currently supported by the EUM agent include Ping, Telnet, DNS, Mail Server, LDAP server and Real Browser Monitor (RBM).
In this help document, you will learn how to perform end user experience monitoring with the help of Applications Manager's End user application monitor. Browse through the following topics to understand End User monitoring (EUM) better:
End user monitoring enables IT operations to ensure that the real end users of an application or service are experiencing good performance. Since the EUM agents take care of collecting and reporting data, the IT administrator is able to accurately keep track of the performance of services without needing to take any additional steps.
To configure EUM monitors, you have to download EUM agents, install them in your branch offices or customer locations, and install Applications Manager server in your head office. Once these agents are enabled, they will collect data about the service performance from these locations and pass it on to the central Applications Manager server. This data will then be processed by Applications Manager and used for measuring the end user experience.

The EUM agents can be installed in multiple branch offices in different cities or in the systems of your end users. All you need is a secure https connection between the agent and the Applications Manager server.
The EUM agent pings the Applications Manager server at specific time intervals and gathers information such as the service configuration details. The service will then be executed from the remote location and the results passed on to the central Applications Manager server. Based on the metrics received from the agent, the Applications Manager server measures the performance of these services and generates performance charts. Some of the performance metrics displayed in the monitor details page include response time from different locations, outage report based on locations, etc.
Based on the information shown in the EUM monitor, the IT team can determine how the service is performing from different locations. If there is a performance issue in a particular agent, Applications Manager's End user application monitor can help them troubleshoot, initiate root cause analysis, isolate the real performance issue and resolve them before end users are affected.
Thank you for your feedback!